A/B Testing And Causal Inference
Asked of: Data Scientist
Last updated
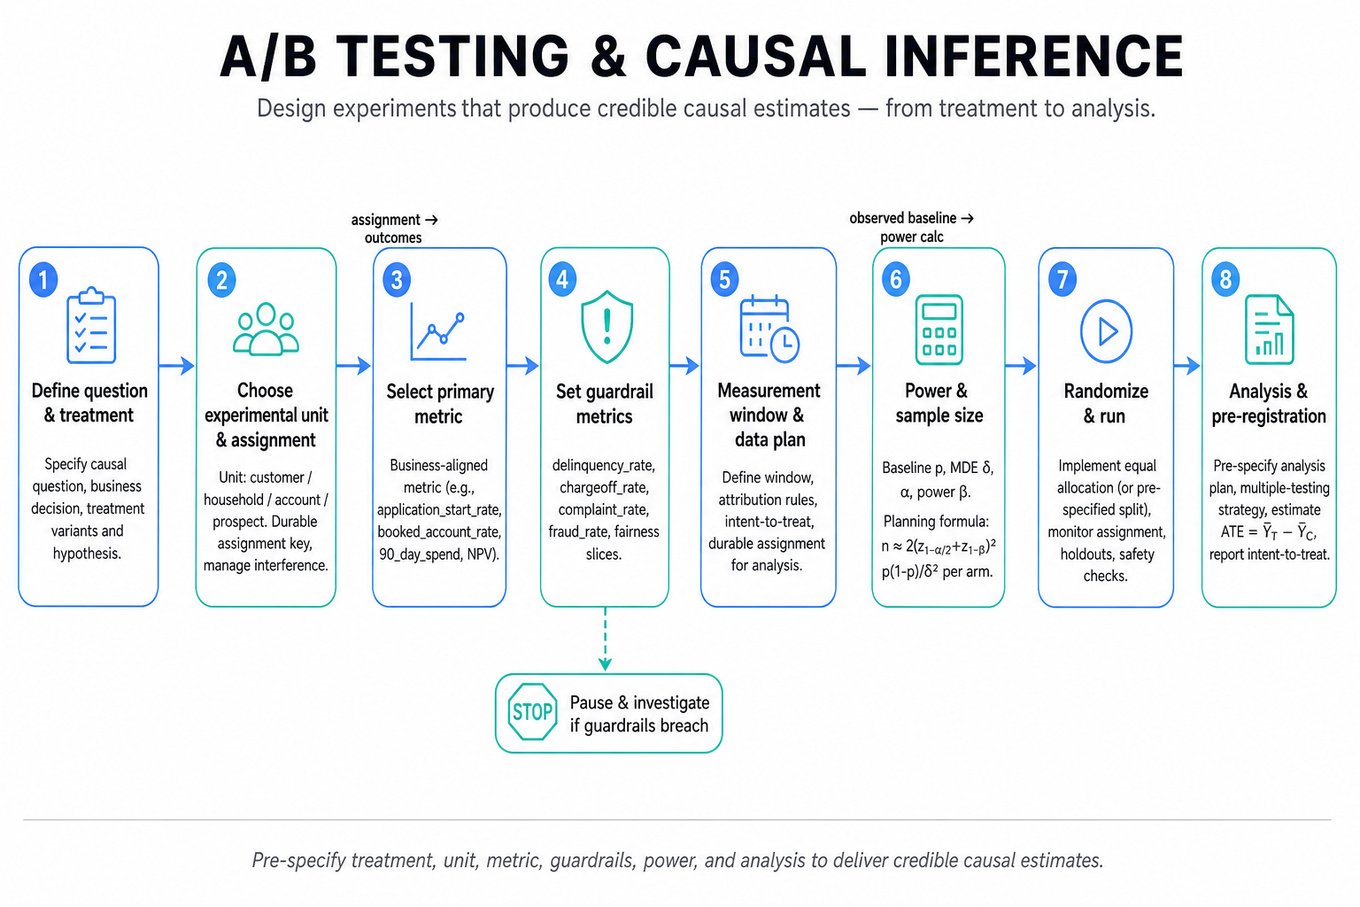
What's being tested
Capital One is probing whether you can turn a business decision into a credible causal estimate, not just report a before/after lift. For a Data Scientist, that means defining the treatment, unit of randomization, primary metric, guardrails, measurement window, power, and analysis plan before looking at results. In credit cards, marketing, and digital product changes, bad experimentation can create biased profit estimates, unfair customer outcomes, compliance risk, or over-optimistic acquisition forecasts. Strong answers show statistical rigor, business judgment, and an ability to explain tradeoffs to product, marketing, risk, and legal stakeholders without drifting into data engineering implementation details.
Core knowledge
-
Randomized controlled trials estimate causal impact by making treatment independent of potential outcomes: . The target is often average treatment effect: , estimated by when assignment is valid.
-
Experimental unit must match the decision and interference risk. For a card offer, randomize at customer, household, account, or prospect level depending on exposure sharing. If one customer can see multiple channels, define a durable assignment key and analyze by intent-to-treat.
-
Primary metrics should connect to the business decision. For card acquisition, candidates include
application_start_rate,approval_rate,booked_account_rate,activation_rate,90_day_spend,net_present_value, or risk-adjusted profit. Avoid optimizing clicks if the true decision is profitable approved accounts. -
Guardrail metrics protect against harmful “wins.” In financial products, use
delinquency_rate,chargeoff_rate,complaint_rate,adverse_action_rate,fraud_rate,customer_contact_rate, and fairness slices by protected-class proxies where appropriate. A campaign that increases approvals but worsens loss-adjusted margin may be a no-launch. -
Power and sample size require a baseline rate, variance, minimum detectable effect, significance level, and power. For a two-sample proportion test with equal allocation, a rough planning formula is
per arm, where is the absolute MDE. -
Multiple testing matters when testing many segments, outcomes, or creative variants. Pre-register one primary metric, treat segment reads as exploratory, or adjust using Bonferroni, Holm-Bonferroni, or Benjamini-Hochberg depending on whether controlling family-wise error or false discovery rate is appropriate.
-
Sequential testing is not “peek whenever and stop at .” Repeated looks inflate false positives. Use fixed-horizon analysis, alpha spending, group sequential methods, or Bayesian monitoring rules agreed in advance; otherwise report results as exploratory.
-
Sample ratio mismatch is a first-line validity check. If a planned 50/50 test produces 56/44 assignment, investigate targeting, eligibility, opt-outs, or logging signals before interpreting lift. The DS should diagnose from metric and assignment tables, not design event ingestion systems.
-
Noncompliance and contamination are common in marketing tests. If treatment-assigned customers do not receive the offer, intent-to-treat estimates policy impact; treatment-on-the-treated may require instrumental variables using assignment as the instrument, with assumptions stated clearly.
-
Variance reduction can improve sensitivity. CUPED adjusts for pre-period covariates: , where is predictive of outcome and unaffected by treatment. Use it for spend or engagement metrics with stable pre-period behavior, not for new prospects without history.
-
Causal inference without randomization requires stronger assumptions. Difference-in-differences needs parallel trends; matching or weighting needs no unobserved confounding and overlap; regression discontinuity needs no manipulation around the threshold. Always state the identification assumption and show diagnostics.
-
Heterogeneous treatment effects help target policies but can overfit. Methods include causal forests, T-learners, S-learners,
XGBoost, doubly robust learners, and uplift models. Evaluate with out-of-sample uplift/Qini curves, calibration by CATE decile, overlap checks, and business constraints such as fairness and adverse selection.
Worked example
For “Design A/B Test for Marketing Campaign Impact Evaluation,” a strong candidate starts by clarifying the campaign objective: incremental approved card acquisitions, incremental spend from existing cardholders, or long-term risk-adjusted profit. They would ask who is eligible, which channels are involved, whether customers can receive competing offers, and what time horizon matters for business value, such as 30-day applications and 90-day activation/spend.
The answer can be organized around four pillars: experiment design, metric framework, statistical plan, and risk/launch decision. For design, define the treatment as receiving the marketing campaign and randomize at the customer or prospect level, with a holdout control that receives business-as-usual messaging. For metrics, choose one primary metric like incremental booked_account_rate or 90_day_risk_adjusted_profit, plus funnel diagnostics such as impression_rate, click_rate, application_start_rate, approval_rate, and activation_rate.
For statistics, precompute sample size using baseline conversion and MDE, then analyze as intent-to-treat with confidence intervals and possibly logistic regression or CUPED if pre-period covariates improve precision. For risk, monitor delinquency_rate, complaints, opt-outs, and fairness slices, and define rollback criteria before launch.
A key tradeoff is whether to maximize short-term acquisitions or risk-adjusted long-term value. Optimizing approvals alone may favor applicants who are less profitable after losses, while waiting for chargeoff outcomes may take months; a practical compromise is a primary near-term metric with validated proxy guardrails. Close by saying that, with more time, you would add heterogeneous treatment effect analysis to identify which customer segments respond profitably without expanding offers to high-risk or poorly served groups.
A second angle
For “Build a causal ML pipeline end-to-end,” the same causal logic applies, but the goal shifts from estimating one average lift to learning who should receive a treatment. You would frame the estimand as CATE: , then discuss randomized or observational training data, overlap, confounding controls, and off-policy evaluation before deployment. Instead of only asking “did the campaign work?”, the interviewer expects you to ask “for which customers does the treatment create incremental value, and how confident are we?”
The constraints are also different: policy learning can create feedback loops if high-score customers are always treated, reducing future exploration. A strong answer includes exploration holdouts, uplift calibration, sensitivity analysis, and fairness checks across customer segments. The bridge back to experimentation is that even a sophisticated causal ML model ultimately needs prospective validation through an A/B test or randomized holdout.
Common pitfalls
Pitfall: Reporting correlation as causal impact.
A tempting answer is “customers who saw the offer had 20% higher spend, so the campaign increased spend by 20%.” That ignores selection: high-value customers may have been more likely to be targeted or reachable. A better answer separates randomized assignment, actual exposure, and outcome, then states whether the estimate is intent-to-treat, treatment-on-treated, or observational with assumptions.
Pitfall: Choosing a metric that is easy instead of decision-relevant.
Click-through rate and application starts are useful diagnostics, but they are rarely sufficient for a credit-card launch decision. If the primary metric is too shallow, the test may reward misleading creative that attracts unprofitable or ineligible applicants. Tie the primary metric to incremental booked accounts, activation, spend, or risk-adjusted profit, with guardrails for credit, fraud, complaints, and fairness.
Pitfall: Sounding statistically sophisticated but operationally vague.
Interviewers do not need a lecture on every causal estimator. They want a concrete plan: unit of randomization, eligibility, treatment/control definitions, sample size, duration, metric windows, validity checks, and decision rule. Use advanced methods like doubly robust estimation or causal forests only after explaining the simpler experimental baseline and why the extra complexity is needed.
Connections
Interviewers may pivot from here into metric design, segmentation and cohort analysis, model evaluation, fairness in lending, or incrementality measurement for marketing channels. They may also ask how you would diagnose a surprising result, such as a conversion lift with worse profit, a segment reversal, or sample ratio mismatch.
Further reading
-
Trustworthy Online Controlled Experiments — Kohavi, Tang, Xu — Practical experimentation design, metrics, power, variance reduction, and interpretation pitfalls.
-
Causal Inference for Statistics, Social, and Biomedical Sciences — Imbens and Rubin — Rigorous potential-outcomes foundation for randomized and observational causal inference.
-
Causal Inference: What If — Hernán and Robins — Free, detailed treatment of causal estimands, confounding, weighting, and longitudinal decision problems.
Featured in interview prep guides
Practice questions
- Design fundraising experiment and guardrailsCapital One · Data Scientist · Onsite · medium
- Design a better water bottle and test itCapital One · Data Scientist · Onsite · medium
- Optimize amusement park pricing, capacity, and testingCapital One · Data Scientist · Technical Screen · hard
- Design metrics and an A/B test for an appCapital One · Data Scientist · Technical Screen · medium
- Build a causal ML pipeline end-to-endCapital One · Data Scientist · Onsite · hard
- Design and analyze an SBA mini case experimentCapital One · Data Scientist · Technical Screen · hard
- Design profit evaluation for loyalty programCapital One · Data Scientist · Technical Screen · hard
- Design and analyze ads A/B test this weekCapital One · Data Scientist · Online Assessment · hard
- Design A/B test for credit card offerCapital One · Data Scientist · Technical Screen · hard
- Design and analyze ad A/B testCapital One · Data Scientist · Online Assessment · hard
- Design and analyze a card signup A/B testCapital One · Data Scientist · Technical Screen · hard
- Design A/B Test for Marketing Campaign Impact EvaluationCapital One · Data Scientist · Onsite · medium
Related concepts
- A/B Testing And Causal ExperimentationAnalytics & Experimentation
- A/B Testing And Experiment DesignAnalytics & Experimentation
- A/B TestingAnalytics & Experimentation
- A/B Testing, Power, And Experiment DesignAnalytics & Experimentation
- A/B Testing And Experiment DesignAnalytics & Experimentation
- A/B TestingAnalytics & Experimentation