Evaluation, Statistical Inference, And Class Imbalance
Asked of: Machine Learning Engineer
Last updated
What's being tested
Interviewers are probing whether you can evaluate ML systems under uncertainty, especially when labels are skewed, metrics disagree, or offline results may not transfer online. For an Amazon Machine Learning Engineer, this matters because deployed models often operate on rare but high-impact events: fraud, abuse, churn, defects, delayed deliveries, unsafe content, or low-frequency conversions. You need to reason about class imbalance, bias–variance, statistical significance, metric selection, and distributional differences without hiding behind a single accuracy number. Strong answers show that you can connect modeling choices to reliable evaluation, monitoring, and deployment decisions.
Core knowledge
-
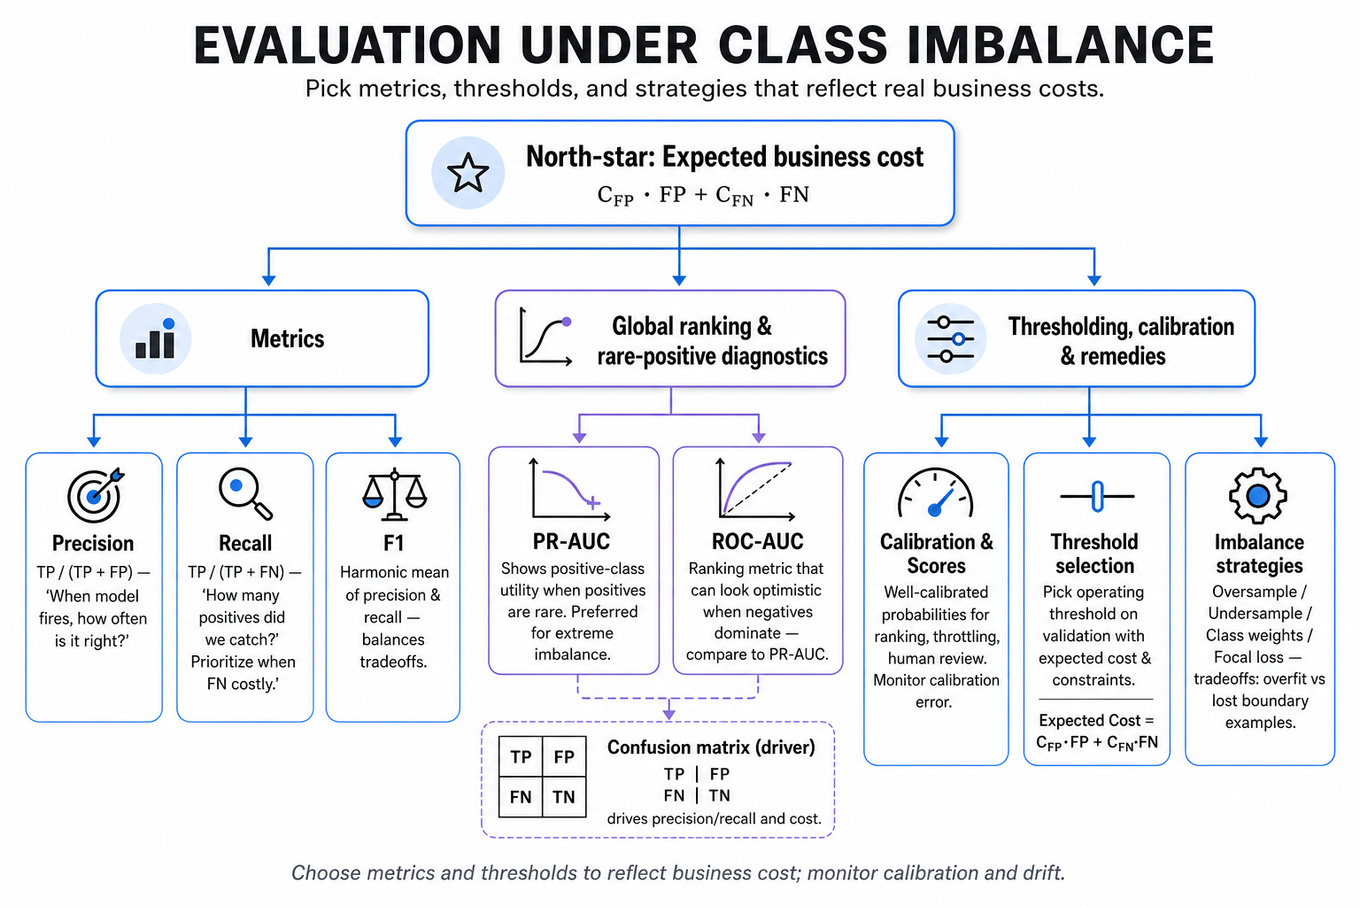
Accuracy is usually misleading under class imbalance. If positives are 0.1%, a model that always predicts negative gets 99.9%
accuracybut zero business or safety value. Preferprecision,recall,F1,PR-AUC,ROC-AUC, calibration error, and cost-weighted metrics. -
Confusion-matrix metrics encode different failure costs.
precision = TP / (TP + FP)answers “when the model fires, how often is it right?” whilerecall = TP / (TP + FN)answers “how many true positives did we catch?” Fraud, abuse, and safety systems often prioritize recall subject to an acceptable false-positive budget. -
ROC-AUCcan look good on heavily imbalanced data whilePR-AUCreveals poor positive-class utility.ROC-AUCmeasures ranking across positives and negatives, but false positives can be cheap in the denominator when negatives dominate.PR-AUCis often more informative when positives are rare. -
Threshold selection is a deployment decision, not just a training artifact. A probabilistic model outputs scores; the operating threshold should be chosen using validation data, target constraints, and expected cost:
Monitor whether the selected threshold remains valid after drift. -
Class imbalance strategies have tradeoffs. Oversampling positives can improve minority recall but increases overfitting risk; undersampling negatives reduces compute but may discard useful boundary examples; class-weighted loss changes optimization emphasis; focal loss downweights easy examples and is common in dense detection or extreme imbalance.
-
Calibration matters when scores drive ranking, throttling, or human review queues. A model with good
AUCcan still produce poorly calibrated probabilities. Use Platt scaling, isotonic regression,Brier score, reliability diagrams, and expected calibration error when downstream systems interpret scores as probabilities. -
Bias–variance tradeoff explains underfitting and overfitting diagnostics. High bias appears as poor training and validation performance; high variance appears as strong training performance but weak validation performance. Remedies include more expressive models, regularization, feature improvements, early stopping, data augmentation, ensembling, or more representative data.
-
Statistical inference is about uncertainty, not just point estimates. A p-value is , not the probability the null is true. For model comparisons, report confidence intervals via bootstrap, paired tests, or repeated folds rather than relying on tiny metric deltas.
-
Paired evaluation is stronger than unpaired evaluation for model comparisons. If two models score the same examples, compare per-example losses or outcomes using a paired bootstrap, McNemar’s test for classification disagreements, or approximate randomization. This reduces variance versus comparing aggregate metrics from unrelated samples.
-
Offline validation must reflect serving-time reality. Use time-based splits for nonstationary systems, entity-level splits to avoid user/item leakage, and shadow or canary deployments before full rollout. Leakage from future features, duplicate examples, or label-generation artifacts can create inflated offline metrics that fail in production.
-
Population-difference testing depends on the object being compared. For a scalar feature, use
t-test, Mann–Whitney U, or Kolmogorov–Smirnov depending on assumptions; for categorical distributions, use chi-square or Fisher’s exact test; for multivariate shift, use classifier-based two-sample tests, MMD, or energy distance. -
Architecture choices affect evaluation failure modes. CNNs encode locality and translation equivariance, often data-efficient for images; Transformers model long-range dependencies via attention but need more data and compute. In interviews, tie architecture back to inductive bias, data size, latency, and generalization—not just popularity.
Worked example
For “Explain imbalance, metrics, bias-variance, Transformers vs. CNNs”, a strong candidate would start by clarifying the task: “Is this binary classification, how rare is the positive class, what are the costs of false positives versus false negatives, and will the model be used for ranking, alerting, or automated action?” Then they would state an assumption, for example: “I’ll assume positives are rare, labels are reasonably reliable, and we can tune a threshold after training.” The answer can be organized into four pillars: evaluation metrics, imbalance handling, generalization diagnostics, and architecture tradeoffs.
For metrics, they should say that accuracy is insufficient and propose PR-AUC, precision at a fixed recall, recall at a fixed false-positive rate, and calibration if scores are consumed downstream. For imbalance handling, they should compare class-weighted loss, resampling, focal loss, and threshold tuning, while noting that resampling changes the training distribution and can affect calibration. For bias–variance, they should describe how training/validation curves diagnose underfitting versus overfitting and connect remedies to the observed pattern. For CNNs versus Transformers, they should avoid a generic “Transformers are better” claim and instead discuss inductive bias, data volume, compute, latency, and input modality.
One explicit tradeoff to flag: maximizing recall can overwhelm a human review queue or downstream service with false positives, so the threshold should often be selected under an operational constraint such as “95% recall with precision above 20%” or “no more than 10,000 alerts per day.” A strong close would be: “If I had more time, I’d validate the selected metric with a cost model, check calibration, run a paired significance test against the baseline, and monitor class prior drift after deployment.”
A second angle
For “Test whether two user populations differ”, the same evaluation mindset shifts from model quality to distributional comparison. A strong answer first asks what “differ” means: label rate, feature distribution, prediction-score distribution, calibration, or downstream error rate. If the goal is to compare one scalar metric, a confidence interval or hypothesis test may suffice; if the goal is broad covariate shift detection, a classifier-based two-sample test can reveal whether one population is predictable from features. The MLE framing should connect the test to model risk: if two populations differ materially, the model may require segmented evaluation, recalibration, reweighting, or separate thresholds. The constraint is that statistical significance at huge sample sizes may detect trivial differences, so effect size and operational impact must be reported alongside p-values.
Common pitfalls
Pitfall: Saying “use
F1for imbalanced data” as a universal answer.
F1 assumes precision and recall are equally important, which is often false. A better answer explains the cost of each error type, chooses metrics such as precision at fixed recall or recall at fixed false-positive rate, and justifies the operating threshold.
Pitfall: Treating p-values as proof that one model is better.
A small p-value does not imply a meaningful effect size, and repeated metric checks can inflate false positives. Strong candidates mention confidence intervals, paired comparisons, multiple-testing correction when relevant, and whether the metric delta is large enough to matter operationally.
Pitfall: Explaining bias–variance only as textbook definitions.
Interviewers expect diagnostic reasoning: what do training and validation curves look like, what interventions follow, and how would you verify improvement? Tie high variance to regularization, more data, early stopping, or simpler models; tie high bias to better features, higher-capacity models, or reduced regularization.
Connections
Interviewers may pivot from here into model monitoring, especially drift detection, online/offline metric parity, and alerting on calibration or class-prior shifts. They may also connect to A/B testing, causal inference, ranking evaluation, or model serving constraints such as latency-driven thresholding and fallback behavior.
Further reading
-
“The Relationship Between Precision-Recall and ROC Curves” by Davis and Goadrich — canonical paper explaining why
PRcurves are often preferable under class imbalance. -
“Imbalanced Learning: Foundations, Algorithms, and Applications” by He and Ma — deep treatment of resampling, cost-sensitive learning, and evaluation under skewed labels.
-
“The Elements of Statistical Learning” by Hastie, Tibshirani, and Friedman — strong reference for bias–variance, model selection, regularization, and supervised learning evaluation.
Featured in interview prep guides
Practice questions
- Explain ML evaluation, sequence models, and optimizersAmazon · Applied Scientist · Onsite · medium
- Test whether two user populations differAmazon · Applied Scientist · Onsite · medium
- Explain core ML concepts and diagnosticsAmazon · Applied Scientist · Technical Screen · medium
- Explain imbalance, metrics, bias-variance, Transformers vs. CNNsAmazon · Applied Scientist · Technical Screen · hard
- Explain ML statistics and model design conceptsAmazon · Applied Scientist · Technical Screen · hard
Related concepts
- Classification Thresholds, Imbalanced Learning And RiskMachine Learning
- Precision-Recall Curves And Classification MetricsStatistics & Math
- Classifier Evaluation, Calibration, And Thresholding
- Statistical Inference, Power, And Confidence IntervalsStatistics & Math
- Classifier Evaluation And Cost-Sensitive ThresholdsMachine Learning
- Statistical Inference, Power, And Metric UncertaintyStatistics & Math