Hypothesis Testing And Confidence Intervals
Asked of: Data Scientist
Last updated
What's being tested
Interviewers are probing your ability to turn noisy observational or experimental data into defensible statements about causal effects and uncertainty: choosing an appropriate test, estimating confidence intervals, and diagnosing threats to validity. For Waymo this matters for routing, safety, and model-rollouts where small real-world differences matter and rare events or repeated measures complicate inference. Expect to justify metric choices, sampling/exclusion rules, and statistical assumptions quickly.
Core knowledge
-
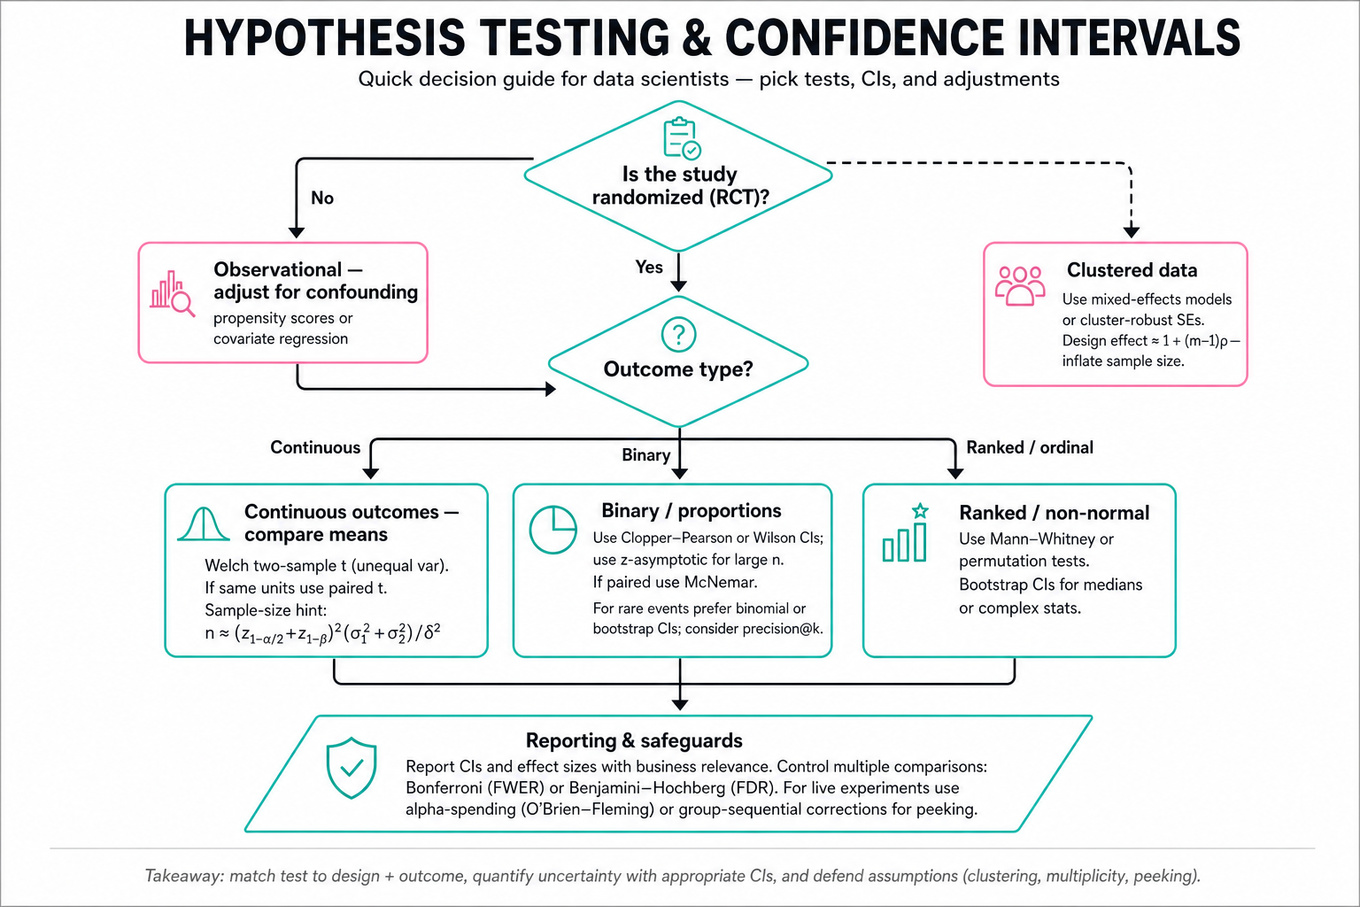
Randomized controlled trial (RCT) vs. observational analysis: RCTs support causal claims under randomization; observational requires explicit confounding adjustment (
propensity scores,covariate regression). -
Intent-to-treat (ITT) vs per-protocol: ITT preserves randomization for unbiased effect on assignment; per-protocol estimates treatment-on-treated but can be biased by post-randomization selection.
-
Welch t-test and two-sample t: use for comparing means with unequal variances; sample-size formula: where is detectable difference.
-
Nonparametric tests: use Mann–Whitney for distributional shifts, permutation tests for exact randomization inference, and bootstrap CIs for medians or complex statistics.
-
Confidence intervals (CI) for proportions: use Clopper–Pearson or Wilson for small counts; for differences use asymptotic z or bootstrap when assumptions fail.
-
Rare-event metrics: prefer precision@k, FDR-controlled lists, and report CIs using binomial or bootstrap; beware unstable AUC with tiny positives.
-
Paired comparisons: when the same units appear in both conditions use paired t or McNemar's test for binary outcomes to leverage reduced variance.
-
Clustered data: account for cluster correlation via mixed-effects models or adjust variance with cluster-robust SEs; design effect ≈ inflates required sample size.
-
Multiple comparisons: control FWER with Bonferroni or FDR with Benjamini–Hochberg when testing many metrics or segments.
-
Sequential testing: live experiments require alpha-spending or sequential correction (e.g., O’Brien–Fleming, group-sequential) to avoid inflated Type I error if you peek.
-
Effect size & business relevance: report absolute and relative effects plus standardized Cohen’s d; combine CI width and minimum detectable effect to argue practical significance.
-
Assumption checks: visualize distributions, check balance by key covariates, test homoskedasticity, and inspect time trends for pre-existing drift or spillovers (violations of SUTVA).
Worked example — Test Whether a Routing Experiment Reduced Pickup Time
First 30s: ask whether randomization unit is trip, driver, or region; how pickup time is defined (request-to-arrival?), treatment assignment timing, and whether there are repeated rides per user or driver. Skeleton answer pillars: (1) Define primary metric and exclusions (e.g., canceled rides, extreme outliers), (2) Data join & deduplication to ensure independent units (or identify clusters), (3) Choose test and CI (Welch t on mean pickup-time or log-transform + bootstrap median CI), (4) Sensitivity checks (ITT, per-protocol, covariate-adjusted regression, cluster-robust SE). A key tradeoff: mean pickup time is sensitive to skew and rare long waits — median gives robust central tendency but smaller policy-relevant differences; choose based on stakeholder loss function. Close by proposing diagnostics: check balance, pre-period trends, subgroup effects, and if more time—run permutation test, mixed-effects model with driver random intercept, and a pre-specified sequential plan.
A second angle — Compare two rare-event detection models statistically
Here the core concept (inference under small counts) is the same but constraints differ: labels are highly imbalanced and evaluation focuses on precision/recall at operating points, not overall means. Use paired evaluations on the same test set and report CIs for sensitivity using Clopper–Pearson, and for differences use bootstrap paired resampling or McNemar on thresholded outputs. If positive labels are extremely scarce, avoid AUC variance approximations; instead do exact/binomial tests and show precision@k with bootstrap CIs. Also consider cost-weighted metrics and decision-theoretic thresholds when reporting statistically significant but operationally negligible improvements.
Common pitfalls
Pitfall: Treating non-normal, skewed time metrics with a t-test without transformation or robust alternatives. This yields misleading p-values and CIs — use log transforms, median+bootstrap, or permutation tests and show both mean and median results.
Pitfall: Ignoring clustering or repeated measures (e.g., multiple rides per user). Naively treating observations as i.i.d. underestimates SEs; adjust with cluster-robust SEs, mixed models, or aggregate-per-unit.
Pitfall: Overemphasizing p-values and not stating practical significance. A tiny but highly significant mean reduction may be irrelevant operationally; always report CIs, absolute effect, baseline rate, and estimated ROI or safety impact.
Connections
Interviewers may pivot to causal inference (instrumental variables, difference-in-differences), sequential/online experimentation (alpha-spending, bandits), or survival/time-to-event analysis (Kaplan–Meier, Cox models) for metrics like time-to-pickup and rare safety incidents.
Further reading
-
[Practical Guide to Controlled Experiments on the Web — Kohavi et al., Microsoft (2009)](Kohavi et al. 2009) — pragmatic lessons on experiment design, metrics, and pitfalls.
-
[Bootstrap Methods and Their Application — Davison & Hinkley](Davison & Hinkley) — solid reference for bootstrap CIs and resampling strategies.
Practice questions
- Test Whether a Routing Experiment Reduced Pickup TimeWaymo · Data Scientist · Online Assessment · medium
- Assess Routing Experiment ValidityWaymo · Data Scientist · Online Assessment · medium
- How compare Waymo turning trajectories statisticallyWaymo · Data Scientist · Technical Screen · easy
- Compare two rare-event detection models statisticallyWaymo · Data Scientist · Onsite · easy
- Compute probability match lasts 5 gamesWaymo · Data Scientist · Technical Screen · easy
Related concepts
- Hypothesis Testing, Power, And Confidence Intervals
- Statistical Inference, Power, And Confidence IntervalsStatistics & Math
- Hypothesis Testing And Confidence Intervals
- Statistical Inference For Proportions And Confidence IntervalsStatistics & Math
- Hypothesis Tests, Confidence Intervals, And P-Values
- Power Analysis And Statistical InferenceStatistics & Math