Propensity Score Matching, DiD And Causal Inference
Asked of: Data Scientist
Last updated
What's being tested
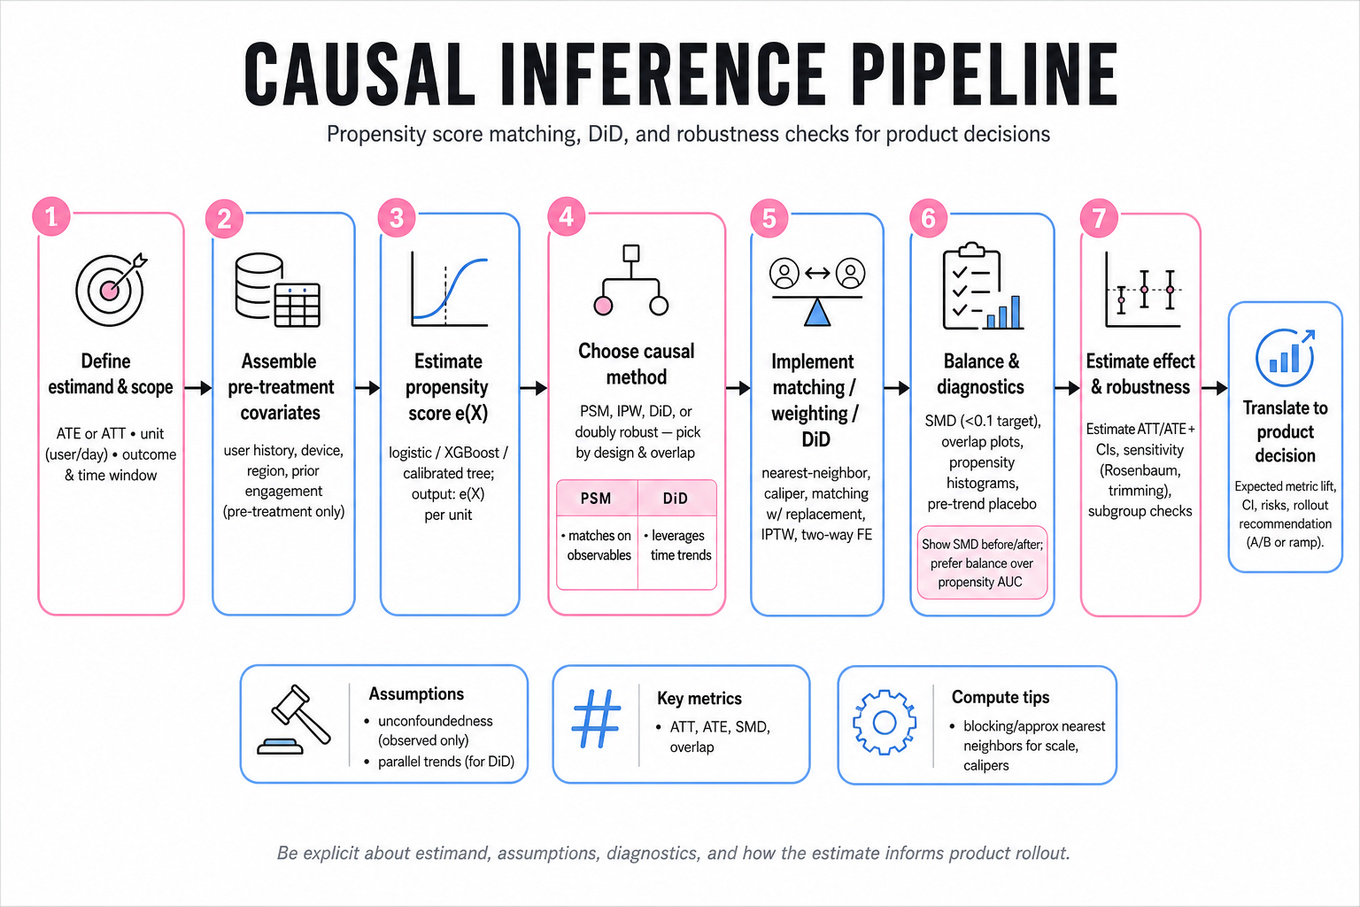
Interviewers are probing whether you can estimate causal impact when randomization is unavailable or imperfect, not just whether you can run a regression. For a TikTok Data Scientist, this matters because many product, ads, commerce, and notification decisions are made from logged observational data where exposed users differ systematically from unexposed users. You need to define the treatment, outcome, unit of analysis, and time window, then choose between methods like propensity score matching, inverse probability weighting, difference-in-differences, or doubly robust estimation. Strong answers show assumptions, diagnostics, sensitivity checks, and how the estimate would guide a product decision.
Core knowledge
-
Causal estimands must be explicit: ATE estimates for the whole population, while ATT estimates for treated users. For
TikTokproduct launches, ATT is often natural if asking “what happened to users who received the feature?” -
Potential outcomes frame the missing-data problem: each user has and , but only one is observed. The causal effect is not simply unless treatment is independent of potential outcomes.
-
Confounding occurs when pre-treatment variables affect both treatment and outcome. For example, heavy
TikTokusers may be more likely to receive notifications and also more likely to retain, inflating the apparent impact of notification exposure onD7_retention. -
Propensity score is , usually estimated with
logistic regression,XGBoost, or calibrated tree models. It reduces many covariates into one balancing score, but it only adjusts for observed pre-treatment covariates, not hidden motivation or intent. -
Matching pairs treated and control units with similar propensity scores or covariates. Common choices are nearest-neighbor matching, caliper matching, exact matching on key segments, and matching with replacement. For millions of users, exact pairwise matching can be expensive; use blocking, calipers, or approximate nearest neighbors.
-
Balance diagnostics matter more than propensity model AUC. Check standardized mean differences before and after matching:
A common target is absoluteSMD < 0.1for important covariates. -
Overlap, also called positivity, requires comparable treated and control users across the covariate space: . If high-value creators always receive a feature and low-activity users never do, causal effects are only credible within the overlapping segment.
-
Difference-in-differences estimates treatment impact by comparing outcome changes over time:
It is useful when treated and control groups differ in levels but would have followed parallel trends absent treatment. -
Parallel trends should be tested visually and quantitatively using multiple pre-periods. If treated users’
watch_timeorrepurchase_ratewas already accelerating before exposure, a simple DiD estimate may attribute an existing trend to the intervention. -
Regression adjustment can complement matching or DiD. A typical DiD regression is with user and time fixed effects. Use clustered standard errors at the user, creator, market, or campaign level when outcomes are correlated.
-
Doubly robust estimation combines propensity weighting with outcome modeling. Methods like AIPW remain consistent if either the propensity model or outcome model is correctly specified, making them attractive for observational ad lift or notification impact studies.
-
Heterogeneous treatment effects ask who benefits, not just whether the average effect is positive. Use causal forests, meta-learners such as T-learners, S-learners, X-learners, or uplift models, but validate with honest sample splitting and avoid turning noisy subgroup effects into targeting policy.
Worked example
For Design causal measurement without randomization, a strong candidate would first clarify: “What exactly is the treatment: eligibility for the notification feature, actual notification sent, or notification opened?” They would also ask for the unit, likely user-level; the outcome, such as D7_retention; and the exposure and observation windows, such as feature exposure on day 0 and retention over days 1–7.
The answer skeleton should have four pillars. First, define a causal estimand, probably ATT: the impact on users who actually became eligible or received the notification. Second, draw the likely confounders: prior app opens, watch time, session frequency, country, device, tenure, notification settings, creator follows, historical retention, and prior push engagement. Third, propose a method: start with propensity score matching or inverse probability weighting using only pre-treatment covariates, then consider DiD if there are repeated pre/post outcomes. Fourth, discuss diagnostics: propensity overlap, covariate balance, placebo tests on pre-period outcomes, and sensitivity to calipers or model choice.
A specific tradeoff to flag is treatment definition. Estimating the effect of “notification opened” is more biased than estimating the effect of “notification sent” because openers are intrinsically more engaged; if logs support it, eligibility or send assignment is closer to an intervention. The candidate should close by saying that if more time were available, they would run robustness checks with doubly robust estimation, segment by new versus mature users, and compare the observational estimate to any future randomized holdout.
A second angle
For Analyze Negative Reviews' Impact on Coupon Repurchase Rate, the treatment is not a product exposure but an experience: receiving or seeing negative reviews before deciding whether to repurchase a coupon. The same causal machinery applies, but the confounding story changes: users who encounter negative reviews may be shopping different merchants, categories, price points, or deal types. A strong answer would define the unit as user-coupon or user-merchant, use pre-review covariates like historical purchase frequency, merchant rating, coupon discount, category, geo, and prior refund behavior, then estimate impact on coupon_repurchase_rate. DiD may be especially useful if the same merchants or cohorts can be observed before and after review shocks, but the candidate must check whether treated and comparison merchants had parallel repurchase trends before the negative reviews appeared.
Common pitfalls
Pitfall: Treating observational comparison as an A/B test.
A weak answer says, “Compare retention for users who got the feature versus users who did not.” That ignores selection bias. A better answer states the causal assumption explicitly: after conditioning on pre-treatment covariates, treatment assignment is as-good-as-random, then validates that assumption through balance, overlap, placebo outcomes, and sensitivity checks.
Pitfall: Optimizing the propensity model for prediction instead of balance.
A high AUC propensity model may separate treated and control users so well that there is little overlap, making matching unreliable. The goal is not to predict treatment perfectly; it is to create comparable groups. Report standardized mean differences, propensity score distributions, matched sample size, and which population the final estimate applies to.
Pitfall: Communicating only the method, not the decision implication.
Interviewers do not want a lecture that ends with “I would use PSM.” They expect an interpretation like: “If the ATT is +1.2 percentage points in D7_retention, confidence interval excludes zero, balance is acceptable, and placebo tests pass, I would recommend rollout for overlapping user segments, but not extrapolate to users outside support.”
Connections
Interviewers may pivot from here to A/B testing, sample ratio mismatch, metric design, uplift modeling, or off-policy evaluation for ranking and notification policies. They may also ask how you would combine causal estimates with product constraints such as user fatigue, long-term retention, creator ecosystem effects, or fairness across markets.
Further reading
-
Causal Inference: The Mixtape — Practical coverage of DiD, matching, fixed effects, and modern causal designs.
-
Imbens and Rubin, Causal Inference for Statistics, Social, and Biomedical Sciences — Rigorous foundation for potential outcomes, propensity scores, and treatment effects.
-
Athey and Imbens, “Recursive Partitioning for Heterogeneous Causal Effects” — Key reference for causal trees and heterogeneous treatment effect estimation.
Featured in interview prep guides
Practice questions
- Investigate visit–report correlation causalityTikTok · Data Scientist · Technical Screen · hard
- Control confounding in observational ad liftTikTok · Data Scientist · Onsite · hard
- Interpret and validate regression with interactionsByteDance · Data Scientist · Technical Screen · hard
- Estimate heterogeneous treatment effects with causal MLTikTok · Data Scientist · Technical Screen · hard
- Use DiD for staggered treatment adoptionTikTok · Data Scientist · Technical Screen · hard
- Apply PSM rigorously for observational A/B analysisTikTok · Data Scientist · Technical Screen · hard
- Design causal measurement without randomizationTikTok · Data Scientist · Technical Screen · hard
- Investigate Declining ROI and Propose Effective SolutionsTikTok · Data Scientist · Technical Screen · hard
- Analyze Negative Reviews' Impact on Coupon Repurchase RateTikTok · Data Scientist · Technical Screen · medium
- Measure Billboard Campaign Effectiveness and Engagement QuantificationTikTok · Data Scientist · Onsite · hard
- Investigating Correlation Between Ad Visits and ReportsTikTok · Data Scientist · Technical Screen · medium
Related concepts
- Propensity Score Matching And Observational Causal InferenceAnalytics & Experimentation
- Causal Inference, Confounding, And MatchingAnalytics & Experimentation
- Propensity Score MatchingStatistics & Math
- Causal Inference And Difference-In-DifferencesAnalytics & Experimentation
- Difference-In-Differences And Quasi-ExperimentsAnalytics & Experimentation
- Causal Inference And IdentificationStatistics & Math