Statistical Inference For Experiments
Asked of: Data Scientist
Last updated
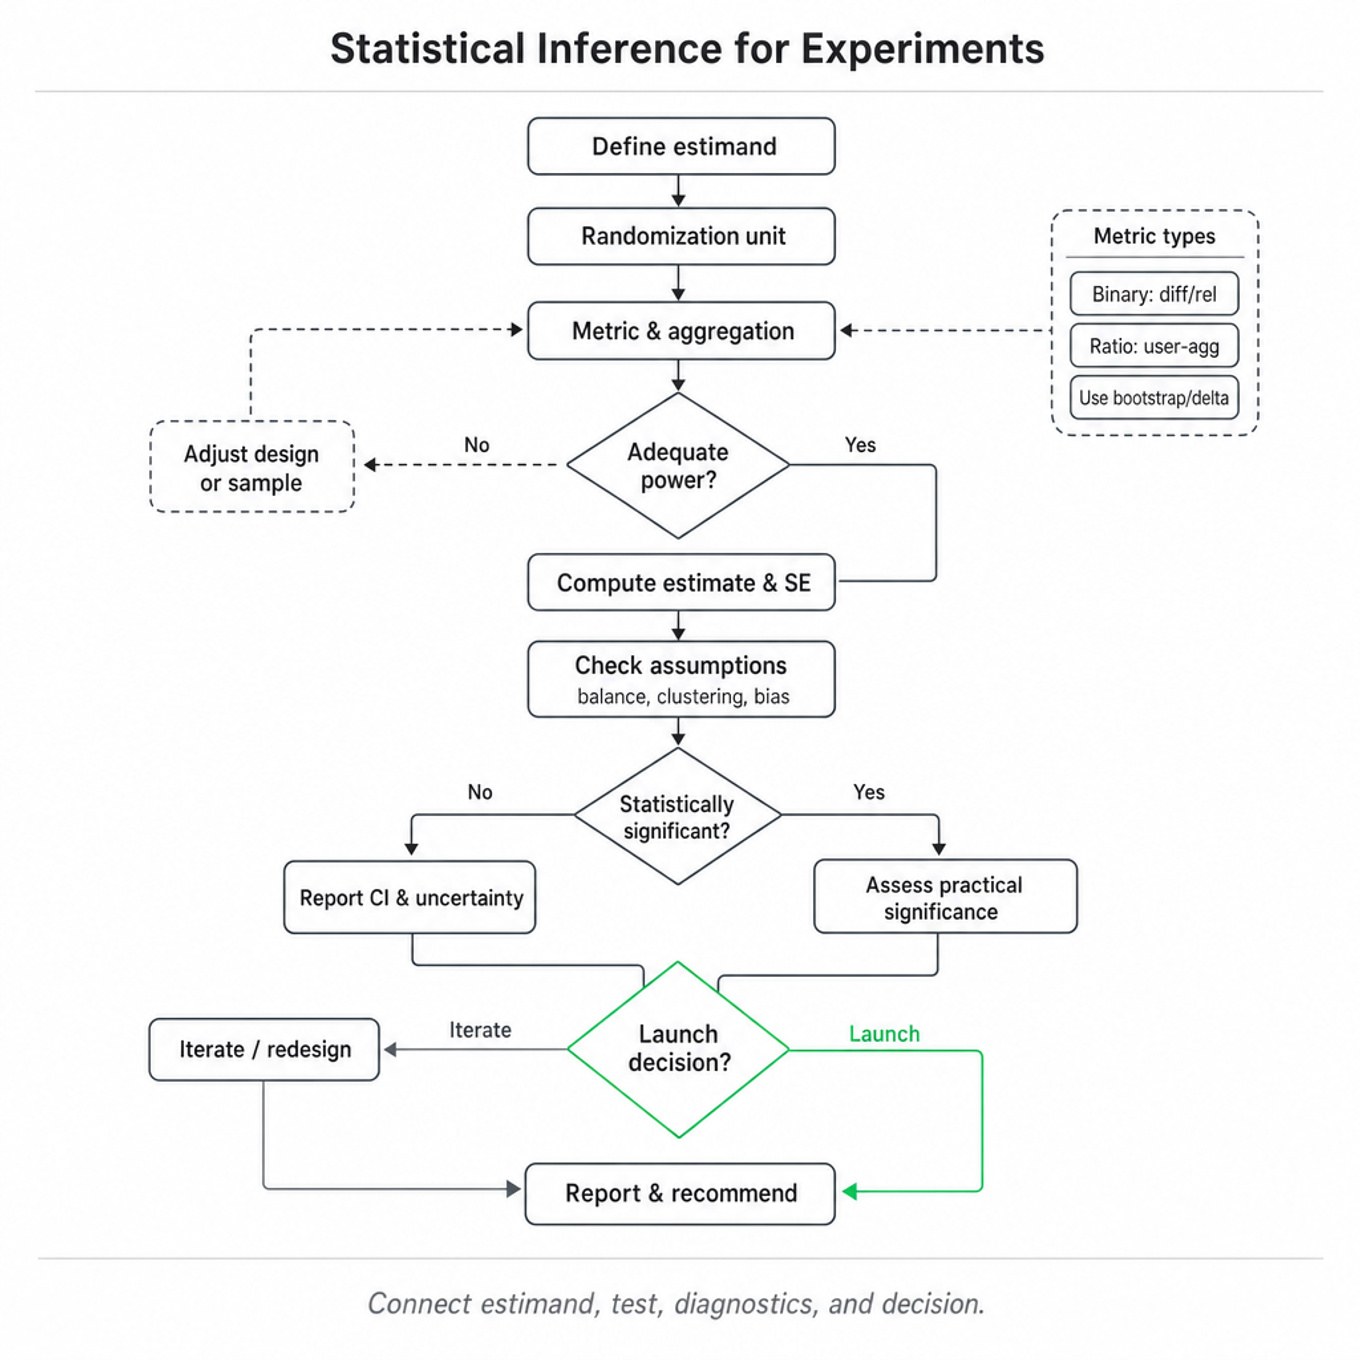
What's being tested
Interviewers are probing whether you can design and interpret experiments under real product constraints, not just recite p-values. For a Meta Data Scientist, this means knowing how to choose an estimand, define a statistically valid test, diagnose threats to validity, and translate uncertainty into a launch recommendation. The core skill is connecting inference mechanics—variance, power, confidence intervals, multiple testing, sequential monitoring—to product decisions involving users, feeds, ads, creators, or integrity systems. Strong answers show judgment: when a result is statistically significant but practically irrelevant, when randomization failed, when a metric is biased, and when more data will not fix a flawed design.
Core knowledge
-
Start with the estimand: “What causal effect are we trying to estimate?” Common choices are intent-to-treat, treatment-on-treated, average treatment effect, or heterogeneous effects by segment. In Meta-style experiments, intent-to-treat is often safest because assignment is randomized even if exposure or compliance varies.
-
The basic two-sample difference-in-means estimator is
with standard error
Use Welch’s t-test when variances differ; with very large samples, normal approximations usually dominate. -
For binary metrics such as click-through rate, conversion rate, or retention, use difference in proportions, relative lift, or logistic regression. Absolute lift is easier for business interpretation; relative lift can exaggerate tiny baselines. Always report uncertainty on the same scale as the decision.
-
Ratio metrics, such as likes per session or revenue per user, need care because the numerator and denominator are correlated. Prefer user-level aggregation, delta method, bootstrap, or linearization. Avoid treating numerator events as independent rows if randomization happened at the user level.
-
The unit of randomization should match the unit of analysis. If users are randomized, analyze at user level; if groups, advertisers, households, or pages are randomized, use cluster-robust standard errors. Ignoring clustering usually underestimates variance and creates false positives.
-
Power depends on minimum detectable effect, variance, sample size, traffic allocation, and significance threshold. A common approximation is
Smaller effects require quadratically more sample size; detecting half the effect needs roughly four times the traffic. -
CUPED and regression adjustment reduce variance using pre-treatment covariates. CUPED transforms the outcome as
It preserves unbiasedness if covariates are measured before treatment and can materially reduce experiment duration. -
Guardrail metrics matter as much as primary metrics. For a ranking change, primary metrics might be sessions, watch time, or meaningful interactions; guardrails might include hides, reports, unfollows, ad revenue, latency, creator distribution, or integrity prevalence.
-
Multiple testing inflates false positives. If testing many metrics, segments, or variants, use a hierarchy, Bonferroni/Holm for strict family-wise error control, or Benjamini-Hochberg for false discovery rate. Pre-specify primary metrics instead of cherry-picking the largest lift.
-
Peeking repeatedly at p-values breaks fixed-horizon inference. If the team wants continuous monitoring, use sequential methods such as alpha spending, group sequential tests, always-valid p-values, or Bayesian decision thresholds. Otherwise, commit to a stopping rule before launch.
-
Interference violates the stable unit treatment value assumption. Social products are vulnerable: treating one user can affect friends, group members, advertisers, or content creators. Consider cluster randomization, ego-network holdouts, geo experiments, or measuring spillovers explicitly.
-
Statistical significance is not the launch decision. A strong recommendation weighs effect size, confidence interval, metric tradeoffs, long-term risk, novelty effects, heterogeneous impacts, and opportunity cost. A 0.02% lift can matter at Meta scale, but only if it maps to durable value.
Worked example
For a representative prompt titled “Design an A/B test for a new Facebook Feed ranking change,” a strong candidate would first clarify the goal: are we optimizing engagement, meaningful social interactions, retention, revenue, integrity, or long-term user value? They would state assumptions: users can be randomized independently, the treatment is fully logged, and the change is not expected to create major network spillovers unless friends’ content distribution changes. The answer should be organized around four pillars: experiment design, metric selection, inference plan, and decision criteria. For design, they would propose user-level randomization via a stable hashing or experimentation platform, with a ramp from small holdout to larger traffic after logging and guardrail checks. For metrics, they would name one primary metric, such as daily active users or sessions per user, and several guardrails such as hides, reports, unfollows, latency, and ad revenue. For inference, they would use intent-to-treat analysis, user-level aggregation, confidence intervals, power calculations, and variance reduction using pre-period engagement if available. One explicit tradeoff is between short-term engagement and user well-being: watch time may rise while negative feedback also rises, so the decision cannot be based on a single engagement metric. They would close by saying that if they had more time, they would examine heterogeneous effects by country, new versus existing users, high versus low activity users, and run a longer-term holdout to detect novelty effects or retention impacts.
A second angle
For a different representative prompt, “An experiment shows no statistically significant lift; what do you conclude?”, the same inference toolkit applies but the framing shifts from design to interpretation. A strong answer would not say “there is no effect”; it would inspect the confidence interval and ask whether the experiment was powered to detect the minimum meaningful effect. If the interval excludes practically important gains and losses, the result supports no launch; if the interval is wide, the experiment is inconclusive. The candidate should also check instrumentation, sample ratio mismatch, contamination, triggered exposure, and whether the analysis used the right unit. The key difference is that the decision depends on uncertainty and business risk, not merely whether .
Common pitfalls
An analytical mistake is treating event-level observations as independent when assignment was at the user level. For example, analyzing each click or impression as a row can make the sample size look enormous and produce artificially tiny p-values. A better answer aggregates to the randomized unit or uses cluster-robust methods.
A communication mistake is leading with formulas before defining the product decision. Interviewers want to see that you can connect inference to launch criteria, guardrails, and user impact. Start with the estimand and decision, then explain the statistical machinery supporting it.
A depth mistake is assuming randomization solves everything. Randomization balances pre-treatment covariates in expectation, but it does not fix interference, logging bugs, noncompliance, novelty effects, missing data, or multiple comparisons. Strong candidates proactively name these threats and say how they would diagnose them.
Connections
Interviewers may pivot from experiment inference into causal inference, especially difference-in-differences, instrumental variables, regression discontinuity, or matching when randomization is impossible. They may also move toward metrics design, product sense, heterogeneous treatment effects, sequential testing, or experiment platform reliability.
Further reading
-
Trustworthy Online Controlled Experiments — Kohavi, Tang, and Xu’s practical reference for large-scale A/B testing systems and pitfalls.
-
Deng, Xu, Kohavi, and Walker, “Improving the Sensitivity of Online Controlled Experiments by Utilizing Pre-Experiment Data” — the canonical CUPED paper for variance reduction.
-
Johari, Pekelis, and Walsh, “Always Valid Inference: Continuous Monitoring of A/B Tests” — useful for understanding why naive peeking fails and how sequential inference can be made valid.
Related concepts
- Statistical Inference, Hypothesis Tests, And Power
- Statistical Inference For Proportions And Confidence IntervalsStatistics & Math
- Statistical Inference, Hypothesis Testing, And Power
- Causal Inference And Quasi-Experiments
- Experiment Diagnostics, Power And Robust InferenceStatistics & Math
- Power Analysis And Statistical InferenceStatistics & Math