Experiment Diagnostics, Power And Robust Inference
Asked of: Data Scientist
Last updated
What's being tested
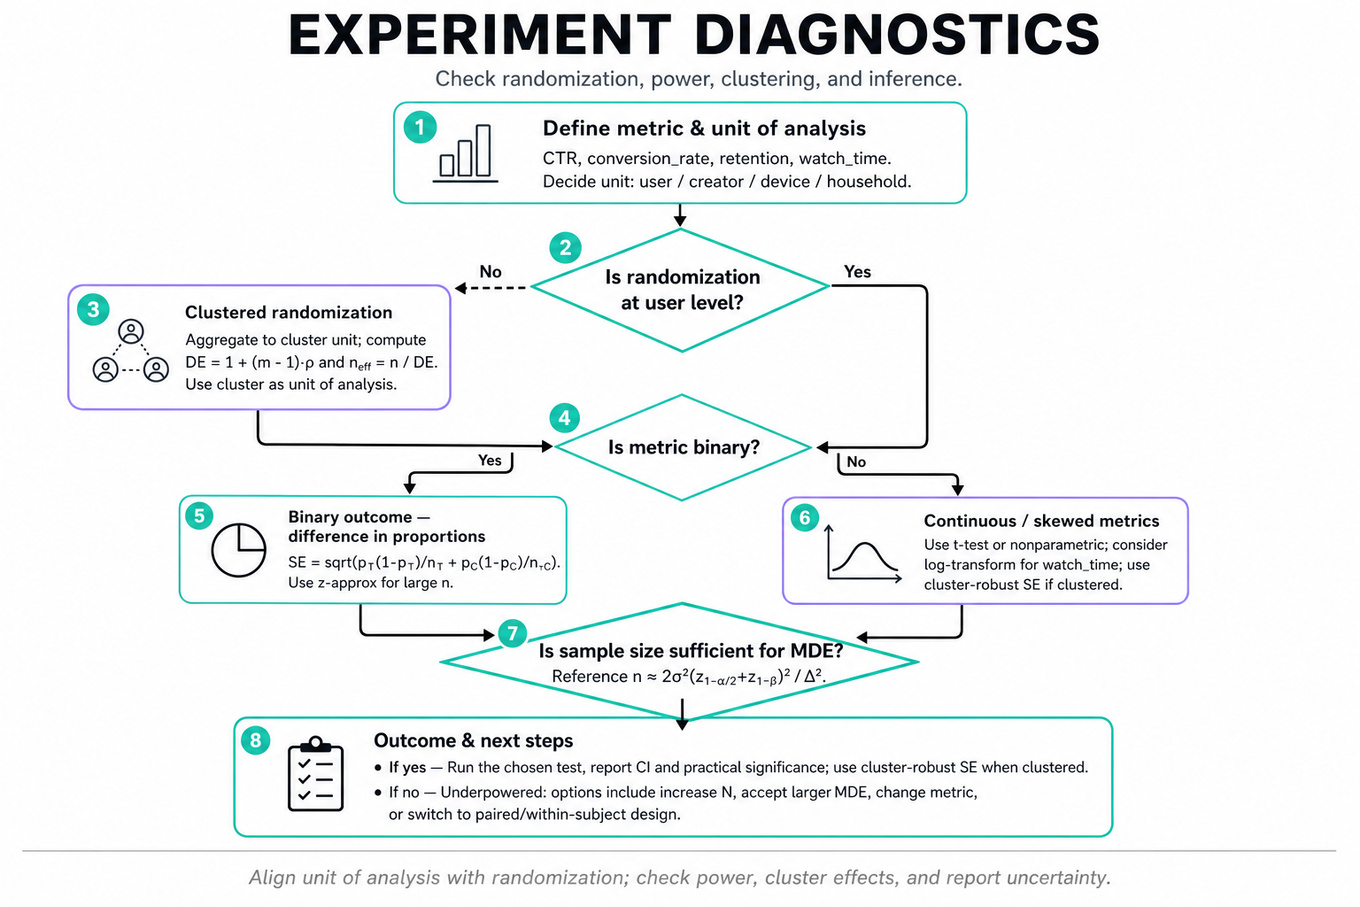
Interviewers are probing whether you can treat experiment results as statistical evidence, not just dashboard deltas. For a TikTok Data Scientist, this means diagnosing whether an observed change in CTR, conversion_rate, retention, watch_time, or posting behavior is causal, sufficiently powered, correctly randomized, and robust to known failure modes. You are expected to know when a simple two-sample test is valid, when clustered users or repeated looks break assumptions, and how to communicate uncertainty to product and engineering partners. The strongest answers combine inference, metric intuition, and practical experiment diagnostics.
Core knowledge
-
Difference-in-proportions testing is the default for binary outcomes such as conversion, activation, or retention. For treatment rate and control rate , use
and test under large-sample normal approximation. -
One-sample proportion tests compare an observed rate against a benchmark , such as testing whether campaign conversion exceeds 60%. Use for the null test, while confidence intervals often use or Wilson intervals for better coverage.
-
Power analysis asks whether the experiment could detect a practically meaningful effect. For a two-arm test, approximate required sample size per group scales as
so halving the minimum detectable effect requires roughly 4x more sample. -
Clustered randomization matters when assignment happens at creator, region, school, household, device group, or market level instead of user level. Observations inside a cluster are correlated, reducing independent information. Design effect is commonly approximated as , where is average cluster size and is intra-cluster correlation.
-
Effective sample size under clustering is roughly . If 1M events come from highly correlated clusters, the inferential sample size may be closer to thousands of clusters than millions of rows. The unit of analysis should align with the unit of randomization.
-
Cluster-robust standard errors estimate uncertainty while allowing arbitrary correlation within clusters. In practice, you can aggregate to cluster-level outcomes or use sandwich estimators, but you need enough clusters; with fewer than roughly 30–50 clusters, use caution, small-sample corrections, or randomization inference.
-
Sequential testing handles repeated peeking at experiment results. If you check daily and stop when , the false positive rate exceeds 5%. Use alpha-spending rules such as O’Brien-Fleming for conservative early looks or Pocock for more even thresholds across interim analyses.
-
Sample ratio mismatch is a core randomization diagnostic. If the planned allocation is 50/50 but observed traffic is 53/47, test counts with a chi-square goodness-of-fit test before interpreting effects. SRM can indicate eligibility bugs, logging gaps, treatment leakage, or platform-specific exposure differences.
-
Right-censoring appears in cohort behavior when some users have had less time to produce an outcome, such as 7-day posting after signup. Avoid comparing incomplete windows directly. Use fixed mature cohorts, survival analysis, or clearly defined observation windows such as
posts_within_7d. -
Heavy-tailed metrics like
watch_time,revenue_per_user, comments, shares, or posts per creator often violate normal assumptions at the user level. Robust choices include winsorization, log transforms, bootstrap confidence intervals, quantile metrics, or pre-registered capped means. -
Metric denominator discipline prevents misleading effects.
conversion_ratecan mean conversions per impression, per exposed user, per eligible user, or per session. Always identify numerator, denominator, eligibility, attribution window, and whether repeated exposures are counted. -
Heterogeneity and segmentation are diagnostic tools, not fishing licenses. Segment by pre-specified dimensions such as country, app version, traffic source, device, creator size, or new versus existing users. Use interaction tests or hierarchical thinking instead of declaring wins from noisy subgroup deltas.
Worked example
For “Diagnose Traffic Allocation in A/B Test Results”, a strong candidate would start by clarifying the intended randomization unit, planned split, exposure definition, eligibility rules, ramp schedule, and whether the metric is based on assigned users or actually exposed users. In the first 30 seconds, say: “Before estimating treatment impact, I’d verify randomization integrity and data consistency, because allocation bias can invalidate causal interpretation.”
The answer can be organized into four pillars: first, check sample ratio mismatch by comparing observed assignment counts to expected allocation using a chi-square test; second, inspect whether mismatch is concentrated by country, device_os, app_version, traffic source, or experiment ramp date; third, compare pre-treatment covariates and historical metrics across arms to detect imbalance; fourth, evaluate whether exposure, logging, or eligibility definitions create post-randomization filtering.
A good candidate would distinguish between assignment-based analysis and exposure-based analysis. Assignment-based intent-to-treat preserves randomization but may dilute effects if many assigned users were never exposed. Exposure-based analysis can answer a product adoption question but may be biased if exposure itself is affected by treatment or user behavior.
One explicit tradeoff to flag: pausing analysis to debug SRM protects causal validity, but if the experiment is on a critical launch path, you may provide clearly labeled descriptive readouts while withholding causal claims. The close should be pragmatic: “If I had more time, I’d audit pre-period balance, run the same diagnostics on guardrail metrics like crash_rate and session_starts, and compare results across mature cohorts before recommending launch or rollback.”
A second angle
For “Compute cluster-aware significance and sequential corrections”, the same diagnostic mindset applies, but the main threat is not just bad allocation; it is invalid uncertainty. If the experiment randomizes by market or creator cluster but the analyst tests millions of user rows as independent, the -value will be artificially small. A strong answer identifies the randomization unit, estimates or reasons about the intra-cluster correlation, applies a design effect or cluster-robust standard error, and then adjusts thresholds for interim looks using an alpha-spending rule. The framing shifts from “is the treatment assignment trustworthy?” to “is the evidence calibrated after dependency and repeated monitoring?”
Common pitfalls
Pitfall: Treating row count as sample size when rows are correlated.
A tempting answer is: “We have 10 million events, so the test is highly powered.” That can be wrong if the experiment was randomized by 200 regions or creators, or if each user contributes many events. A better answer anchors inference to the randomization unit and discusses cluster-robust or user-level aggregation.
Pitfall: Reporting a significant lift before checking diagnostics.
Saying “treatment increased conversion_rate by 2%, , ship it” is incomplete. Interviewers expect you to check SRM, pre-period balance, logging consistency, novelty effects, metric denominators, and guardrails before making a causal recommendation. The analytical maturity is in knowing when not to trust a clean-looking result.
Pitfall: Overcomplicating the answer without product interpretation.
A purely mathematical answer full of formulas but no decision framing can miss the Data Scientist role. For TikTok-style experiments, connect the inference back to launch decisions: expected user impact, risk to retention or watch_time, robustness across major segments, and whether the observed effect is practically meaningful, not merely statistically significant.
Connections
Interviewers may pivot from here into causal inference, especially intent-to-treat versus treatment-on-the-treated, CUPED variance reduction, difference-in-differences, or interference/network effects. They may also ask about metric design, cohort retention analysis, anomaly diagnosis after a release, or robust evaluation of recommender and ranking changes.
Further reading
-
Trustworthy Online Controlled Experiments by Kohavi, Tang, and Xu — practical experimentation reference covering SRM, ramping, metrics, and common online testing traps.
-
Group Sequential Methods with Applications to Clinical Trials by Jennison and Turnbull — rigorous treatment of sequential monitoring, alpha spending, and stopping boundaries such as O’Brien-Fleming.
-
Mostly Harmless Econometrics by Angrist and Pischke — strong grounding for causal inference, clustered standard errors, and regression-based empirical reasoning.
Featured in interview prep guides
Practice questions
- Implement streaming SRM detector with late eventsTikTok · Data Scientist · HR Screen · medium
- Compute cluster-aware significance and sequential correctionsTikTok · Data Scientist · HR Screen · medium
- Diagnose a sudden metric spike or dropTikTok · Data Scientist · Technical Screen · hard
- Act when A/B result is not significantTikTok · Data Scientist · Onsite · hard
- Diagnose metric drop in Ads ManagerTikTok · Data Scientist · Onsite · hard
- Design robust A/B test with interference and seasonalityTikTok · Data Scientist · Technical Screen · hard
- Troubleshoot Sudden KPI Drop After Recent Product ReleaseTikTok · Data Scientist · Technical Screen · medium
- Diagnose Traffic Allocation in A/B Test ResultsTikTok · Data Scientist · Technical Screen · medium
- Evaluate Cohort Posting Patterns Using Metrics and TestsTikTok · Data Scientist · Technical Screen · medium
- Test Billboard Campaign Conversion Rate Exceeds 60%TikTok · Data Scientist · Onsite · easy
Related concepts
- Hypothesis Testing, Power, And Confidence Intervals
- Statistical Inference, Power, And Metric UncertaintyStatistics & Math
- Statistical Inference, Power, And Confidence IntervalsStatistics & Math
- Central Limit Theorem, Confidence Intervals, And PowerStatistics & Math
- Power Analysis And Statistical InferenceStatistics & Math
- A/B Testing, Power, And Experiment DesignAnalytics & Experimentation