Amazon Business Analyst Interview: SQL, Operational Metrics, and Recommendations
Quick Overview
Prepare for an operations-focused Amazon Business Analyst interview with an executed SQL case and decision memo. Validate shipment deadlines, eligible-order denominators, duplicate events, late reporting, and lane-mix effects before recommending action. Separates official Barcelona ACES role evidence, a limited candidate account, and original practice.
An Amazon Business Analyst interview can require more than a correct SQL result. For an operations-focused role, you need to explain what the metric measures, whether the data is trustworthy, why the number changed, and which action the evidence supports.
This guide develops that chain through an original late-shipment case. Start with Amazon interview practice on PracHub, then use the exercise below to rehearse a concise analysis and recommendation. The case is synthetic, and its SQL was executed in DuckDB 1.5.2; it is not an Amazon dataset or a recalled interview question.

What is officially supported about the role?
Official role evidence: Amazon's Barcelona ACES Data Analytics Team posting, job 10511821, explicitly describes a Business Analyst. Its responsibilities include SQL analysis, Python automation, dashboarding, operational root-cause analysis, data accuracy, and communication with stakeholders. Excel and business judgment also feature in the description.
That supports preparing the full path from raw operational data to a decision. It does not establish a global BA interview syllabus. A role in another team, location, or level may emphasize different tools and business problems.
Official interview guidance: Amazon describes its interview loop as individual conversations assessing different aspects of a candidate's experience. Its Leadership Principles preparation advice recommends authentic examples, clear personal contributions, and structured STAR answers.
Candidate report, limited scope: in a Reddit thread begun in May 2025, an India-based BA applicant later reported live SQL and Leadership Principles interviews. Replies mix different roles and assessment descriptions. That historical account is not a reliable specification for a current Barcelona ACES loop.
We did not establish two independent same-cycle reports for that exact team. Accordingly, this article focuses on operations preparation and avoids fixed round counts, durations, or OA promises. Confirm the SQL dialect, permitted tools, and format from your own invitation. A BIE online assessment is a different role-specific preparation topic.
Practice case: the late-shipment metric increased
An operations manager says: “Our shipment deadline-miss rate rose from 12% to 20%. Should we add capacity to every lane?”
Treat this as an original interview prompt. You have an orders table and a shipment-events table. Two weekly cohorts each contain 100 eligible orders. Lane is a stable classification with two values, Standard and Complex; it is not a claim about Amazon's actual network terminology.
The raw fixture has 204 orders and 402 event rows. Four orders are ineligible: two were cancelled before their shipment deadlines and two are not yet due. The event table includes packed and shipped events, three identical retransmitted event rows, two on-time shipments reported late, and one overdue order with no shipment evidence.
The manager's 20% came from a September 4 report cutoff. A September 8 refresh includes the two delayed reports and changes the current cohort's rate to 18%. The operations question remains, but its starting number needs correction.
Your first response should be to confirm the metric and reporting cutoff. Adding capacity based on an unverified dashboard could address the wrong cause.
Define the denominator before joining tables
For this exercise, the unit is one order with one shipment requirement. The denominator contains orders whose promised shipment deadline has passed by the report cutoff, excluding cancellations at or before that deadline. Orders cancelled afterward remain eligible under this stated rule.
The numerator contains eligible orders whose first shipped event is after the promise, plus overdue orders with no available shipment evidence. We call this an evidence-based deadline-miss rate. Missing evidence may indicate an unshipped order or a reporting failure; it does not prove which one occurred physically.
“Shipped” and “delivered” are different milestones. A late carrier delivery does not automatically imply a missed shipment deadline. Likewise, if one order can have multiple required packages, first shipment may be insufficient; redefine the grain and completion rule before reusing this query.
The two clocks matter. event_at records when shipment happened, while ingested_at records when the analytics system learned about it. A September 4 report must not use evidence first received on September 5. A later refreshed report may legitimately revise the same cohort.
Keep the original promise stable for this calculation. If promises can be edited retrospectively, request the original commitment or its version history. Replacing an original deadline with a later promise could make performance appear better without moving any shipment earlier.
Reduce events to one row per order
The executed query first selects evidence available at the cutoff, deduplicates event IDs, filters to shipped events, and calculates the earliest shipment per order. It then left-joins that result to eligible orders:
with visible_events as (
  select *, row_number() over (
    partition by event_id order by ingested_at desc
  ) as rn
  from shipment_events
  where ingested_at <= $cutoff
), first_shipment as (
  select order_id, min(event_at) as first_shipped_at
  from visible_events
  where rn = 1 and event_type = 'shipped'
  group by order_id
), order_level as (
  select o.order_id, o.cohort, o.lane,
    case when s.first_shipped_at is null
           or s.first_shipped_at > o.promised_ship_at
         then 1 else 0 end as missed,
    case when s.first_shipped_at is null then 1 else 0 end as no_ship_evidence
  from orders o
  left join first_shipment s using (order_id)
  where o.promised_ship_at < $cutoff
    and (o.cancelled_at is null or o.cancelled_at > o.promised_ship_at)
)
select cohort, lane, count(*) as eligible,
       sum(missed) as missed,
       sum(no_ship_evidence) as no_ship_evidence,
       round(100.0 * sum(missed) / count(*), 2) as miss_pct
from order_level
group by cohort, lane
order by cohort, lane;
$cutoff is a bound DuckDB timestamp parameter. We ran it with September 4 and September 8, 2026 at 00:00 UTC. Adapt parameter syntax and timestamp handling to the dialect in your interview. DuckDB documents window functions and prepared-statement parameters.
Our retransmitted rows are identical, so ties do not change their business values. If duplicate event IDs contain conflicting corrections, an ingestion timestamp alone may be an inadequate tie-breaker. Define a revision or precedence rule and flag unresolved conflicts instead of selecting an arbitrary record.
The left join preserves overdue orders with no shipment. An inner join would remove precisely the orders that may need investigation. Joining all raw events directly to orders would also change the row grain: packed events and retransmissions would become extra observations. Explain those failure modes before discussing query optimization.
Separate reporting delay from operational delay
At the initial cutoff, the Standard lane's current-cohort result was six misses out of 50 orders, or 12%. Two of those orders had actually shipped before their deadlines, but the evidence arrived on September 5. The refreshed result is four out of 50, or 8%.
The Complex lane remains at 14 out of 50, or 28%. One of those 14 still has no shipped event. The refreshed overall rate is therefore (4 + 14) / 100 = 18%, while the prior cohort remains 12%.
The reporting delay explains two percentage points of the original eight-point increase. It does not explain the entire movement. Keep the unresolved missing-evidence order visible as its own diagnostic count.
For a production report, compare cohorts at a consistent maturity lag and retain the as-of timestamp. Otherwise, a recent cohort with incomplete event ingestion is being compared with an older cohort whose evidence has had more time to arrive. The appropriate lag depends on observed ingestion behavior, not a universal waiting period.
Why did the total worsen while both lanes improved?
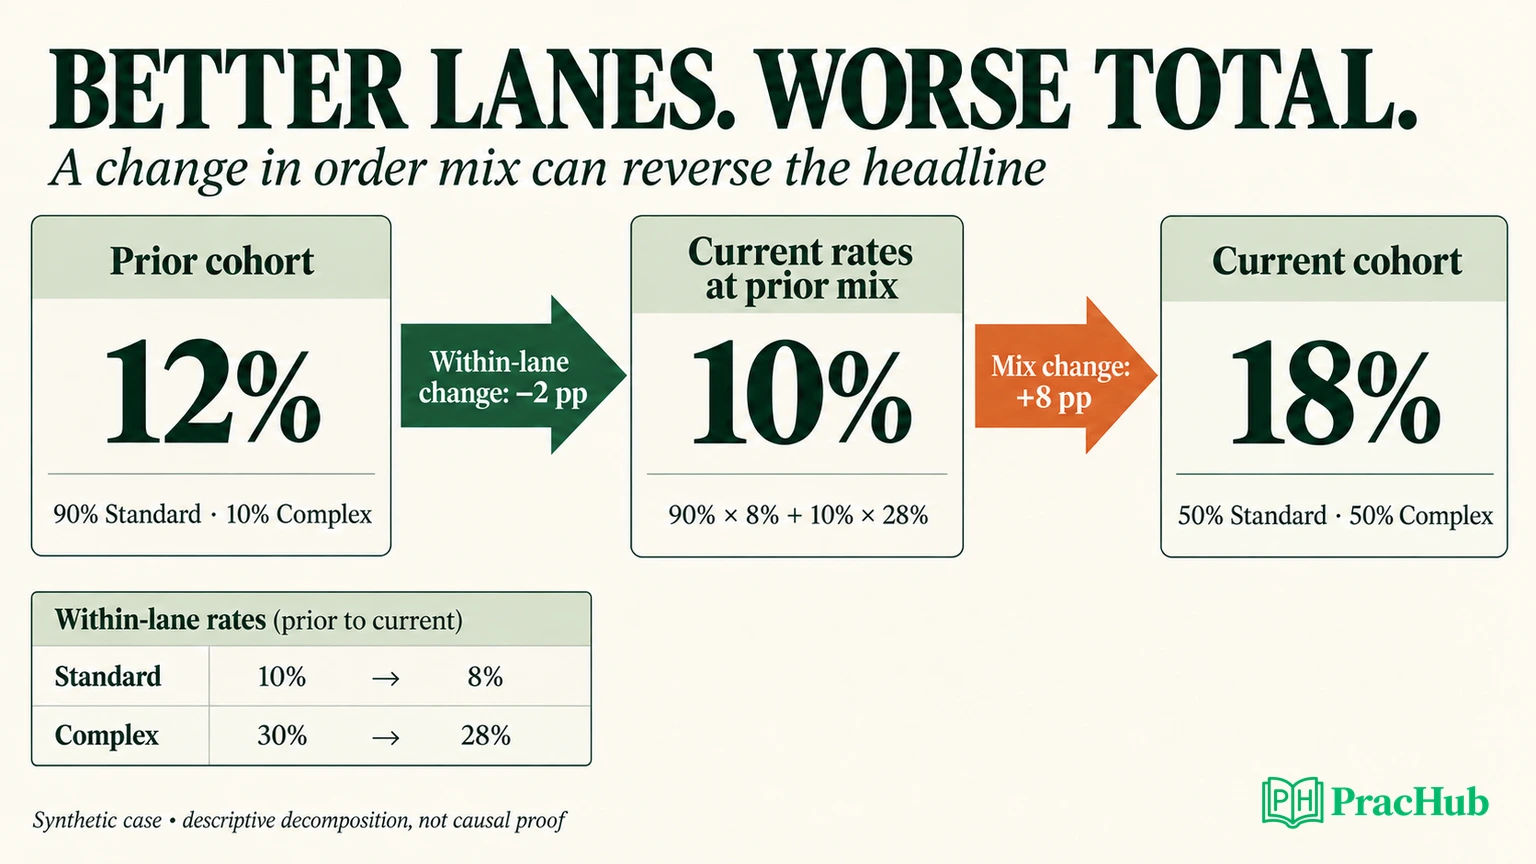
The refreshed, executed results show misses divided by eligible orders:
| Lane | Prior | Current |
|---|---|---|
| Standard | 9 / 90 = 10% | 4 / 50 = 8% |
| Complex | 3 / 10 = 30% | 14 / 50 = 28% |
| Overall | 12 / 100 = 12% | 18 / 100 = 18% |
The current cohort contains far more Complex-lane orders: 50% rather than 10%. That lane has a higher observed miss rate in both periods. Its increased weight raises the combined rate even though each lane's rate decreased.
Hold the prior mix constant and apply current lane rates:
0.90 × 8% + 0.10 × 28% = 10%.
Under that descriptive comparison, within-lane movement takes the rate from 12% to 10%, a two-point improvement. Changing the weights from the prior mix to the current mix then takes it from 10% to 18%, an eight-point increase. Together, −2 + 8 equals the observed six-point increase.
This decomposition is arithmetic, not proof of causality. It does not show why the mix changed or establish that an intervention improved either lane. The sample is small, and differences within each lane could still reflect weather, product complexity, promise tightness, or other composition changes.
The evidence does reject the simple claim that every lane's measured performance deteriorated. It supports investigating Complex-lane demand and capacity before applying a blanket staffing change.
Turn the result into a decision memo
The following is an original suggested response, not an observed Amazon decision:
Recommendation: Reconcile missing shipment evidence and investigate the increased Complex-lane workload before adding capacity across all lanes.
Evidence: The current rate revises from 20% to 18% after two late-arriving on-time shipment events. Compared with the prior 12%, both lane rates are two points lower, but Complex-lane share rises from 10% to 50%. At the old mix, current performance would be 10%.
Uncertainty: One overdue order still lacks shipment evidence. Lane mix is descriptive, and these small cohorts do not establish causality or staffing requirements.
Next action: Ask the data owner to reconcile the missing event and quantify reporting lag. Ask operations to break Complex-lane misses down by site, shift, promise window, and process stage. Estimate any targeted capacity change using workload and cost data, then evaluate it against a comparable baseline.
Verification: Track the same mature-cohort deadline-miss rate, unresolved evidence count, backlog age, and cost per eligible order. Check that an apparent improvement does not come from later promises or shifted cancellations.
If asked for a financial estimate, explain what is missing: incremental labor cost, throughput constraints, customer impact, and the expected reduction in misses. Do not invent a savings figure from the 18% rate alone.
Connect the analysis to your own interview examples
Use the case to practice explaining your work, then prepare real experiences that show similar judgment. A useful story might involve correcting a metric definition, finding a data-quality problem, or disagreeing with an initial recommendation after examining the evidence.
Describe what you personally investigated, what changed because of it, and how the result was verified. Separate a measured outcome from an estimate. If an intervention was not evaluated causally, say so. Amazon's official guidance favors authentic experience; borrowing the synthetic case as a personal accomplishment would defeat that purpose.
Prepare for follow-ups: why this denominator, why this join, why these segments, what alternative explanation remains, and what you would do if the manager needs a decision today. A conditional recommendation can be useful while clearly identifying the evidence still needed.
Practice related questions on PracHub
The questions below span Amazon and adjacent analytics roles. Their company labels belong to the linked practice records; they do not imply that every prompt is an Amazon BA question.
| PracHub question | Practice focus |
|---|---|
| Measure Late Deliveries and Identify Top Delayed Restaurants | Compare actual versus estimated delivery time without confusing it with shipment deadlines. |
| Identify Key Metrics to Address Delivery Delays | Connect diagnostics to an intervention and validation plan. |
| Delivery Driver Performance Evaluation Framework | Compare operations fairly when work difficulty differs. |
| Demonstrate Amazon LP with deep follow-ups | Defend your actual contribution, evidence, and trade-offs. |
| Deliver Under a Tight Deadline Without Hiding Risk | Make a bounded recommendation while surfacing uncertainty. |
Continue with Amazon interview questions. Rehearse one SQL explanation and one decision summary from the same evidence so the technical and business parts of your answer remain consistent.
Comments (0)