Browser Rendering Interview Questions: Critical Path, Layout, Paint, and Compositing
Quick Overview
A practical browser rendering interview guide covering the critical path, layout, paint, rasterization, compositing, and DevTools.
A dropdown opens smoothly on your laptop but stutters on a mid-range phone. The JavaScript handler takes only two milliseconds, so the code review concludes that the interaction is fast. Chrome's trace tells a different story: the handler changes geometry, a later read forces layout, and the browser spends the rest of the frame recalculating positions and painting pixels.
That is the gap browser rendering interview questions are designed to expose. Interviewers are not looking for a memorized list of stages. They want to know whether you can map a visible symptom to the first expensive rendering phase, gather evidence, and choose a fix that preserves correctness.
Start with PracHub's Frontend Engineer interview questions for realistic debugging and implementation prompts. This guide then gives you the browser model needed to explain the critical rendering path, layout, paint, rasterization, and compositing without turning every performance problem into "use the GPU."

Quick answer: name the first expensive phase
A strong browser rendering answer begins with the update that occurred, not with an optimization. Ask what changed, which rendering stages that change can invalidate, how much of the page is affected, and what the Performance panel shows. Then reduce or isolate the measured work and record the same interaction again.
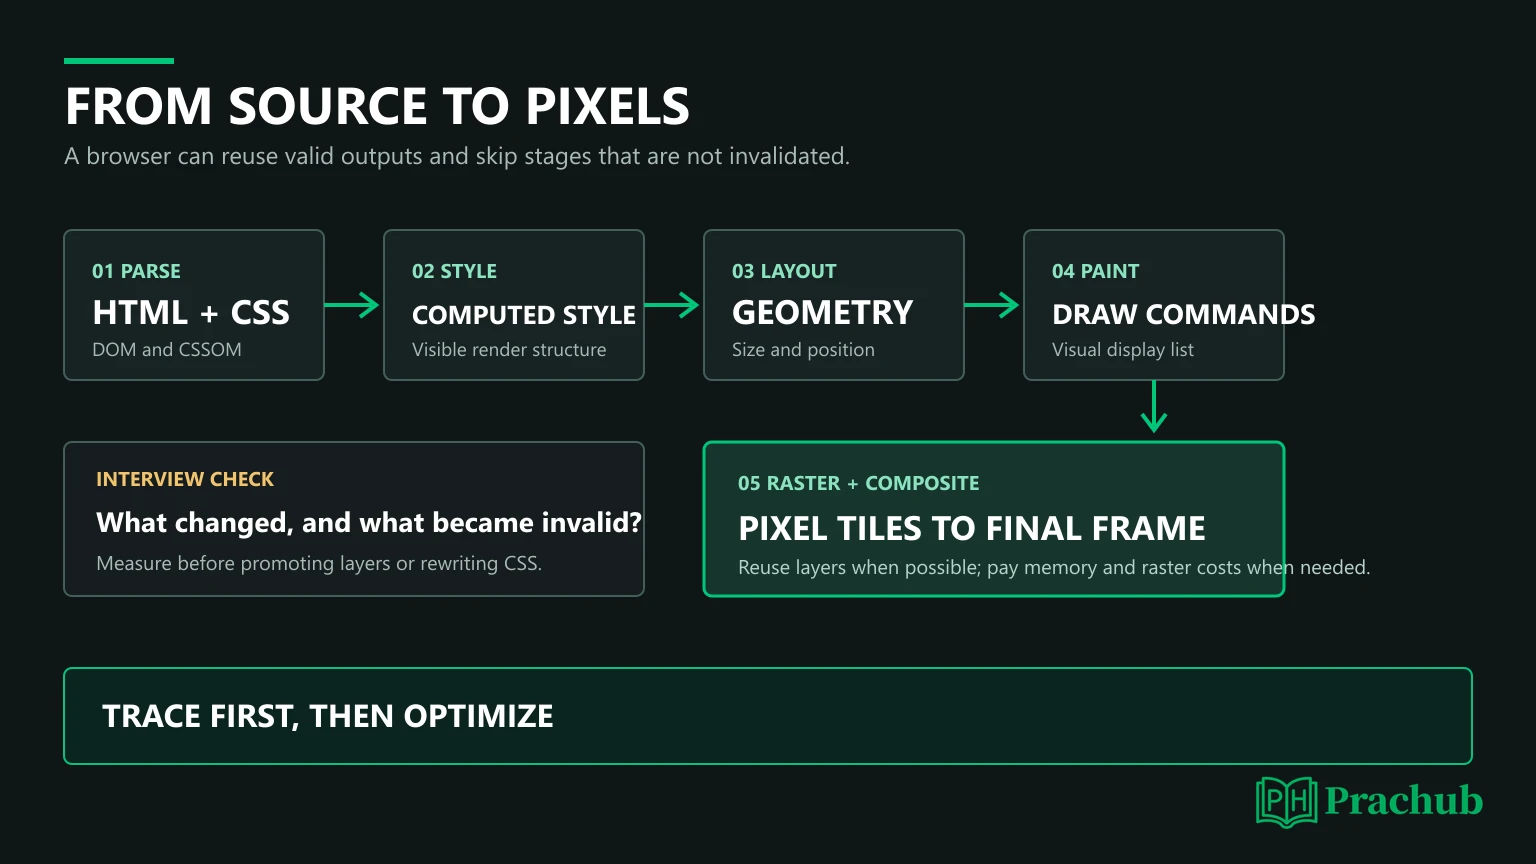
The simplified pipeline is JavaScript, style, layout, paint, raster, and composite. It is a dependency graph, not a rule that every frame must execute every stage. Chromium's RenderingNG documentation explicitly describes stages that can be skipped when their outputs remain valid. A compositor-friendly animation may reuse previously rasterized content, while changing an element's width can require style, layout, paint, and compositing work.
| Phase | Primary output | Evidence to inspect |
|---|---|---|
| Parse and style | DOM, CSSOM, computed styles, render tree | Resource blocking, Recalculate Style, invalidated nodes |
| Layout | Element geometry and positions | Layout events, affected nodes, forced reflow warnings |
| Paint and raster | Drawing commands and pixel tiles | Paint events, paint flashing, raster work, damaged regions |
| Composite and draw | Final frame assembled from layers and tiles | Layer information, compositor activity, dropped frames |
The critical rendering path from source to pixels
The critical rendering path is the sequence that converts HTML, CSS, and JavaScript into pixels. As HTML is parsed, the browser builds the DOM. CSS becomes the CSSOM. The browser combines content and computed styles into a structure representing what needs to render, calculates geometry, records how the result should be painted, rasterizes those instructions into pixels, and assembles the visible frame.
CSS can block rendering because later rules may change earlier results. JavaScript can also delay progress when it blocks parsing or queries style information that depends on CSS. Avoid claiming that "the browser waits for every stylesheet before doing anything." State which resource blocks which output and verify it in a waterfall or trace.
The render tree is also not a copy of the DOM. Nodes such as display: none content do not participate in layout, while visibility: hidden elements still reserve geometry. That distinction is a useful interview follow-up because it shows that visibility, layout participation, and paint output are separate concerns.
Four rendering stages interviewers expect you to distinguish
Style calculation decides the computed result
Style calculation matches CSS rules to relevant elements and resolves the cascade, inheritance, and computed values. A DOM mutation or class change may invalidate style for one subtree or a wider set of nodes. The cost depends more on the amount of affected work than on a slogan such as "complex selectors are always slow." MDN notes that selector micro-optimization is often less valuable than measuring larger rendering costs.
Describe the mutation and its scope. Adding a class to a contained component is different from changing root state across a large document. Inspect Recalculate Style duration and affected elements before rewriting CSS.
Layout calculates geometry
Layout determines sizes and positions from styles, content, parent constraints, intrinsic dimensions, fonts, and the viewport. Firefox often calls the same broad process reflow. Changes to geometry-related properties such as width, height, top, or font metrics can invalidate layout, and one element's size may influence many descendants or siblings.
A classic trap is forced synchronous layout. JavaScript writes a style and then reads geometry such as offsetHeight or getBoundingClientRect(). To return a current value, the browser must resolve pending style and layout work immediately. Repeating that read-write pattern in a loop creates layout thrashing.
// Problem: every iteration can force fresh layout.
for (const row of rows) {
  row.style.width = `${panel.offsetWidth}px`;
}

// Better: read once, then batch writes.
const width = panel.offsetWidth;
for (const row of rows) {
  row.style.width = `${width}px`;
}
Paint records visual instructions, then raster creates pixels
Paint determines the visual drawing order and records instructions for text, backgrounds, borders, shadows, and other effects. Rasterization turns those records into pixel tiles that can be displayed. This distinction matters because a page can avoid layout yet still repaint an expensive region, and a repainted region still needs raster work.
Do not answer "repaint means the entire page is redrawn." Modern engines track invalidation and damaged regions, although the scope depends on the content and implementation. Use paint flashing, trace events, and layer information to see what actually changed. Large shadows, filters, oversized images, and frequently invalidated surfaces can make paint or raster expensive even when JavaScript is small.
Compositing assembles the final frame
Compositing positions and combines rasterized tiles or layers into the frame sent to the display. In favorable cases, changing transform or opacity can skip layout and paint and update only compositing data. That is why those properties are commonly recommended for high-pressure animations.
But "GPU-accelerated" is not a free-performance switch. Separate layers consume memory, may require additional rasterization, and can increase transfer and management costs. The browser decides how to layer content, and behavior varies across engines and devices. Use will-change only for a measured, imminent change, not as a blanket rule on every animated element.
Worked interview scenario: a janky expanding panel
Suppose an accordion animates its height while a scroll listener reads several element rectangles. Users report dropped frames. Begin by clarifying the device, content size, trigger, and desired visual behavior. Record the interaction under representative CPU conditions and inspect whether time is dominated by scripting, style, layout, paint, or compositing.
If the trace shows repeated forced layout, find the code path that mixes geometry reads with style writes. Batch reads before writes, remove duplicate measurements, and schedule visual updates with requestAnimationFrame() when they should align with the next repaint. If the panel contains a large subtree, consider whether layout containment can limit propagation, but explain the sizing and accessibility consequences.
If layout is still expensive because animating height changes surrounding geometry, decide whether the design truly requires that effect. A transform can animate a visual surface more cheaply, but it may overlay rather than move neighboring content. That semantic difference is the trade-off. Re-record the same interaction, compare frame timing and rendering events, and test reduced motion, focus order, and final geometry.
How to investigate rendering in Chrome DevTools
Open the Performance panel, record a short representative interaction, and keep screenshots when visual timing matters. Start with the frame or interaction that looks wrong. The Main track shows scripting, Recalculate Style, Layout, and Paint work; the Summary, Bottom-Up, and Call Tree views help connect expensive events to code.
Look for repeated purple style or layout blocks, forced-reflow indicators, large green paint events, long raster activity, and frames that miss the device's refresh budget. Inspect the affected node count and call stack rather than assuming the largest-looking block is the root cause. DevTools also provides rendering overlays such as paint flashing and layout-shift regions, while layer views can help test a compositing hypothesis.
Change one variable at a time and capture before-and-after traces with the same device profile, content, and action. A trace tests local causality; production monitoring shows whether affected users improved.
Common browser rendering interview questions
What is the difference between reflow and repaint?
Reflow is another name for recalculating layout geometry. Repaint updates visual drawing output. A geometry change can lead to both layout and paint, while a color change may require paint without layout. A transform or opacity update may sometimes be handled during compositing. Say "may" because the exact path depends on browser decisions and page state.
Why can transform be faster than top or left?
top and left change positioned geometry and commonly require layout. A transform changes how an already laid-out surface is presented and can often skip layout and paint. The correct choice still depends on semantics: use layout properties when document geometry must change, and transforms when visual movement without reflow is appropriate.
What does requestAnimationFrame actually guarantee?
requestAnimationFrame() asks the browser to run a callback before the next repaint. It aligns visual updates with the display cycle and is paused in many background-tab situations. It does not guarantee 60 frames per second, make heavy work cheap, or automatically prevent layout thrashing inside the callback.
How do CSS containment and content-visibility help?
Containment lets the browser treat a subtree as more independent for style, layout, paint, or size calculations. content-visibility can let off-screen content skip rendering work. Both can reduce scope, but they change layout assumptions and may affect intrinsic sizing, find-in-page behavior, focus, or accessibility if applied carelessly. Explain the boundary you need and test it.
Practice browser rendering questions on PracHub
For each prompt, narrate the visible symptom, the rendering phase you suspect, the evidence that would disprove your hypothesis, the smallest fix, and the verification plan.
| PracHub question | Practice focus | Why it helps |
|---|---|---|
| Diagnose Cold-Load and Massive-Table Performance in a Web App | Critical path, DOM scale, layout, paint | Forces you to separate loading, rendering, memory, and data-ownership costs. |
| Debug and optimize React performance issues | Rendering symptoms, layout thrashing, profiling | Connects framework updates to browser-level evidence and visual correctness. |
| Implement a JavaScript frame player controller | Frame timing and scheduling | Tests timing, drift, cleanup, and the difference between scheduling and rendering cost. |
| Implement, Debug, and Optimize a React Table | Large DOMs, virtualization, repeated layout | Adds a realistic UI where avoiding unnecessary rendered work matters more than micro-tuning. |
A seven-day browser rendering interview plan
| Schedule | Focus | Practice output |
|---|---|---|
| Day 1 | Critical rendering path | Draw HTML and CSS through DOM, CSSOM, render tree, layout, and pixels. |
| Day 2 | Style and layout | Explain invalidation, reflow, and one forced synchronous layout example. |
| Day 3 | Paint and raster | Use paint flashing and identify the repainted region in a small demo. |
| Day 4 | Layers and compositing | Compare height, top, transform, and opacity with explicit trade-offs. |
| Day 5 | DevTools | Record one interaction and identify the first expensive rendering phase. |
| Day 6 | PracHub practice | Solve the frame-player and performance-debugging prompts under time. |
| Day 7 | Mock interview | Give a six-minute diagnosis with evidence, fix, trade-off, and verification. |
Mistakes that weaken a rendering answer
The first mistake is treating the pipeline as a fixed waterfall that always runs end to end. The second is calling every visual problem a React re-render, even when the trace shows layout or paint after a small DOM update. The third is claiming that transforms, layers, or the GPU are universally faster without discussing memory, raster, or visual semantics.
Avoid optimizing from screenshots alone. Ask for a trace, name the affected phase, and describe what would falsify your diagnosis. Do not confuse smooth animation with accessible interaction: preserve reduced motion, focus, reading order, and final layout correctness.
Browser rendering interview FAQ
Do frontend interviews really ask browser internals?
Yes, especially for senior frontend and performance-focused roles. Questions often appear as a janky animation, slow list, layout-thrashing bug, rendering explanation, or DevTools investigation rather than a request to recite engine architecture.
Should I memorize which CSS properties trigger each stage?
Learn representative examples, but do not rely on a static property chart as universal truth. Browser implementations evolve. Explain the likely dependency, then measure the actual page with current tooling.
Is compositing always performed on the GPU?
No universal answer applies to every browser, platform, and fallback path. Chromium commonly uses GPU resources for raster and drawing, but architecture and scheduling vary. In an interview, focus on reusable outputs, threads, layers, memory, and measured behavior.
What makes a browser rendering answer senior-level?
A senior answer scopes the symptom, distinguishes rendering phases, uses trace evidence, limits invalidation or avoids work, states semantic and memory trade-offs, and verifies performance and correctness on representative devices.
Final takeaway
Browser rendering interviews reward a causal model. Trace the update from source to pixels, identify the first expensive phase, and optimize only the work the evidence supports. Then repeat the same measurement and protect visual correctness.
Use PracHub's Frontend Engineer interview questions to practice that complete loop with realistic prompts and written solutions.
Sources and Further Reading
- MDN: Critical Rendering Path
- MDN: Populating the Page - How Browsers Work
- Google: Rendering Performance
- Google: Avoid Large, Complex Layouts and Layout Thrashing
- Chrome for Developers: RenderingNG Architecture
- Chrome DevTools: Performance Panel Overview
- Google: How to Create High-Performance CSS Animations
- MDN: Window.requestAnimationFrame()
- MDN: CSS Containment
Research note: This guide was checked on August 22, 2026. Rendering architecture and DevTools evolve, so verify current browser documentation when preparing for a specific interview.
Comments (0)