Canva Data Scientist Interview: Product Metrics, SQL, and Experimentation
Quick Overview
Prepare for Canva Data Scientist interviews with current role guidance, a carefully bounded candidate report, and an original shared-design SQL exercise. Compare team and user collaboration metrics, preserve inactive teams, handle overlapping membership and duplicate edits, and choose an experiment unit with spillovers and decision uncertainty in mind.
For a Canva Data Scientist interview, practise turning a product question into a precise metric, a correct SQL query, and a defensible experiment decision. The current official role description supports that preparation focus. It does not establish a universal sequence of SQL, statistics, and case-study rounds.
Our preparation thesis: in a collaborative design product, choosing the unit is part of solving the problem. Users, designs, teams, and edit events answer different questions. Your query and experiment need to agree about which one matters.
The shared-design exercise below is original practice material, not a reported Canva interview question or a description of Canva's internal data model. Use PracHub's Data Scientist questions to extend the SQL and experimentation follow-ups.

Separate official role expectations from candidate reports
Official role context: Canva's Senior Data Scientist–Product, Features & Growth listing is for Sydney, full-time and hybrid, within Engineering. It emphasizes complex SQL, experiments, metric definition, event instrumentation, and communicating findings to technical and non-technical partners. This is a senior role snapshot, not a universal entry requirement or interview syllabus. The official listing.
Official process boundary: Canva says hiring varies by role, level, and specialty. Its general hiring page explicitly distinguishes engineering from other roles, including take-home challenges and AI-assisted evaluation. Because this DS listing sits within Engineering, do not automatically apply the non-engineering take-home format or broad AI permission. Confirm the route and allowed tools with your recruiter. Canva's hiring guidance.
Candidate report: one publicly visible Q3 2026 account hosted by Interview Query describes an HR conversation followed by hands-on SQL, including joins, missing matches, and metric calculations. The platform labels the account AI-anonymized. Its other visible summaries do not establish independent, same-cycle evidence for one office and level. Treat this as a reported experience, not a promised loop. The hosted report.
Our inference: prioritize product metrics, executable SQL, and experiment reasoning, then adjust the balance to the specific team and invitation.
Define collaboration before counting it
Imagine a fictional design product testing a feature that helps teammates work on a shared design. Product asks whether collaboration is healthy. Counting edits immediately would skip the hardest part: deciding what behavior represents useful collaboration.
For this exercise, a design qualifies when at least two distinct members of its owning team edit it during the analysis week. A team qualifies when at least one of its designs qualifies. A collaborating user is a distinct member who edited a qualifying design.
These are chosen definitions, not universal product metrics. A view, share-link creation, guest edit, or repeated edit by the same person does not establish the defined behavior. Nor does editing separate designs alone establish collaboration on one design.
Fix eligibility before observing activity. Here, all three teams and all six unique users in a supplied membership snapshot are eligible. Membership and design ownership stay constant during the week. Personal designs have no owning team and are outside scope.
The window is September 1 through September 7, 2026, in UTC: include the start timestamp and exclude September 8. All sample timestamps use the same sortable UTC text format. Production data would require explicit timestamp normalization and membership history.
Work through a small dataset before writing SQL
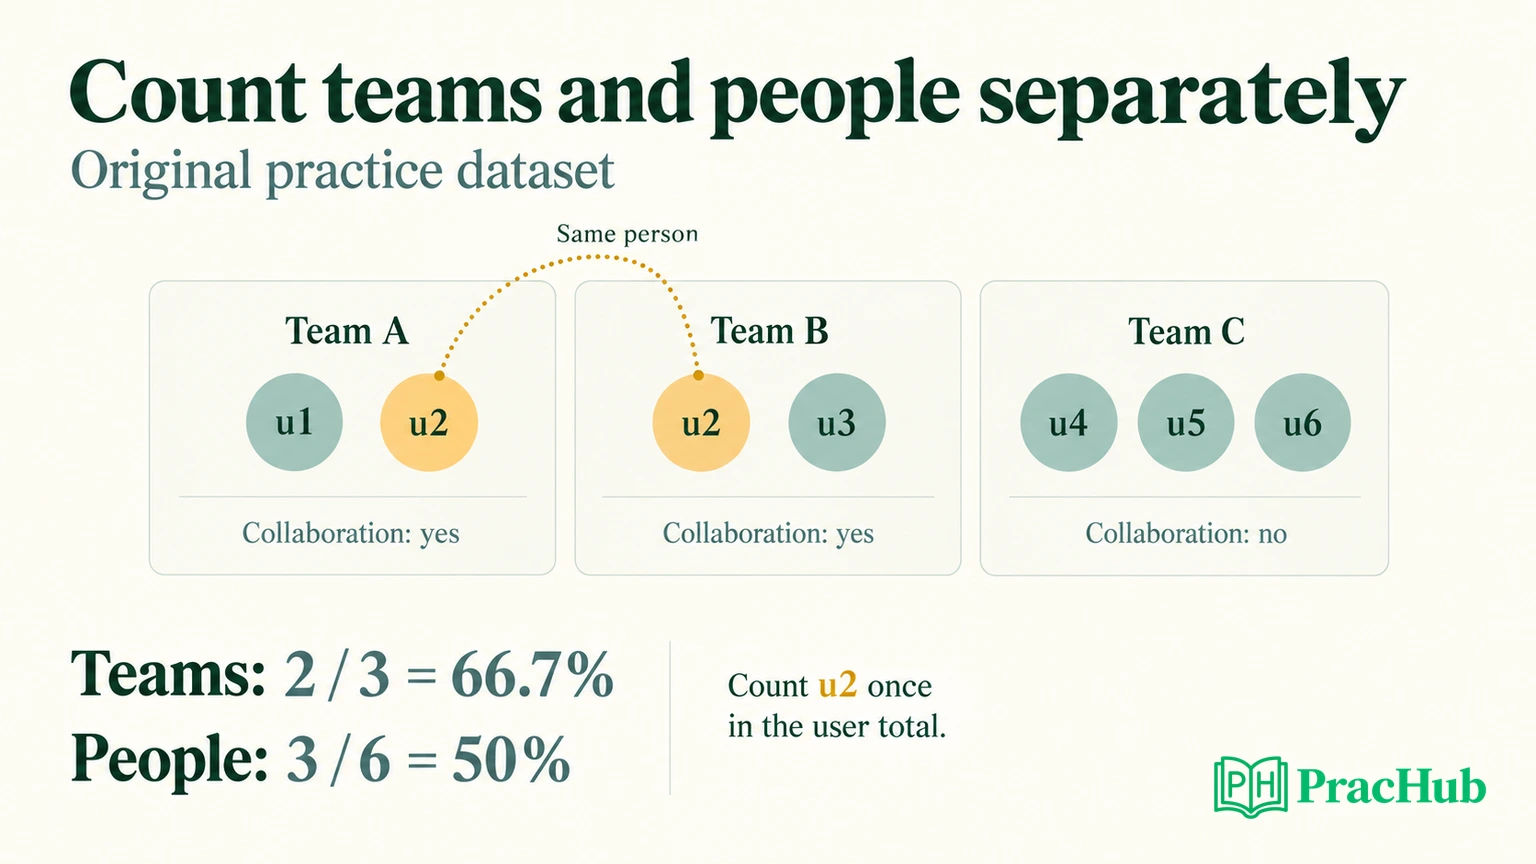
Team A contains u1 and u2. Team B contains u2 and u3. Team C contains u4, u5, and u6. User u2 belongs to two teams, so summing membership rows would count seven memberships rather than six people.
Designs d1 and d2 belong to A, d3 to B, and d4 to C. Design d5 is personal. The compact fixture below can be run in SQLite; it includes a repeated event, repeat editing, a guest, a view, and an event exactly at the excluded boundary.
CREATE TABLE members(team_id TEXT, user_id TEXT,
                     PRIMARY KEY(team_id,user_id));
CREATE TABLE designs(design_id TEXT PRIMARY KEY, team_id TEXT);
CREATE TABLE events(event_id TEXT, design_id TEXT, user_id TEXT,
                    kind TEXT, event_at TEXT);
INSERT INTO members VALUES
('A','u1'),('A','u2'),('B','u2'),('B','u3'),
('C','u4'),('C','u5'),('C','u6');
INSERT INTO designs VALUES
('d1','A'),('d2','A'),('d3','B'),('d4','C'),('d5',NULL);
INSERT INTO events VALUES
('e1','d1','u1','edit','2026-09-02 10:00:00'),
('e1','d1','u1','edit','2026-09-02 10:00:00'),
('e2','d1','u1','edit','2026-09-03 10:00:00'),
('e3','d1','u2','edit','2026-09-01 00:00:00'),
('e4','d2','u1','edit','2026-09-04 10:00:00'),
('e5','d3','u2','edit','2026-09-02 10:00:00'),
('e6','d3','u3','edit','2026-09-03 10:00:00'),
('e7','d4','u4','edit','2026-09-05 10:00:00'),
('e8','d1','u3','edit','2026-09-06 10:00:00'),
('e9','d5','u5','edit','2026-09-06 10:00:00'),
('e10','d4','u5','view','2026-09-06 10:00:00'),
('e11','d4','u6','edit','2026-09-08 00:00:00');
Compute the answer by hand first. Designs d1 and d3 qualify. Team C has an in-window editor but no design with two member editors. User u3's edit on A's design is a guest edit because u3 belongs to B, not A.
The team rate is two of three, approximately 66.7%. The collaborating users are u1, u2, and u3: three of six, or 50%. The two percentages differ because their units and denominators differ, not because one calculation is wrong.
Preserve the denominator and control the join grain
Build intermediate results with explicit meanings: eligible teams, unique member–design edits, qualifying designs, team flags, and unique collaborators. SQLite's ordinary CTEs support this decomposition; its aggregate documentation explains distinct counting and NULL behavior. SQLite CTEs, aggregate functions.
WITH eligible_teams AS (
  SELECT DISTINCT team_id FROM members
), member_edits AS (
  SELECT DISTINCT d.team_id, e.design_id, e.user_id
  FROM events e
  JOIN designs d ON d.design_id = e.design_id
  JOIN members m ON m.team_id = d.team_id
                AND m.user_id = e.user_id
  WHERE e.kind = 'edit'
    AND e.event_at >= '2026-09-01 00:00:00'
    AND e.event_at < '2026-09-08 00:00:00'
), shared_designs AS (
  SELECT team_id, design_id
  FROM member_edits
  GROUP BY team_id, design_id
  HAVING COUNT(*) >= 2
), team_flags AS (
  SELECT t.team_id,
         CASE WHEN COUNT(s.design_id) > 0 THEN 1 ELSE 0 END AS collaborated
  FROM eligible_teams t
  LEFT JOIN shared_designs s ON s.team_id = t.team_id
  GROUP BY t.team_id
), collaborators AS (
  SELECT DISTINCT e.user_id
  FROM member_edits e
  JOIN shared_designs s ON s.team_id = e.team_id
                      AND s.design_id = e.design_id
)
SELECT COUNT(*) AS eligible_teams,
       SUM(collaborated) AS collaborating_teams,
       AVG(1.0 * collaborated) AS team_rate,
       (SELECT COUNT(DISTINCT user_id) FROM members) AS eligible_users,
       (SELECT COUNT(*) FROM collaborators) AS collaborating_users
FROM team_flags;
The output is 3, 2, 0.666666..., 6, 3. Divide the last count by eligible users to obtain the user rate. If the eligible population is empty, report an undefined rate rather than quietly substituting zero.
The membership join uses both team and user. Joining on user alone would attach u2's activity to both memberships without respecting design ownership. The left join starts from eligible teams so C survives with a zero flag.
DISTINCT in member_edits establishes one row per team, design, and person. That makes repeated edits irrelevant for this yes-or-no collaboration definition. It is not a general event-cleaning strategy: counting edit volume would require resolving duplicate event IDs and conflicting payloads separately.
The final collaborator set deduplicates u2 across A and B. Adding each team's collaborator count would yield four memberships, not three unique collaborating people.
Test the definition, not just a successful query run
Run checks that could expose a wrong interpretation. Repeating the same edit should leave both rates unchanged. Adding a second member's in-window edit to d4 should make C qualify. Moving that edit exactly to September 8 should remove its contribution again.
Remove all events while retaining membership. The result should still include three eligible teams and six eligible users, with no collaboration. Remove eligibility too, and distinguish “no eligible population” from “eligible population with zero success.”
Also inspect intermediate rows. The guest and personal-design events must disappear from member_edits; d2 must not qualify; u2 must appear only once in the final user set. These checks catch plausible totals produced by incorrect joins.
Our local verification runs the article's SQL in SQLite and checks these cases. It establishes the exercise's behavior, not Canva's warehouse dialect or production data quality. At scale, explain how time filtering, membership keys, and preaggregation affect the plan, then inspect the actual query plan before promising performance.
Choose the experiment unit from how the feature works
Now suppose the feature changes a shared design's collaboration controls for everyone on the owning team. Individual randomization could expose one teammate to treatment while another remains in control, yet both interact with the same design. A control user's outcome could change because their teammate received the feature.
Research context: network interference means one unit's outcome can depend on other units' assignments. Work by Eckles, Karrer, and Ugander examines designs and analyses that reduce resulting bias, including correlated assignment through clusters. This supports examining spillovers; it does not prove that any particular team partition eliminates them. The research paper.
Our proposed design for this fictional feature: assign eligible teams before exposure, keep assignment stable, and evaluate the proportion of eligible teams with a qualifying collaborative design over a predeclared window. A member should receive the owning team's experience while working in that team's context.
User u2 exposes a limitation. They can move between treated and control teams and carry learned behavior across contexts. Log cross-team participation, decide how to handle overlapping memberships before launch, and assess residual spillovers. Larger connected groups may reduce contamination but leave fewer independent units and less precise estimates.
User randomization could be reasonable for a private editing preference with negligible effects on teammates. The answer depends on the intervention, not a rule that every collaborative product must randomize teams.
Keep weighting and uncertainty aligned with the decision
A team-level outcome answers a team-level question. It does not automatically describe the experience of the average user. Choose the target quantity before comparing variants, and explain which population the recommendation serves.
Consider a separate fictional illustration: one ten-person team qualifies and one ninety-person team does not. The unweighted team success rate is 50%. The share of unique users belonging to a successful team is 10%, assuming disjoint membership. Neither measures the percentage of users who personally collaborated; that requires the editor-level definition.
For a team-randomized experiment, uncertainty must respect the assignment and dependence structure. Do not treat every edit as an independent sample. Plan the required precision using historical team-level variation and the actual eligible team count; unequal sizes and overlapping users require additional care.
Keep assigned teams in the primary analysis even if they never use the feature. Restricting the denominator to teams that became active after treatment can select on behavior the feature changed. Use exposure and adoption measures as diagnostics alongside the primary assignment-based comparison.
Before interpreting a lift, check assignment balance, event coverage, eligibility consistency, and missing team identifiers. Use guardrails that match the intervention, such as design-save failures, permission errors, or declines in successful exports. Define unacceptable changes before examining results.
Turn conflicting metrics into a clear recommendation
Suppose team collaboration rises but unique collaborating users remain flat. Investigate whether already-active people spread activity across more teams, whether smaller teams drove the gain, and whether the feature changed event logging. The SQL fixture shows why team and person counts need not move together.
A useful readout states the decision, primary effect estimate and uncertainty, guardrails, and the unresolved issue that could change the recommendation. “Team collaboration improved, so ship” skips whether the effect is reliable and whether the chosen metric represents customer value.
If precision is insufficient, say which additional evidence is needed. Continue only under the experiment's predeclared analysis or sequential-testing plan; repeatedly checking until a conventional significance threshold appears changes the error behavior.
For your own project discussion, prepare one example where you changed a metric definition or challenged a misleading result. Explain the original decision, your analysis, the correction, and what stakeholders did differently afterward. This connects SQL technique to the communication responsibilities in the role.
Five questions for targeted practice
These records come from other company contexts and are adjacent practice, not Canva interview predictions. Apply their reasoning to the shared-design example without importing marketplace, streaming, or booking assumptions unchanged.
| PracHub question | What to practise |
|---|---|
| Deduplicate events and rank products with SQL | Separate business grain from retry-event cleanup. |
| Analyze time-zoned events with pandas | Make event time, eligibility, and counting rules explicit. |
| Design an experiment with marketplace network effects | Explain assignment choices and remaining spillovers. |
| Analyze A/B Test Results to Inform Stakeholder Decisions | Connect validation and uncertainty to a recommendation. |
| Describe past project experience clearly | Show how your analysis changed a product decision. |
Continue with PracHub's Data Scientist collection. Pick one metric, write its denominator in plain English, and prove your query preserves it before discussing an experiment.
Comments (0)