Data Analyst Excel Assessment: Clean the Workbook, Build a PivotTable, and Explain Results
Quick Overview
Clean an original order workbook, reconcile refunds at order grain, build a PivotTable, and defend the denominator behind the business conclusion.
A data analyst Excel assessment is often won or lost before the PivotTable appears. If duplicate rows inflate sales, a lookup loses a second refund, or a missing amount becomes zero, the final chart can look polished while answering the wrong question. Start by defining what each row represents and how you will reconcile the result.
This original orders-and-refunds exercise follows one dataset from inspection to a business explanation. After working through it, use PracHub's Build SQL pivot with lookups and currency conversion to practice transferring the same aggregation logic into SQL.
Evidence boundary: Microsoft documentation supports the Excel feature guidance. The workbook, defects, numbers, and assessment task are original PracHub practice material. They are not a leaked employer test, a universal assessment format, or a provider scoring rubric.
Start with the workbook and the business question
Use the original raw workbook first, then compare your work with the answer workbook. Use Download in each preview to save the .xlsx file. Preserve the raw tabs and work in a separate copy. The task is to summarize valid completed orders by region, subtract their valid refunds, and explain both refund incidence and the proportion of sales refunded.
All amounts are synthetic US dollars. The data describes an August 2026 order cohort with a reporting cutoff of August 31. Ignore taxes, delivery fees, and currency conversion in this exercise. Those are scope assumptions, not general accounting rules.
The raw workbook contains Orders, Refunds, and a region mapping. Orders are intended to represent one order each. Refunds represent refund events: one order can have several legitimate events. That difference determines which duplicates to remove and which rows to aggregate.
Before touching formulas, write down the expected output grain: one valid completed order, enriched with its total valid refunds. The regional PivotTable will then aggregate those order rows. Joining raw refund events directly to orders would duplicate order amounts for orders with multiple refunds.
Inspect types and exceptions before calculating
The raw file has 13 order rows and six refund rows. Inspect identifiers, dates, status labels, region values, and amount types. A cell that looks like a number may contain text; applying a currency format does not convert it into a numeric value.
This dataset includes a numeric-looking text amount, inconsistent region labels, an exact duplicate order, a cancelled order, and an unknown amount represented by ?. The refund file includes an exact repeated event and a refund associated with an unknown order.
Keep an exceptions record explaining each decision. Remove the repeated O03 order only after confirming that the repeated row is identical. Exclude O11 because it is cancelled. Quarantine O12 because its amount is unknown. Do not silently assign O12 a zero-dollar value and count it as a valid order.
For dates, confirm the source convention before conversion. These inputs use unambiguous ISO strings such as 2026-08-01. One explicit conversion is DATE(LEFT(B2,4),MID(B2,6,2),RIGHT(B2,2)), followed by a date format. For unfamiliar data, validate the components too: a date constructor can normalize an invalid day into another month.
Explain these decisions while working. An assessor can evaluate a clearly stated exception policy; an unexplained deletion leaves uncertainty about whether you noticed the problem or accidentally removed data.
Normalize regions with a controlled mapping
Use a helper key such as UPPER(TRIM(C2)) to normalize ordinary surrounding spaces and capitalization. In this exercise, the mapping converts both E and EAST to East, and W and WEST to West. Keep that mapping visible so another analyst can inspect it.
In Microsoft 365, an exact-match lookup can make an unmapped value explicit:
=XLOOKUP(UPPER(TRIM(C2)),'Region Map'!$A$2:$A$5,
         'Region Map'!$B$2:$B$5,"UNMAPPED",0)
Official compatibility note: Microsoft states that XLOOKUP is unavailable in Excel 2016 and Excel 2019. Check the assessment environment rather than assuming a function available on your own computer will work there. Microsoft XLOOKUP documentation
An exact INDEX/MATCH lookup is an alternative in older versions. Keep an unmatched result visible for investigation. A blanket error handler that returns East, an empty string, or zero can hide a broken mapping and produce a plausible but incorrect regional summary.
The answer workbook stores the cleaned region and date values as the result of a reviewed cleaning step. Its later refund and summary calculations remain formula-driven. Editing the raw tabs does not automatically rerun that cleaning step; repeat the transformation deliberately when the source changes.
Deduplicate refund events without losing real refunds
R01 appears twice with the same order, date, and amount. Keep one copy after confirming it is an exact repeat. R02 is another refund on O02 and must remain: the order received two legitimate partial refunds, $20 and $30.
A lookup that returns only the first refund for O02 would report $20 instead of $50. Removing duplicates by OrderID would make the same mistake. The refund event identifier, together with consistency checks on its attributes, is the relevant deduplication key.
R05 refers to O99, which is absent from the supplied orders. Quarantine that $40 refund as an orphan and request the missing order or corrected reference. Do not subtract it from a random region, and do not create an invented order to make the join work.
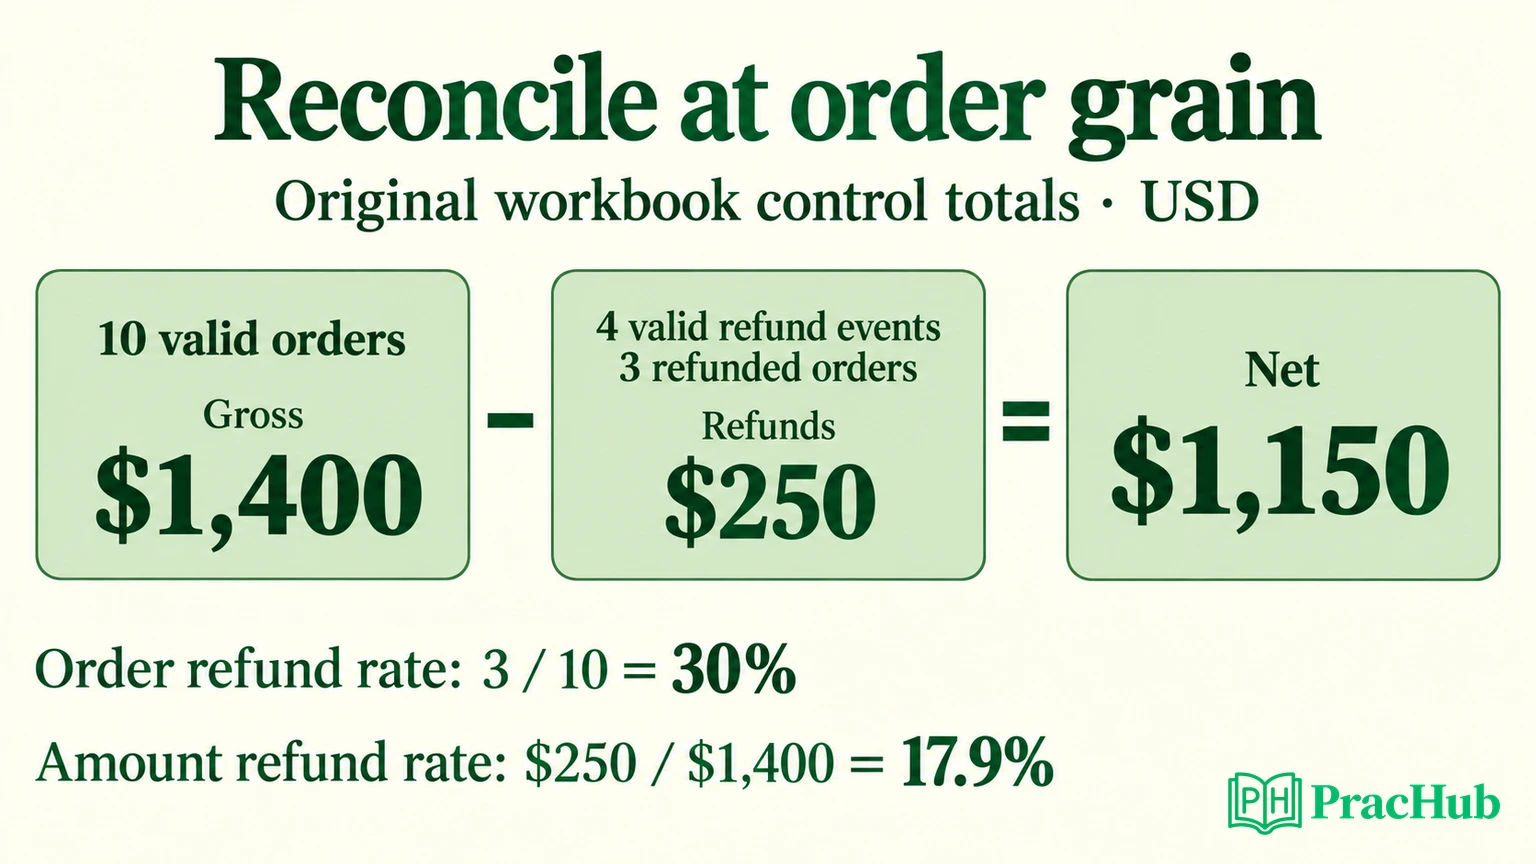
The cleaned refund table contains four events totaling $250. Those events belong to three distinct valid orders. The raw refund total is $310: removing the repeated $20 event and quarantining the $40 orphan reconciles it to $250.
A useful follow-up is how you would handle two rows with the same RefundID but different amounts. That is a conflicting record, not an exact duplicate. Investigate the source's correction or versioning rules before choosing a value.
Aggregate refunds back to one row per order
The cleaned order table contains O01 through O10: ten valid orders totaling $1,400. Keep each order once and calculate its refund amount from the cleaned event table.
In the answer workbook, column E of Clean Orders uses a bounded SUMIF. Column F subtracts refunds, column G marks whether any positive refund exists, and column H contains one for counting orders:
E2 = SUMIF('Clean Refunds'!$B$2:$B$5,A2,
           'Clean Refunds'!$D$2:$D$5)
F2 = D2-E2
G2 = IF(E2>0,1,0)
H2 = 1
These formulas assume the already-cleaned refund table contains the valid events for this cohort and cutoff. The zero returned when an order has no matching refund is meaningful here. It is different from replacing an invalid amount with zero during cleaning.
Check O02 specifically: $200 gross, $50 refunded, and $150 net. Check O03: $150 gross and fully refunded, producing zero net but still one valid completed order with a refund. A fully refunded order does not disappear from the refund-incidence denominator.
Also test that refunds do not exceed an order's gross amount under the exercise's assumptions. If they do, investigate duplication, adjustment rules, or a mismatched cohort. In real data, additional financial rules may apply; do not erase the discrepancy merely to force a nonnegative result.
Build the PivotTable from the cleaned order grain
Official feature guidance: Microsoft recommends a tabular source with a single header row and consistent column types. A PivotTable can summarize numeric data, while mixed types can cause a field to be counted instead of summed. Create a PivotTable
Select Clean Orders!A1:H11, then insert a PivotTable into a new worksheet. Put Region in Rows. Add Orders, Gross, Refund, Net, and Refunded to Values, and explicitly check that every field uses Sum. Orders is a numeric one-per-order helper, so its sum gives the order count at this cleaned grain.
For a growing dataset, an Excel Table can make the source range easier to maintain. In this fixed exercise, the answer's pivot source is the explicit eleven-row range including headers. If you append an order outside it, update the source range before refreshing; a refresh cannot include rows outside the defined source.
The same pivot totals are shown below by measure; monetary values are USD.
| Measure | East | West | Total |
|---|---|---|---|
| Orders | 6 | 4 | 10 |
| Gross | 830 | 570 | 1400 |
| Refund | 50 | 200 | 250 |
| Net | 780 | 370 | 1150 |
Reconcile the PivotTable to an independent formula summary, not to a copied screenshot of the same pivot. The answer's Control Totals sheet uses SUMIF over the cleaned orders and includes explicit expected totals with zero differences.
Calculate the two refund rates with their own denominators
Refund incidence answers: “What share of valid completed orders had any refund by the reporting cutoff?” Three of ten orders qualify, so the answer is 30%.
The refund amount rate answers: “What share of this cohort's gross sales has been refunded?” The calculation is $250 / $1,400, or approximately 17.9%. The two rates describe different things and should not share an ambiguous label such as “refund percentage.”
East has one refunded order out of six, or 16.7%. West has two out of four, or 50%. Averaging those displayed percentages gives about 33.3%, which is not the overall order rate. Recompute from the combined numerator and denominator: (1 + 2) / (6 + 4) = 30%.
The same principle applies to the amount rate. Divide total refunds by total gross sales; do not average regional percentages unless you intentionally apply the correct gross-sales weights. Work from unrounded inputs and round only the displayed result.
State the cohort and cutoff when presenting either rate. An order-cohort refund rate is different from refunds paid during a calendar month divided by sales booked during that month. Later refunds could change this cohort's final outcome.
Test refresh behavior before handing over the file
Official refresh guidance: Microsoft documents manual PivotTable refresh and notes that automatic refresh behavior depends on the Excel version and feature availability. Use an explicit refresh check instead of assuming the current display reflects every source edit. Refresh PivotTable data
A simple test is to temporarily change O01's cleaned gross amount from $100 to $110. Its refund remains zero. After recalculation and pivot refresh, total gross should be $1,410 and total net $1,160; order count and refunds should remain unchanged. Restore the original amount and confirm $1,400 and $1,150 again.
Perform this check in a copy, and make the source of the change clear. It tests the cleaned-order-to-summary path. It does not prove that a newly appended raw record is cleaned, mapped, included in the pivot source, and refreshed automatically.
Before submitting, open the saved file, inspect every relevant sheet, confirm formulas rather than pasted results where calculations should update, and remove accidental filters. Keep the exception decisions available so someone else can reconstruct the accepted population.
Explain the result as a business finding
A concise conclusion is: “The ten valid completed orders generated $1,150 net after $250 in matched refunds. West accounts for $200 of those refunds, including one fully refunded order. Its refund incidence is higher in this small sample, but the data does not establish a persistent regional quality problem.”
Recommend inspecting the underlying order reasons before making a policy change. The dataset is tiny, refund maturity may differ, and one missing-amount order and one orphan refund remain unresolved. Those limitations affect how confidently the result can be generalized.
Transfer the reasoning to five practice questions
These PracHub questions extend the data reasoning into SQL and analytical discussion. They are not an Excel execution environment or an employer-specific question set.
| PracHub question | Practice focus |
|---|---|
| Build SQL pivot with lookups and currency conversion | Preserve grain through lookups and aggregation. |
| Deduplicate events and rank products with SQL | Choose a valid deduplication key. |
| Compute Total Spent in 2023 Excluding Refunds | Define the relevant transaction population. |
| Calculate Monthly Revenue from Orders in 2023 | State the reporting period and measure. |
| Reconcile ledgers with SQL/Python and late events | Explain mismatches and late data. |
After completing the workbook, try the pivot and lookup exercise. Explain where a one-to-many relationship could multiply rows before writing the aggregation.
Comments (0)