Data Science Resume Examples: Projects, Metrics, and Technical Impact That Earn Interviews
Quick Overview
Data science resume examples for students and experienced candidates, with project bullets, metric frameworks, ATS guidance, and interview-ready technical impact.
A data science resume can list Python, SQL, XGBoost, Tableau, and five cloud tools and still fail to earn interviews. The problem is not always missing skills. It is that the reader sees a toolbox, but cannot see what question you answered, what data you wrestled with, or what changed because of your work.
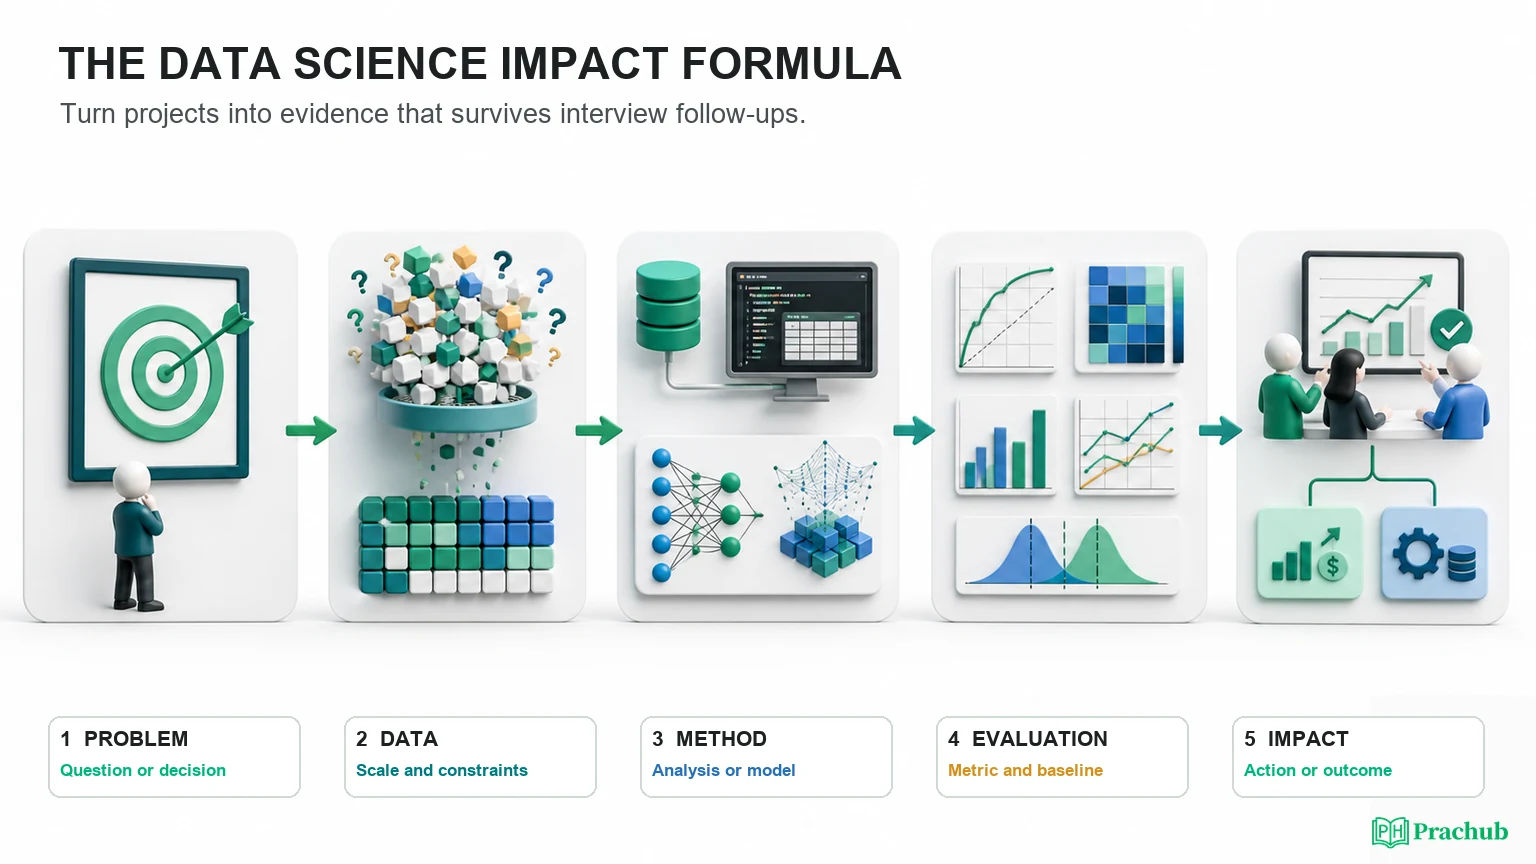
A strong resume makes the full analytical chain visible: problem, data, method, evaluation, and decision or impact. This guide shows how to write that chain with honest metrics, whether your experience comes from a product team, an ML system, research, a capstone, or a personal project.
Your resume also sets the agenda for later interviews. Compare every major claim with Data Scientist interview questions, then use PracHub's SQL and data manipulation practice to make sure the skills on the page survive a technical screen.
Quick Answer: What Makes a Data Science Resume Earn Interviews?
A strong data science resume proves that you can turn ambiguous questions and imperfect data into a defensible result that someone can use. Tools matter, but they are supporting evidence. The main story is the problem you framed, the analytical choices you made, the quality of your evaluation, and the decision your work supported.
| Signal | Weak evidence | Interview-earning evidence |
|---|---|---|
| Problem | Analyzed customer data | Names the business or research question and the decision it informed |
| Data | Used a public dataset | Shows scale, joins, missingness, labeling, bias, or quality constraints |
| Method | Built an XGBoost model | Explains why the approach fit the problem and baseline |
| Evaluation | Achieved 94% accuracy | Uses the right metric, validation design, uncertainty, and comparison |
| Impact | Presented insights | Shows a decision, adoption, experiment result, time saved, risk reduced, or next step |
That pattern matches the actual work. O*NET describes data scientists as transforming raw data into meaningful information, applying modeling and machine learning, and interpreting and reporting findings. INFORMS goes further: employers want evidence of problem framing, data judgment, method selection, communication, and lifecycle thinking, not a tool list alone.
The Data Science Resume Bullet Formula
A reliable structure is:
Problem + Data + Method + Evaluation + Decision or Impact
You will rarely fit every element into one sentence. Use one or two concise bullets for a major project: the first establishes the question, data, and approach; the second shows validation, deployment, adoption, or measurable outcome.
Compare "Built a churn model in Python" with: "Developed a churn model on 4.2 million subscription records after resolving leakage in cancellation features; improved precision at the retention team's fixed outreach capacity from 31% to 46%, informing a controlled pilot for 60,000 accounts."
The second version gives an interviewer somewhere useful to go. Why was precision the right metric? How was leakage detected? What baseline was used? How did the team size the pilot? A good resume bullet is compact evidence, not the end of the story.
Data Science Resume Examples by Project Type
The examples below are hypothetical. Replace every metric, tool, and outcome with facts you can explain. Their purpose is to show structure, not to provide copy-and-paste claims.
Product experimentation
Before: Analyzed an A/B test and presented results to the product team.
After: Designed and analyzed a 21-day checkout experiment across 1.6 million sessions; defined guardrail metrics, corrected a sample-ratio mismatch, and estimated a 2.8% conversion lift with a 95% confidence interval, leading the team to ship the variant to 50% of traffic.
This shows more than statistical vocabulary. It demonstrates experimental integrity, scale, uncertainty, and a product decision. If the result was inconclusive, say so and show the decision it prevented or the next test it motivated.
Machine learning and model evaluation
Before: Trained a fraud detection model using LightGBM.
After: Rebuilt a fraud-ranking model on 18 months of delayed-label transaction data; used time-based validation and probability calibration to raise recall from 62% to 74% at a fixed 1% review rate, reducing manual investigations by 1,100 hours per quarter.
The metric is tied to an operating constraint. "Accuracy" would hide the class imbalance and the cost of review. Strong ML bullets show why the evaluation matched the real decision.
SQL and product analytics
Before: Used SQL and Tableau to create retention dashboards.
After: Reconciled event and billing data across seven tables to define cohort retention for a new subscription tier; identified a 14-point activation gap among mobile users and helped prioritize an onboarding change that recovered 6% of first-month retention.
SQL is not merely syntax here. The bullet shows metric definition, data reconciliation, segmentation, and the decision supported by the analysis.
Forecasting and operations
Before: Created a demand forecasting model for inventory.
After: Built a hierarchical weekly demand forecast for 2,300 store-item series, benchmarking seasonal naive, gradient boosting, and reconciliation methods; reduced weighted MAPE from 29% to 21% and lowered emergency replenishment orders by 17% in a regional pilot.
Model metrics and operational metrics serve different readers. Including both shows that the model was not optimized in isolation.
Data quality and analytical infrastructure
Before: Improved the data pipeline and automated reports.
After: Added freshness, schema, and distribution checks to 42 production features used by three risk models; cut data-related scoring incidents from nine per quarter to two and reduced analyst investigation time by 35 hours per month.
Data scientists create technical impact even when they are not training a new model. Reliability, reproducibility, observability, and analyst leverage are valid outcomes.
Academic, capstone, or personal project
Before: Predicted housing prices with random forests and achieved high accuracy.
After: Built a reproducible housing-price benchmark on 48,000 public records; documented geographic missingness, compared linear and tree-based baselines with cross-validation, and reduced median absolute error by 18% while publishing the data dictionary, tests, and limitations.
Do not invent business adoption for a class project. A credible project can still show problem framing, data quality work, sound validation, reproducibility, and honest limitations.
Use a Metric Stack, Not One Impressive Number
Data science candidates often stop at a model metric. AUC, F1, RMSE, or lift may be important, but the hiring reader also needs context. Build a small metric stack around the work.
Start with data scale or complexity: rows, users, time window, number of sources, missingness, label delay, class imbalance, or latency constraint. Add a technical quality metric that matches the task. Then show the decision or operational result: adoption, revenue, cost, time, risk, retention, throughput, or a well-defined recommended next step.
Never combine incompatible numbers just to sound quantitative. A model can improve offline AUC while producing no measurable product lift. If that happened, the honest story may be the learning: the team discovered a targeting assumption was wrong and avoided a costly rollout.
How to Write Projects When You Have No Data Science Job Yet
Projects can carry an early-career resume, but only when they demonstrate decisions rather than tutorial completion. Duke's data-resume guidance recommends making the project type, tools, and tangible outcome clear. INFORMS recommends showing the problem, your role, the data, method, communication, and outcome or next step.
Choose two or three projects that cover different evidence. One might show SQL and product metrics, another model evaluation, and a third messy data or deployment. Ten similar notebook projects make each one feel less important.
For each project, link only to something worth opening: a concise README, reproducible code, an analysis with limitations, or a small deployed artifact. A repository with no setup instructions and a 90 MB notebook can weaken rather than strengthen the claim.
Tailor the Resume to the Data Science Role
Product Data Scientist roles usually reward SQL, metric design, experimentation, causal thinking, product judgment, and communication. Lead with analyses that changed a roadmap or clarified a decision.
Applied or ML Data Scientist roles need deeper modeling, feature work, evaluation, and production awareness. Show baselines, offline and online metrics, constraints, monitoring, and collaboration with engineering.
Analytics-focused roles may value SQL, dashboards, forecasting, stakeholder work, and decision support more than sophisticated modeling. Do not hide strong analytical impact behind an ML project that is less relevant.
Research-oriented roles can include publications and novel methods, but industry readers still need your contribution, empirical result, scale, and practical implication. Translate the paper title into the problem and evidence.
Use company and role context before reordering the page. PracHub's Google Data Scientist interview guide shows how product, statistics, SQL, and project discussion can appear together, while the Interview Query review for Data Scientists maps the broader mix of SQL, product sense, statistics, and ML preparation.
Keep the Resume ATS-Friendly and Human-Readable
Use a conventional one-column structure with clear headings, reverse-chronological experience, a concise technical-skills section, and projects placed where their context is obvious. Microsoft currently advises simple DOCX or PDF files without heavy tables, images, unusual fonts, or complex sections, and recommends nesting projects under the role where the work happened.
Google notes that resume parsing can be incomplete, so review every field extracted into the application. Do not assume a beautifully designed PDF was understood correctly.
Organize skills by category, such as languages, data and databases, modeling, visualization, and platforms. Only list a skill you can defend. "Python, SQL, pandas, scikit-learn" is useful when the experience bullets prove how you used them; a wall of 35 keywords is not.
Common Data Science Resume Mistakes
The first mistake is model-first writing. "Built a neural network" begins with a solution before the reader knows the problem. Start with the question or constraint.
The second is metric theater. A 98% accuracy claim without class balance, baseline, validation design, or use case invites skepticism. Choose the metric that reflects the actual cost of errors.
The third is borrowed team impact. If a product grew 20% while you worked on one exploratory analysis, do not claim the whole result. Isolate your contribution and use language such as "informed," "supported," or "evaluated" when that is accurate.
Finally, do not list confidential data, model details, or customer information. Use approved ranges, percentages, generalized scale, or public metrics while preserving the analytical story.
A 15-Minute Data Science Resume Audit
| Check | Question to ask | Fix |
|---|---|---|
| Problem | Can a reader name the decision or question? | Add one line of business, product, research, or operational context. |
| Data | Is the difficult part of the data visible? | Name scale, joins, labels, missingness, bias, privacy, or freshness. |
| Method | Does the approach have a reason? | Add the baseline, constraint, or trade-off that shaped the method. |
| Evaluation | Is the metric appropriate and defensible? | State the validation design, comparison, uncertainty, or threshold. |
| Impact | What changed after the analysis? | Add adoption, a decision, operational result, or honest next step. |
| Interview readiness | Can I answer follow-ups on every claim? | Remove or narrow anything you cannot explain from memory. |
Frequently Asked Questions
How long should a data science resume be?
One page is often enough for students and early-career candidates. Two pages can be reasonable for experienced candidates when the second page contains relevant work, publications, leadership, or production impact rather than old coursework.
Should I include Kaggle projects?
Yes, when the project demonstrates something the target role values. Explain the problem, your individual contribution, validation, and what you learned. A leaderboard score without data or method context is weak evidence.
Which model metrics belong on a resume?
Use metrics that match the problem: precision or recall under a threshold, calibration, ranking metrics, error measures, confidence intervals, or experiment lift. Include a baseline or operating constraint whenever possible.
Do I need a portfolio website?
No. One or two well-documented repositories or case studies can be enough. A portfolio helps only when it makes your reasoning, code quality, communication, or reproducibility easier to evaluate.
Should I list every Python library?
No. Group tools into a compact skills section and prove the important ones inside project or experience bullets. Only list libraries you can discuss and use under interview conditions.
Final Takeaway
A data science resume earns attention when it makes analytical judgment visible. Show the question, the data constraints, the method, the evaluation, and the outcome. Honest context is more persuasive than an isolated accuracy score or a long technology inventory.
Then prepare to defend the same projects aloud. Use PracHub's machine learning questions, SQL practice, and behavioral and leadership questions to rehearse model choices, data limitations, stakeholder conflict, failed experiments, and measurable impact before the interview.
Sources and Further Reading
- Microsoft Careers: Resume Parsing and AI-Friendly Formatting Guidance
- Google Careers Help: Applications and Resume Parsing
- Duke University Career Hub: Data Resume - What and How
- University of Rhode Island: Data Science Resume Sample Guidance
- INFORMS: Using the Analytics Framework to Strengthen a Resume
- O*NET OnLine: Data Scientists
Research note: Sources and application guidance were checked on August 24, 2026. Resume expectations vary by company, role, location, and hiring system.
Related Articles
IBM Data Scientist Intern OA 2027: Coding, MCQs, Preferred Languages, and the 7-Day Deadline
Prepare for the IBM Data Scientist Intern OA 2027: coding, MCQs, preferred languages, the reported 7-day deadline, privacy, and what comes next.
AQR Quantitative Research Intern Interview 2027: Statistics, Python, and Finance
Prepare for AQR's 2027 Research Summer Analyst interview with statistics, Python, finance, research cases, and evidence-backed process notes.
Citadel Securities Quant Research OA 2027: Coding, Math, and Resume Screening
Citadel Securities Quant Research OA 2027 guide to coding, probability, statistics, CoderPad, resume screening, and what comes after the first round.
Dataford Review 2026: Are 19,000+ Interview Questions Worth $29 a Month?
Dataford review 2026: assess 19,000+ interview questions, AI mocks, $29 monthly pricing, limitations, and the best PracHub alternative before subscribing.
Comments (0)