Datadog Technical Support Engineer Interview: Pair Troubleshooting and Agent Diagnostics
Quick Overview
Prepare for a Datadog Technical Support Engineer interview with evidence-aware pair troubleshooting guidance. Follow an executed Agent 7.83.1 log-collection experiment, distinguish process health from loaded configuration and file access, verify a fresh marker, and practice concise customer communication.
A Datadog Technical Support Engineer interview may ask you to troubleshoot with another person while explaining what you are learning. Prepare to separate a running process from a working data path: an Agent can be alive, and its configuration can be visible, while the expected log never reaches its destination.
This guide combines a narrow account of the public interview evidence with an original, locally executed Agent exercise. The central habit is simple: state what an observation proves, what remains unknown, and which check will reduce that uncertainty next. Use Datadog interview practice on PracHub for adjacent skills, while checking your own invitation for the actual role and round.

What is known about pair troubleshooting?
Official facts: Datadog’s Technical Solutions careers page describes support work involving customer problems, triage, troubleshooting, and solutions. The broader organization also includes other functions; a Technical Support Engineer interview should not automatically be treated as a sales engineering presentation. Datadog’s candidate experience guidance says hiring processes vary across roles, teams, and departments.
Candidate reports: A January 2026 Reddit poster described an upcoming pair troubleshooting round and uncertainty about preparing with limited Datadog experience. Some detailed format claims in that discussion were secondhand. A separate Glassdoor question entry mentions pair troubleshooting with managers, but its matching hiring cycle was not verified.
That evidence supports preparing for collaborative diagnosis. It does not establish a universal duration, bug count, document set, cloud platform, or complete interview sequence. Nor do comments about an online assessment establish what happens in the pair round.
Editorial inference: Practice navigating relevant documentation and making your reasoning easy to follow. The exercise below is PracHub’s preparation material, not a reported Datadog interview question or a reconstruction of confidential materials. Before the interview, confirm the expected environment, permitted references, and whether you will share a screen or work through supplied evidence.
Start with the missing observation
“Logs are missing” is an incomplete symptom. Ask which application and host are affected, whether the application is writing new records, where the customer expects to see them, and when that expectation last held. Clarify whether all logs are missing or only one service, file, environment, or time range.
Then define the path: application output, local file, Agent source, processing, outbound delivery, and the customer’s viewing surface. A dashboard showing host metrics establishes something different from a fresh application log appearing in search.
An effective opening could be:
I want to locate the first stage where this specific log stops progressing. First I’ll confirm the configured file and whether it is receiving new lines. Then I’ll compare the Agent’s loaded configuration with its source-specific status.
This gives your partner a plan they can challenge. Avoid narrating every keystroke. Explain the hypothesis before a command, summarize its result afterward, and change the plan when the result contradicts you.
Practice case: the Agent runs but logs are missing
Original experiment, executed September 9, 2026: We ran Datadog Agent 7.83.1 in a temporary foreground process on macOS with a test file and a loopback HTTP receiver. No system service was installed. The Agent ran as the local test user; intake traffic was directed to a local receiver, and no Datadog cloud delivery or search result was tested.
The fixture introduced two faults in sequence: log collection was disabled, and the test file was unreadable. After enabling collection and restoring file access, we appended a unique new line and observed it at the local receiver. Paths in the snippets below are shortened for readability; these are relevant configuration fragments, not the complete isolation configuration.
The source definition was present throughout:
# conf.d/prachub.d/conf.yaml
logs:
  - type: file
    path: /tmp/prachub-log-lab/application.log
    service: prachub-lab
    source: custom
The initial main configuration included:
# datadog.yaml
logs_enabled: false
Official behavior: Host log collection must be enabled and a source configured; consult Datadog’s host log collection instructions for your installation. A source file existing on disk does not, by itself, mean the logs subsystem is running.
Check the subsystem, not just the process
In the first stage, the process remained alive. The relevant status section said:
Logs Agent is not running
Yet configcheck displayed the file source, service, source label, and configuration location. That combination matters: loaded configuration and active collection are separate claims.
Use the Agent commands documentation to find the command form for your platform. In the temporary test layout, commands used the extracted executable and an explicit configuration directory:
/path/to/agent status -c /path/to/lab-config
/path/to/agent configcheck -c /path/to/lab-config
configcheck inspects the running Agent’s loaded configuration; do not describe it as merely a standalone YAML syntax check. Compare its reported configuration source and file path with the file you intended to edit. A correct-looking file elsewhere is irrelevant if the running process did not load it.
Enable collection, then inspect the remaining failure
We changed the global setting to logs_enabled: true and restarted the temporary process. The source then reported an error. The following is an abbreviated, path-normalized excerpt:
Type: file
Service: prachub-lab
Source: custom
Status: Error: open /tmp/prachub-log-lab/application.log: permission denied
Bytes Read: 0
The first fix had exposed the next failure. It had not resolved the original missing-log symptom.
In this controlled fixture, the file owner was the test user and its mode was deliberately 000. Restoring owner read access addressed that specific problem. In a real installation, first identify the Agent process’s effective user and groups, then examine the file and its parent directories. A successful read from your own shell does not prove the service account can read it.
Datadog’s log collection troubleshooting guide covers permission checks. Distinguish file read permission from directory traversal permission, and account for platform-specific access controls. Avoid a blanket world-writable permission change: it obscures the intended access model and may introduce another problem.
Wait for the source, then generate fresh evidence
Our first verification attempt wrote the marker before the tailer was ready. The Agent later opened the file at its end, so that attempt produced no received marker. We corrected the test sequence by allowing startup and source initialization before appending a new line.
That observation is specific to this run, not a promise about every Agent restart or saved offset. It illustrates why an old line already sitting in a file is weak recovery evidence.
Once the source was ready and readable, we appended:
PRACHUB_LOG_PROBE fresh-line-001
The line had a newline terminator. The post-probe status showed:
LogsProcessed: 1
LogsSent: 1
Status: OK
The local receiver independently captured a payload containing the exact marker, service: prachub-lab, and ddsource: custom. These are measured local results. They do not prove authentication, ingestion, indexing, retention, or visibility in a Datadog account.
Turn observations into a useful conversation
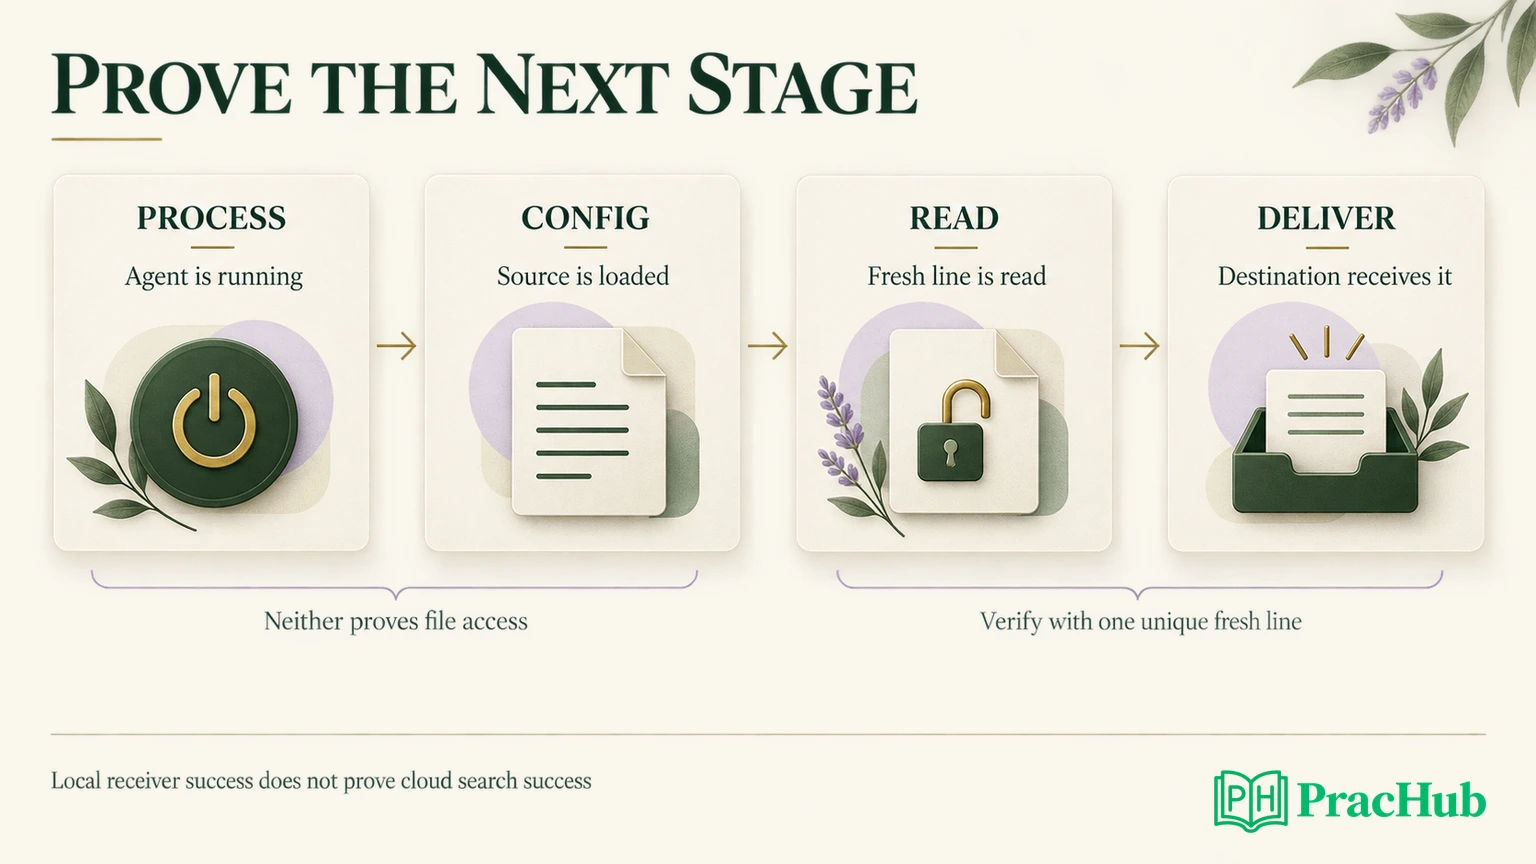
The distinction between stages is the point of the exercise. Keep a short record of observations and the next check each one supports.
| Observation | Supported conclusion | Next discriminating check |
|---|---|---|
| Agent process is alive | The process has not exited | Inspect the Logs Agent section and relevant source |
configcheck lists the file | That source configuration was loaded | Confirm collection is enabled and inspect source status |
| Source reports permission denied | Opening that path failed on access | Compare runtime credentials, file access, and parent traversal |
| Source becomes ready | The earlier source error is absent | Append a unique fresh line after initialization |
| Local receiver contains the marker | This local read-and-forward path worked | In a real account, verify the same event at the intended viewing surface |
A concise exchange after the permission error might sound like this:
The source is loaded, and collection is now enabled. The current blocker is an access error on the configured file. I’ll inspect the runtime identity and path permissions before changing anything. After a targeted correction, I’ll generate a new marker and verify where it arrives.
If your partner suggests a restart, acknowledge the proposal and explain what it would test. A restart is appropriate when required to apply the configuration change, but repeated restarts do not explain a persistent access error. Capture the relevant evidence first so another engineer can understand the change.
Verify recovery at the customer’s actual destination
In a real account, define success before modifying the system. Use an approved, non-sensitive marker in the affected application’s normal output path. Record its timestamp and expected host, service, and source. Confirm the application wrote it, the Agent read it, and the intended Datadog view shows the corresponding event.
If local reading succeeds but outbound delivery fails, investigate the relevant endpoint, site, credentials, proxy, connectivity, and Agent errors. Consult the Agent troubleshooting documentation for the installation. Do not jump directly from “not in search” to “network outage.”
If the event reaches Live Tail but is absent from the customer’s expected search results, inspect the viewing context, time range, filters, and applicable indexing or exclusion configuration. This is a different investigation from a file-open failure. The log collection troubleshooting guide describes this distinction; our local receiver experiment did not execute those cloud-side checks.
Also consider durability. Will log rotation create a replacement file with different ownership? Does the approved access change survive the application’s next deployment? A one-time marker confirms the tested path at that moment; it does not establish that a recurring configuration problem cannot return.
Share diagnostic evidence without overclaiming
A useful technical handoff includes the Agent version, affected source, relevant timestamps, loaded configuration location, abbreviated status error, runtime identity findings, the exact change, and marker verification. Separate unrelated disabled components from the source under investigation so a long status dump does not bury the useful evidence.
Datadog’s flare documentation explains how to gather diagnostic material and review it before sending. Known sensitive fields receive redaction, but do not assume every customer-specific value or log message is safe to share. Inspect the bundle and follow the customer’s approved support process. This exercise did not upload a flare.
A customer update should state the verified boundary:
We found that log collection was disabled and the configured file was inaccessible to the test process. After correcting those settings, a new marker reached the local receiver. Cloud-side visibility has not been tested; confirming the same event in the intended account view is the remaining verification step.
For behavioral preparation, use a real occasion when you clarified an ambiguous issue, revised a diagnosis, or made a technical explanation more concise. Explain your own actions and measured outcome. Do not present this practice fixture as your employment experience.
Practice five adjacent skills
These questions span companies and roles. They are deliberate practice selections, not evidence that Datadog uses them in a Technical Support Engineer round. The coding exercise below is useful for understanding log-matching rules, not as a replacement for troubleshooting practice.
| PracHub question | Focus for this interview preparation |
|---|---|
| Explain Linux Command Execution, Filesystems, and Isolation | Explain why runtime credentials and directory traversal matter to opening a file. |
| Troubleshoot a Host That Rejects SSH Connections | Separate reachability, service state, and authentication evidence. |
| How to triage slow service alerts | Establish impact and a useful next check before choosing mitigation. |
| Describe handling conciseness feedback | Practice a real example of making explanations easier to act on. |
| Match logs to prior queries | State exact matching rules and explain why a received log might not satisfy a query. |
Continue with Datadog interview questions on PracHub. In your next mock, have your partner reveal evidence one stage at a time. Finish only when you can distinguish the diagnosis, the change, the observed recovery, and the remaining uncertainty.
Sources and Further Reading
- Datadog Technical Solutions: official team and support context
- Datadog candidate experience: role-dependent hiring process
- January 2026 Reddit discussion: upcoming pair round, with evidence limitations
- Glassdoor individual pair troubleshooting entry: cycle not verified
- Datadog host log collection
- Datadog Agent commands
- Datadog log collection troubleshooting
- Datadog Agent troubleshooting
- Datadog diagnostic flares
Comments (0)