DevOpsInterview.Cloud Review: Incident Labs, Evidence Timelines, and Free Access
Quick Overview
Assess DevOpsInterview.Cloud’s free token-cost simulation through its public evidence exhibits and bounded interactions. Includes an original cost ledger, hypothesis matrix and postmortem checklist.
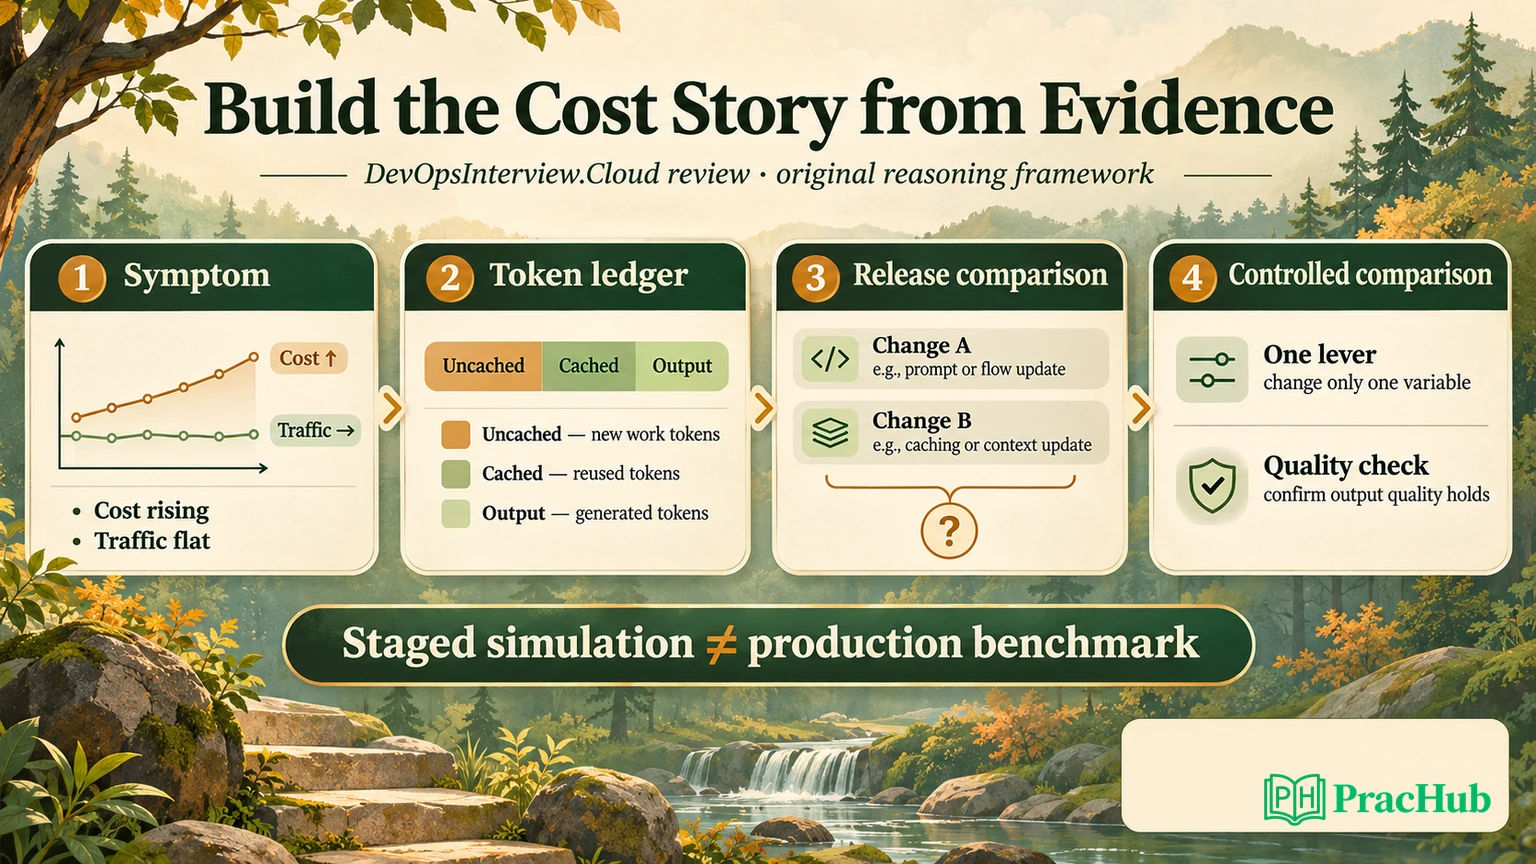
DevOpsInterview.Cloud’s free token-cost lab is useful for rehearsing how to connect symptoms, usage data and a release change into a defensible incident explanation. The inspected interface is an ungraded educational simulation with a deterministic model and static prices. Use its reasoning structure to practise an explanation while keeping the simulated result separate from real incident experience.
PracHub publishes this review and owns the complementary practice links. Our LLM observability design question offers another place to choose evidence for a cost investigation. The token ledger and hypothesis matrix below are original examples, separate from the lab’s scenario, prices and results.
What the free lab actually gives access to
Direct observation, November 3, 2026: the labs directory linked a free token-cost incident, which opened without an account, email submission, cloud subscription or local installation. The directory also linked an ebook; we did not purchase or review that material.
The incident interface explicitly described an educational simulation, stated that it was ungraded and identified a deterministic model with a static price card. We inspected the early phases and selected evidence details. We did not complete the later hypothesis, experiment, optimization, validation or final postmortem stages.
This boundary matters when reading the dashboard. A simulated daily cost, cache rate or latency is a value produced by the exercise. It is not a measurement of our infrastructure or a current provider benchmark. A control labeled as an experiment does not by itself establish that a real API request or cloud command ran.
Our assessment: use the lab to practise explaining why an observation supports one conclusion but leaves another open. Pair that with independent technical work when you need to demonstrate production instrumentation or provider-specific behavior.
The evidence details separate observation from proof
We reached the evidence room and opened three of its six exhibits: usage, a release difference and workload telemetry. Each detail separated the observation, its relevance and its limits. The release view expressly distinguished timing alignment from proof of which change caused the cost increase.
The interface also exposed requirements before proceeding, including a required usage exhibit, a minimum number of inspected sources and field questions. We did not answer those questions or complete the next phase. An inspected-source count therefore should not be mistaken for an assessment of our diagnosis.
That structure gives a learner a useful habit to carry elsewhere. A usage chart can identify which billed class changed. A deployment difference can identify candidate mechanisms. A workload view can challenge a volume hypothesis. None needs to carry the whole causal argument alone.
In a real incident, add the provenance missing from a staged example: where the data came from, its window, collection delays and exclusions. Check whether the graph includes failed requests, retries and tenants following different paths. The first question is whether the evidence measures the population you are discussing.
What the small prefix interaction established
In the system primer, we checked the visible timestamp option. The micro-demo changed from a cache hit at $0.0050 to a miss at $0.0500, then returned when we unchecked it. This verifies that interaction within the displayed model. It does not measure an actual provider cache or establish a universal tenfold cost change.
Real caching has provider-specific eligibility, accounting and configuration. For example, Anthropic’s prompt-caching documentation distinguishes cache creation and cache-read usage. Map actual API fields and current pricing rules before applying an exercise’s simplified model to a bill.
We also used the public playback controls, paused the simulation and reached the evidence room after its observation requirement was satisfied. This was simulated time, not days of production observation. We skipped the introductory canvas walkthrough using its visible Skip control, so we do not claim to have completed every tutorial element.
The later optimization and quality-validation stages remained untested. Their presence in the navigation is a feature description, not a result we observed. Keep that distinction if you compare this lab with a running terminal environment or a human-led incident interview.
Original ledger: flat requests can still cost more
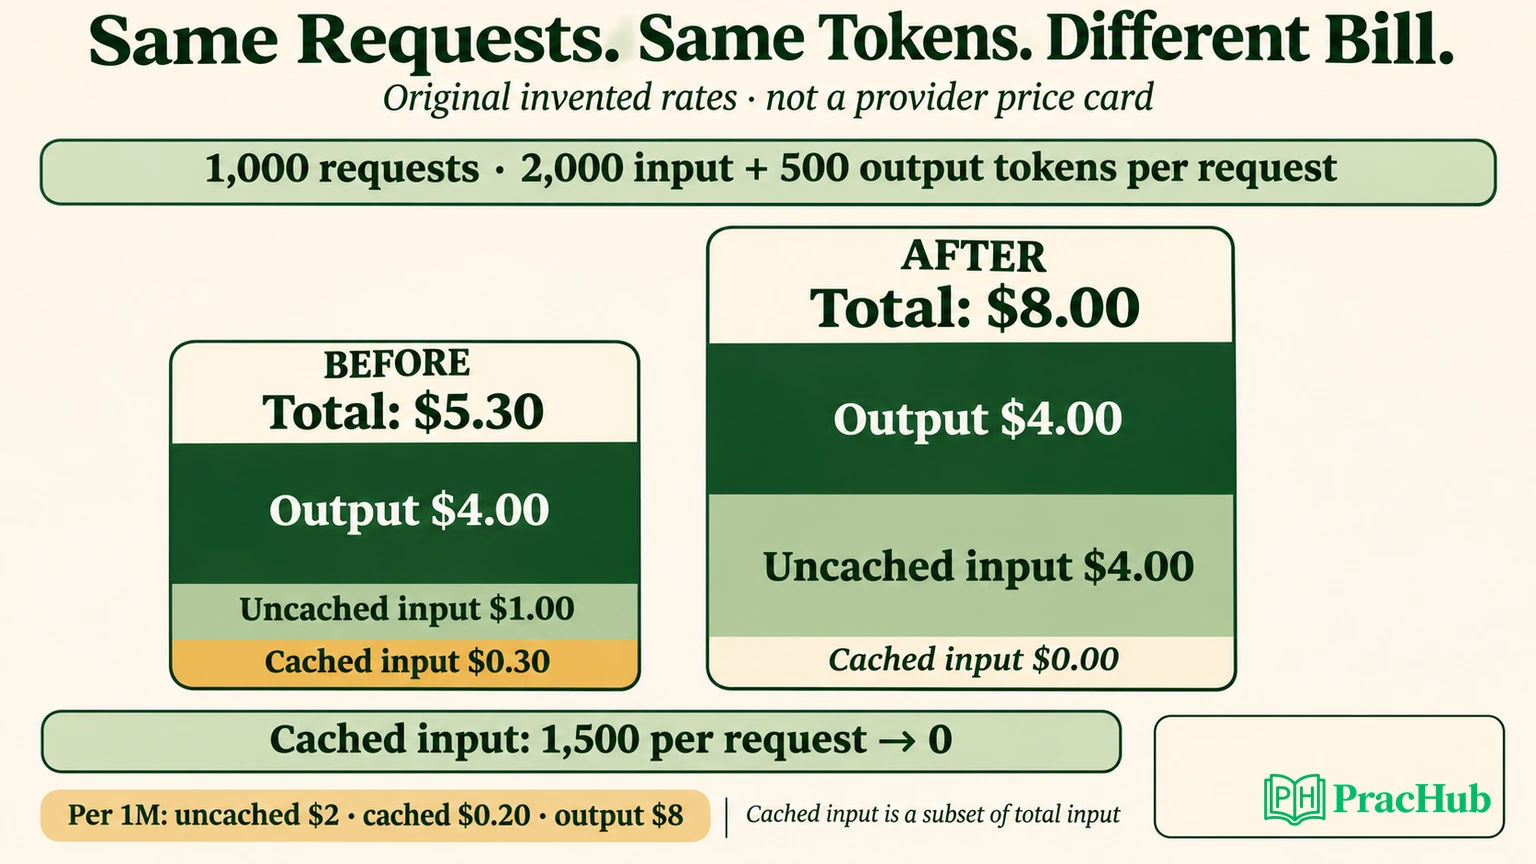
Here is an independent arithmetic case with invented prices. Both windows contain 1,000 requests. Each request has 2,000 total input tokens and 500 output tokens. Initially, 1,500 input tokens per request receive a cache-read discount; afterward, none do.
Our invented rates per million tokens are $2 for uncached input, $0.20 for cached input and $8 for output. We assume no separate cache-write charge, tax, minimum or other discount. These are neither the lab’s price card nor current rates for a named model.
Cached tokens are a subset of total input in this example. Subtract them before pricing the uncached portion:
uncached input = total input − cached input
cost = uncached input × uncached rate
     + cached input × cached rate
     + output × output rate
All rates must use the same quantity unit. With prices per million tokens, divide the token counts by one million before multiplying.
| Original cost component | Before | After |
|---|---|---|
| Uncached input | 0.5M tokens → $1.00 | 2.0M tokens → $4.00 |
| Cached input | 1.5M tokens → $0.30 | 0 tokens → $0.00 |
| Output | 0.5M tokens → $4.00 | 0.5M tokens → $4.00 |
| Total | $5.30 | $8.00 |
Cost rises by $2.70 with the request count and total token counts unchanged. What changes is the input billing class. The arithmetic demonstrates a possible mechanism, not the cause of an unseen production incident.
Our local exact-fraction fixture checked both totals, their difference and the input partition. It also checked the double-counting error: charging all input at full price and adding cached input again produces $8.30 for the initial window, which is wrong under our definition. An impossible cached count larger than total input was rejected.
That definition is important because real usage fields may not use “input” the same way. Some separate uncached, cache-creation and cache-read quantities. Read the schema before summing them. An apparently plausible total can be wrong because the ledger counts one class twice or omits another charge.
A hypothesis matrix that does not assume the answer
Flat user traffic leaves several cost mechanisms open. The number of model attempts per user operation may change, conversation lengths may shift or billing categories may move. Start with a set of alternatives and identify the observation that would distinguish them.
This original matrix is a preparation aid, not the lab’s answer key:
| Hypothesis | Evidence to compare | What a flat request graph cannot establish |
|---|---|---|
| More attempts per user operation | User operations, API attempts and retry identifiers | Whether the graph counts users or billable attempts |
| More input per attempt | Input distributions by route, session and turn | Whether a stable average hides a changed tail |
| Lost cache discount | Token classes and provider usage semantics | Whether caching was eligible or actually applied |
| More output | Output distribution and completion behavior | Whether a configured cap changed actual generation |
| Different unit price or model | Rate and model identifiers over the same window | Whether the billed unit stayed constant |
The release timeline can help prioritize these hypotheses. It does not isolate a cause if several changes shipped together. State what the change predicts, then seek the corresponding signal. A changed output limit, for example, is not proof that every response became longer.
For the invented ledger, a controlled comparison holds request count, total input, output and prices fixed while changing only the cached share. That isolates the arithmetic effect under our assumptions. A real experiment must also account for workload variation and other changes that the small fixture does not model.
Lower cost needs a quality and recovery check
A cheap response that fails the task can be worse than the original expensive one. Before changing context or output limits, define the task behavior that must remain acceptable. Then compare quality and latency alongside the cost unit, rather than checking only whether a total fell.
The FinOps Foundation’s unit-economics guidance connects technology costs to meaningful units and business outcomes. For an interview, explain why your chosen denominator represents useful work. Cost per request and cost per successful task can move in different directions.
Define what your recovery statement actually establishes. “Cost fell” is an observation. “The change recovered the budget without harming the task” needs both the cost comparison and evidence of preserved behavior. If you have only a small test set, preserve that limitation instead of turning it into a broad reliability guarantee.
Keep a postmortem evidence packet outside the interface
We checked one practical recovery boundary in the product itself. After opening three exhibits, an ordinary refresh returned the page to Briefing and stayed there after loading settled. We did not establish a way to resume that partial run. The directory’s statement that progress stays in the browser should not be treated as a verified promise of recovery across refreshes or devices.
Keep your own short record while practising. For this cost scenario, it should preserve:
- The symptom and the exact workload window being compared.
- The token quantities, unit prices and definitions used in the ledger.
- Each candidate explanation and the observation that challenges it.
- The variable changed during a comparison and what remained fixed.
- The cost, task-quality and latency checks supporting recovery.
- Remaining uncertainty, follow-up ownership and a recurrence signal.
These are our suggested postmortem contents. We did not generate or audit the lab’s final document. A saved explanation should make its evidence understandable to someone who did not watch the simulation.
For practice with a partner, present the symptom and one exhibit at a time. Ask for the next observation before revealing another. Ask your partner to connect each requested observation to a hypothesis before revealing more evidence.
Practice the gaps the product leaves open
These PracHub prompts extend the lab’s cost-attribution theme into telemetry, evaluation and workflow design. They are independent questions, not exports of its simulated incident or a certification of completion.
| PracHub question | What to examine |
|---|---|
| Optimize Object-Backed APIs and Design an LLM Observability Platform | Choose telemetry that distinguishes request volume from token and billing-class changes. |
| How Context Window Length Shapes LLM Quality, Cost and Latency | Explain how a longer context changes cost and latency without assuming a fixed token count. |
| Measuring answer quality, latency and cost for a RAG-based LLM product | Keep answer quality and latency beside the cost metric during an intervention. |
| Control LLM Workflow Quotas and Recovery Costs | Account for retries, quotas and recovery work rather than counting only user requests. |
| Design an Evaluation Platform for AI Agents Across Prompt and Model Changes | Define a comparison that can detect regressions across prompt or model changes. |
Who should use this lab next
Consider DevOpsInterview.Cloud if you want a low-setup, ungraded exercise in incident explanation. Its inspected evidence details make useful distinctions between observation, relevance and proof. We did not validate production realism, later-stage feedback, long-term progress recovery or hiring outcomes.
Start with the LLM observability design question, build the independent ledger and choose one hypothesis to challenge with evidence. Then use the lab to practise stating what an exhibit leaves unresolved. Keep the final claim as narrow as the comparison that supports it.
Comments (0)