Netflix Analytics Engineer Interview: SQL, Content Metrics, and Data Modeling
Quick Overview
Prepare for Netflix Analytics Engineer interviews through SQL correctness, content metrics, and data modeling. Separate official role evidence from candidate reports, then work through tested playback examples that distinguish views, audience reach, and completion.
For a Netflix Analytics Engineer interview, prepare to explain what a content metric means before defending the SQL that calculates it. A title can generate more runtime-normalized views while reaching fewer profiles. A repeated playback heartbeat can inflate viewing time. A genre join can double a correct aggregate. Each problem tests whether your analysis remains trustworthy when someone changes the assumptions.
This guide focuses on content-oriented AE preparation. Official role facts, candidate reports, and original exercises are separated throughout. The practice destinations in PracHub's Netflix question collection cover adjacent data and engineering roles; they are not presented as a verified Netflix AE interview syllabus.
What Does the Official Content AE Role Emphasize?
Official role evidence: Netflix's Analytics Engineer 4, Content Data Science & Engineering posting, requisition JR42019, describes content-performance analyses, metrics, reports, dashboards, custom tools, and partnership with a content vertical. The Los Angeles/Los Gatos role asks for Python and SQL, experience with data pipelines and workflows, analytical techniques, and communication with technical and non-technical partners. It is broader than maintaining transformation models alone. Netflix AE4 Content DSE posting
Historical official context: A December 2020 Netflix TechBlog profile describes a Studio DSE Analytics Engineer splitting work among stakeholder conversations, SQL/Python, visual outputs, and planning. It illustrates one employee's role at that time, not a current hiring rubric. Mythbusting the Analytics Journey
Preparation inference: Build an answer that connects a reliable dataset to a content decision. Be ready to explain the analysis, not only the pipeline. A useful project story includes a disputed definition, the model you built, a quality failure you caught, and how the result changed a partner's next step.
Content performance is the focus of the cited vacancy, but Netflix has different teams and levels. Confirm the scope of your own opening before turning a generic AE checklist into your preparation plan.
What Can Candidate Reports Tell You About the Screen?
Candidate report: A March 10, 2026 post labeled San Francisco, USA describes four SQL questions and two Python questions in 50 minutes on HackerRank. The writer mentions CTEs, window functions, LAG, pandas, and dictionaries. Those are the author's account of one technical interview, not an official Netflix format. The post does not establish that it was for the Content DSE vacancy above. March 2026 AE technical-screen report
We did not verify two detailed, independent reports from the same hiring cycle that establish a standard AE loop. A brief “same experience” comment does not supply that missing detail. This article therefore offers role-specific preparation rather than a fixed round-by-round prediction.
Preparation inference: Practice SQL and Python under time pressure, but ask your recruiter for the actual duration, language expectations, platform, and later-round topics. Rehearse short explanations of assumptions and edge cases while you code. Do not infer a pass threshold or rejection reason from one person's result.
Distinguish Views, Reach, and Completion
Official metric fact: Netflix's January 2026 announcement for its second-half 2025 Engagement Report defines views as total hours viewed divided by runtime. That arithmetic normalizes viewing by content length. Netflix Engagement Report announcement
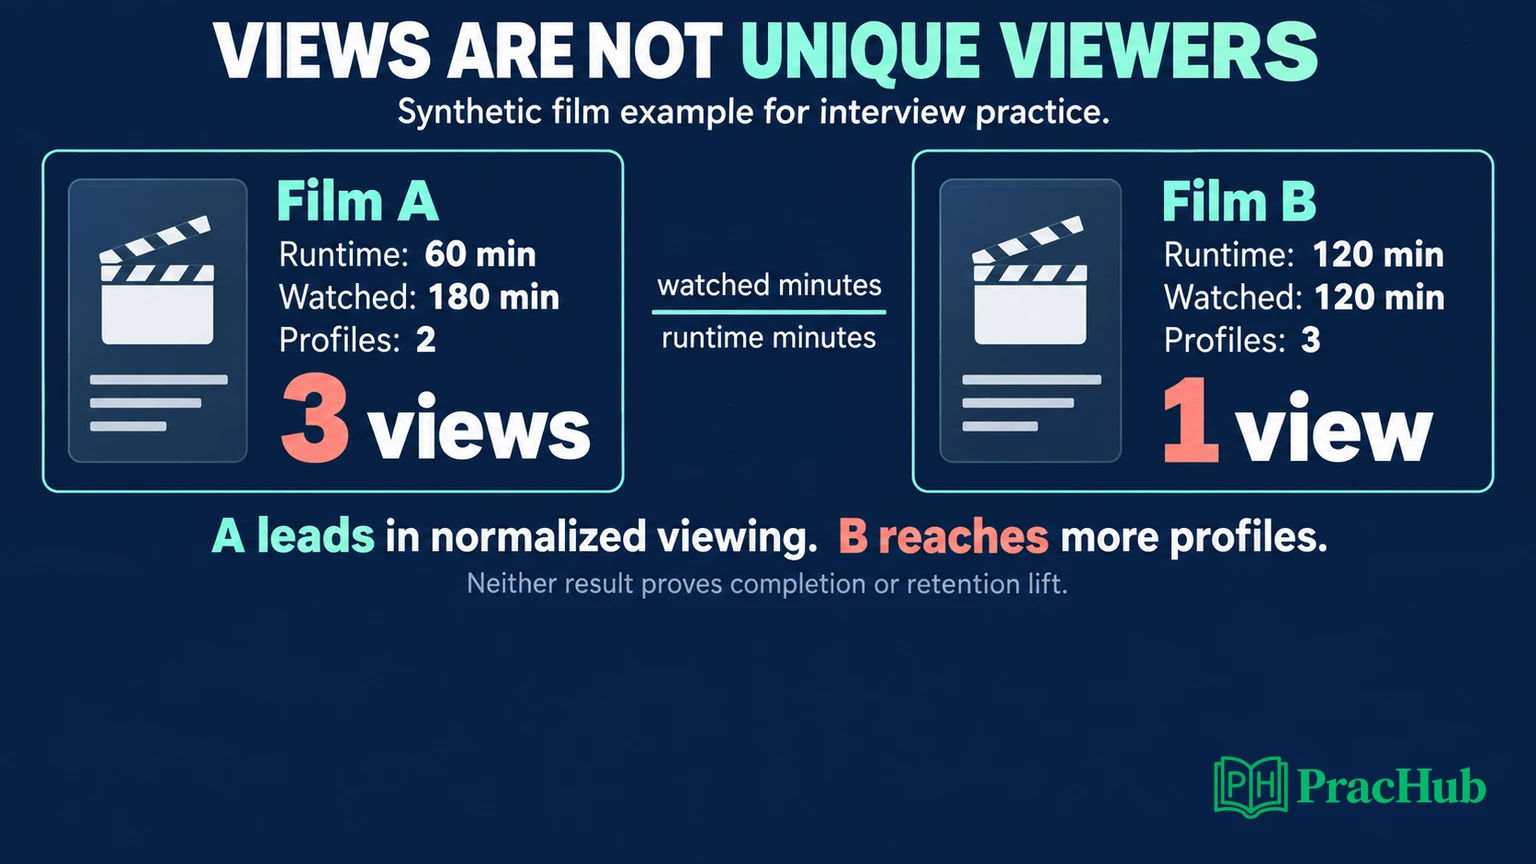
Original exercise: Imagine two films in one reporting window. Film A is 60 minutes long and accumulates 180 watched minutes across two profiles. Film B is 120 minutes long and accumulates 120 watched minutes across three profiles. These are synthetic values, not Netflix title-performance data.
A has three runtime-normalized views; B has one. Yet B reaches more distinct profiles in the fixture. Neither result tells you how many individual people watched or how many completed the film. Profiles are the identifiers available in this exercise, and repeated viewing contributes to watched time.
An interviewer might ask, “Which film performed better?” First clarify the decision. Are we comparing depth of consumption, audience reach, completion among starters, or incremental member value? Choosing a metric silently chooses a question.
For a completion measure, define a separate rule: qualifying start, viewing threshold, observation window, and identity. Playback position alone can be misleading when someone seeks forward; total watched time can include rewatching the same scenes. Our exercise does not calculate completion, and dividing watched time by runtime does not convert it into a completion rate.
Turn Playback Heartbeats Into Correct SQL
Original data contract: A session belongs to one profile and one film. Heartbeats report cumulative active-watch minutes within that session, not incremental minutes and not the player's current position. Counters are nonnegative and monotonic; a reset starts a new session. All fixture sessions finish within one reporting window, with their final counters available.
The tables are:
titles(title_id, runtime_minutes): one row per film.sessions(session_id, profile_id, title_id): one row per playback session.playback_heartbeats(heartbeat_id, session_id, cumulative_minutes): multiple updates per session.
For Film A, profile P1 watches two 60-minute sessions and P2 watches one. One session emits counters of 30, 60, and a repeated 60. Its contribution is 60 minutes, not 150. Film B has three profiles watching 60, 30, and 30 minutes respectively.
We executed this SQL using SQLite 3.51.0. The input tables are already restricted to the complete-session window described above; this is not a general query for arbitrary daily slices of production playback logs.
WITH session_totals AS (
  SELECT session_id,
         MAX(cumulative_minutes) AS watched_minutes
  FROM playback_heartbeats
  GROUP BY session_id
), title_totals AS (
  SELECT s.title_id,
         SUM(t.watched_minutes) AS watched_minutes,
         COUNT(DISTINCT CASE WHEN t.watched_minutes > 0
                             THEN s.profile_id END)
           AS watching_profiles
  FROM sessions s
  JOIN session_totals t USING (session_id)
  GROUP BY s.title_id
)
SELECT c.title_id,
       COALESCE(t.watched_minutes, 0) AS watched_minutes,
       COALESCE(t.watching_profiles, 0) AS watching_profiles,
       ROUND(1.0 * COALESCE(t.watched_minutes, 0)
             / NULLIF(c.runtime_minutes, 0), 2)
         AS runtime_normalized_views
FROM titles c
LEFT JOIN title_totals t USING (title_id)
ORDER BY c.title_id;
Observed results: A returns 180 minutes, two profiles, and 3.0 views. B returns 120 minutes, three profiles, and 1.0 view. A third film with a valid runtime and no sessions returns zeros, because the catalog remains on the left side of the join.
The deliberately incorrect sum of A's raw heartbeat counters returns 270 minutes. Adding another repeated heartbeat leaves the correct result unchanged. Adding a genuine new 60-minute rewatch increases A to 240 minutes and 4.0 views, while its distinct profile count remains two. These assertions were checked in the local fixture.
Explain Where the Query's Assumptions Break
Preparation inference: Practice answering “When would this query be wrong?” before shortening it.
If a session crosses midnight, selecting heartbeats from only the second day and taking the maximum includes viewing accumulated before midnight. You need a rule for attributing intervals or counter deltas to the reporting window, including the baseline before its start. A session that spans a cutoff cannot be treated like our fully contained fixture.
If counters reset without a new session ID, MAX hides the reset. If the final update is missing, the result can undercount. Ask whether ingestion preserves reset markers, event sequence, and completeness signals before proposing a correction. Do not “fix” all values above runtime by clipping them: genuine rewatching may be valid consumption.
The fixture also checks zero runtime. The query returns null for normalized views rather than dividing by zero. That is a data-quality condition to investigate, not a content-performance score. Similarly, absence of observed sessions should only be interpreted as zero viewing when the input's completeness is established.
Review the Content Model Before Adding Dimensions
Original model review: Keep the session fact separate from content metadata and multi-valued classifications. The SQL uses a single runtime row per film. It does not require a join to every genre a title belongs to.
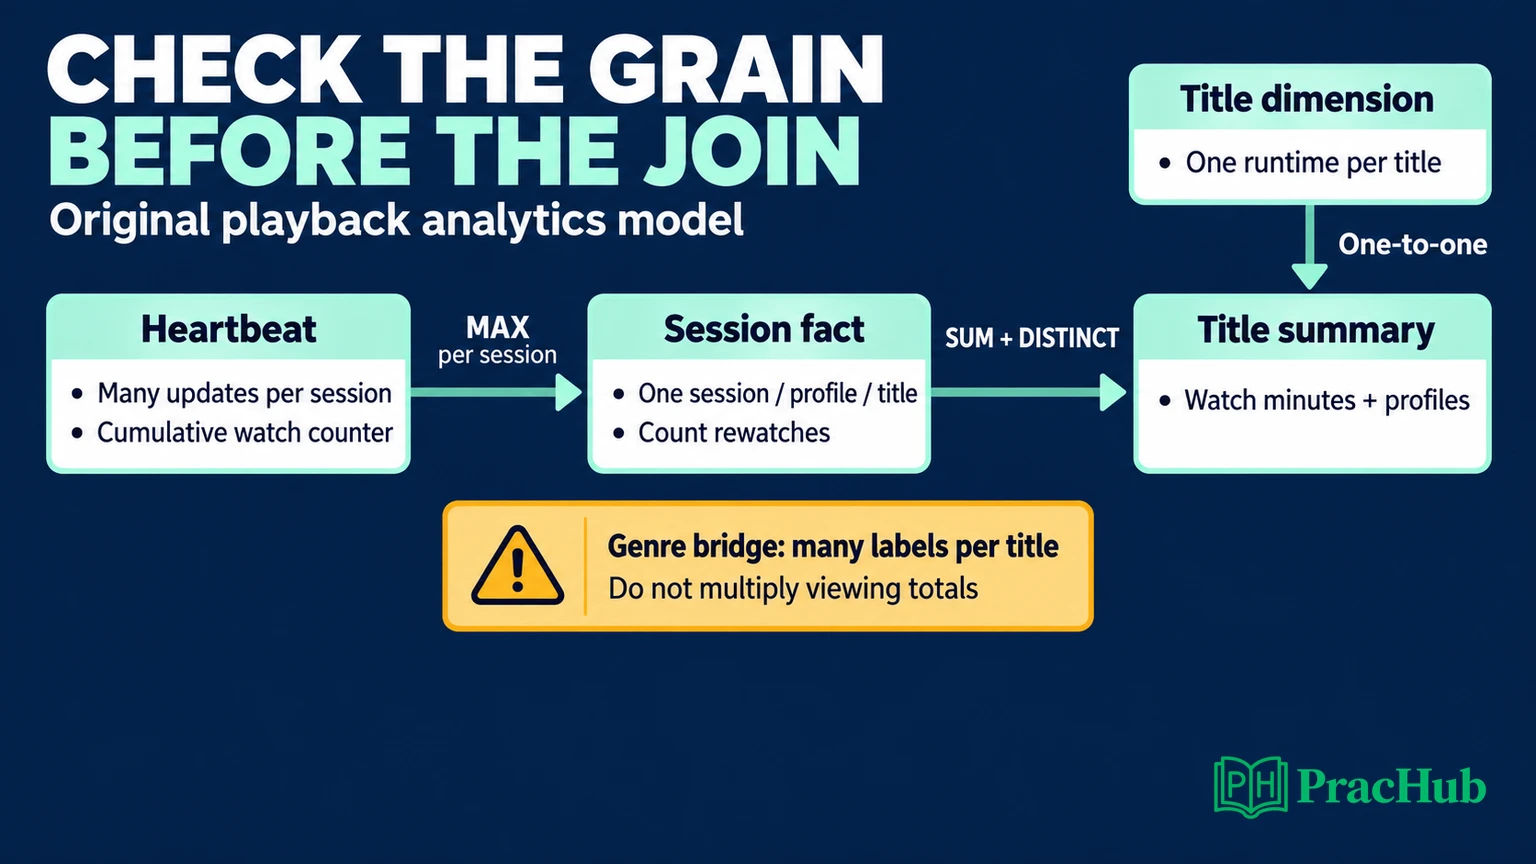
We gave Film A two genre labels and deliberately joined both labels to its session totals. Summing afterward produces 360 minutes, double the correct value. The duplication comes from the join relationship, not from the playback counter calculation.
If the question asks for viewing associated with each genre, full attribution to each label may be intentional. But those genre totals are then overlapping and should not be summed into a platform total. If the business needs additive allocation, agree on weights or a single classification rule and document what the resulting metric means.
Distinct profiles are also non-additive. A has two and B has three, but their combined audience in our fixture contains only three distinct profiles because P1 and P2 watched both. Summing the per-title counts yields five and overstates the combined reach. Retain the identity-level data needed for an exact union, or explicitly discuss an approximation with the required accuracy.
For series, introduce episode, season, and series identifiers deliberately. Episode runtime and season runtime are different denominators. Ask which content unit the output represents and which release cohort or availability window applies. Do not average episode-level percentages and call the result a season completion rate without specifying the weighting and cohort.
Connect Content Metrics to a Business Recommendation
Original case: A content partner asks whether Film A deserves more promotion because it has more normalized views than Film B. Start with the observed difference: A has more viewing relative to runtime; B reaches more profiles in this small dataset. That is descriptive evidence, not a promotion recommendation by itself.
Next, ask what “more promotion” means and what outcome matters. A homepage placement decision could require information about exposure, eligible audience, country availability, launch age, acquisition source, and downstream behavior. Comparing titles with different opportunities to be seen can confuse distribution with audience preference.
Propose a compact analysis: compare titles over comparable availability windows, segment reach and depth, inspect instrumentation coverage, and state which uncertainty changes the decision. If you need to establish incremental impact, explain an appropriate evaluation design rather than claiming that viewers' higher retention proves the title caused it. People who choose to watch a title may already differ from those who do not.
Your recommendation should include a limitation and a next action. For example: “A leads on runtime-normalized consumption in this window, but B reaches more profiles. I would compare exposure-adjusted segments and launch maturity before reallocating placement. These aggregates alone do not estimate incremental member value.”
That response fits the content-analysis responsibilities in the official role while keeping the inference separate from the evidence.
Before presenting, write a short decision memo with the metric definition, comparison window, result, limitation, and proposed action. Include an example that would reverse your recommendation. If Film B had far less promotional exposure, for instance, you would investigate its opportunity to be discovered before interpreting lower total viewing as weaker demand.
For the technical follow-up, explain how you would publish the analysis reproducibly: version the query and content mapping, retain the reporting cutoff, check join cardinalities, and reconcile the summary with a small set of underlying sessions. These are original preparation suggestions. They demonstrate that another analyst could inspect the result without relying on your memory of the calculation.
Practice the Skills With Netflix Questions
The following verified PracHub questions come from adjacent Netflix roles. The SQL, experimentation, and culture questions are labeled Data Scientist; the ads-platform model is Software Engineer. Their inclusion is a preparation recommendation, not a claim that they were asked in the AE screen above.
| PracHub question | Apply it to content analytics |
|---|---|
| Aggregate D1 retention cohorts in SQL | Define the cohort and observation window before joining activity. |
| Analyze Retention Metrics Using SQL and Python | Check identity grain, time boundaries, and equivalent transformations. |
| Model data for an ads platform | Explain one-to-many relationships and where joins multiply facts. |
| Design A/B Test for Streaming Feature Network Effects | Separate a descriptive content ranking from causal evaluation. |
| Highlight Netflix Culture Principle in Past Work Example | Show how you handled ambiguity, disagreement, and evidence. |
Use Netflix interview questions to continue practicing. Bring one content metric through its definition, SQL, model review, and recommendation. Be ready to change the answer when the identity, time window, or business decision changes.
Comments (0)