Pandas Interview Questions for Data Analysts: Joins, GroupBy, and Messy Data
Quick Overview
Worked Pandas interview exercises for data analysts: validate joins, compare GroupBy size and count, retain missing groups, and handle messy values.
A Pandas answer can run without errors and still double a business metric. For data analyst interviews, practice joins with explicit cardinality, GroupBy operations with clear denominators, and cleaning rules that preserve the difference between missing, malformed, and zero values. Start by explaining what one row represents; choose the method afterward.
This guide uses an original support-ticket exercise with expected results. Official facts come from Pandas documentation; candidate evidence is a limited, attributed account; the exercises and preparation advice are our own. The examples were checked locally with Pandas 2.2.3, while current documentation describes 3.0 behavior. Version-sensitive choices are explicit.
Use PracHub's Data Analyst questions alongside the exercises. The goal is to explain why a result is correct, including which records and measurements it excludes.
Begin with the grain, keys, and output
Grain means what a single row represents: a ticket, a customer, or a customer-day. A join can change that grain without announcing it. Before coding, name the input entities, expected key uniqueness, and required output. “One row per customer segment” is more useful than “I will use GroupBy.”
For this original exercise, each ticket ID is unique. Report ticket count, known handling-time count, and average known handling time by customer segment. Exclude open tickets, retain closed tickets with missing measurements, and keep unmatched customers visible. Minutes are nonnegative; IDs are strings.
import pandas as pd

tickets = pd.DataFrame({
    "ticket_id": [1, 2, 3, 4, 5, 6],
    "customer_id": ["01", "01", "02", "02", "99", "03"],
    "status": ["closed", " CLOSED ", "closed",
               "closed", "closed", "open"],
    "minutes_raw": ["10", "30", "5", "bad", "8", "12"],
})
customers = pd.DataFrame({
    "customer_id": ["01", "02", "03"],
    "segment": ["Enterprise", "Basic", "Basic"],
})
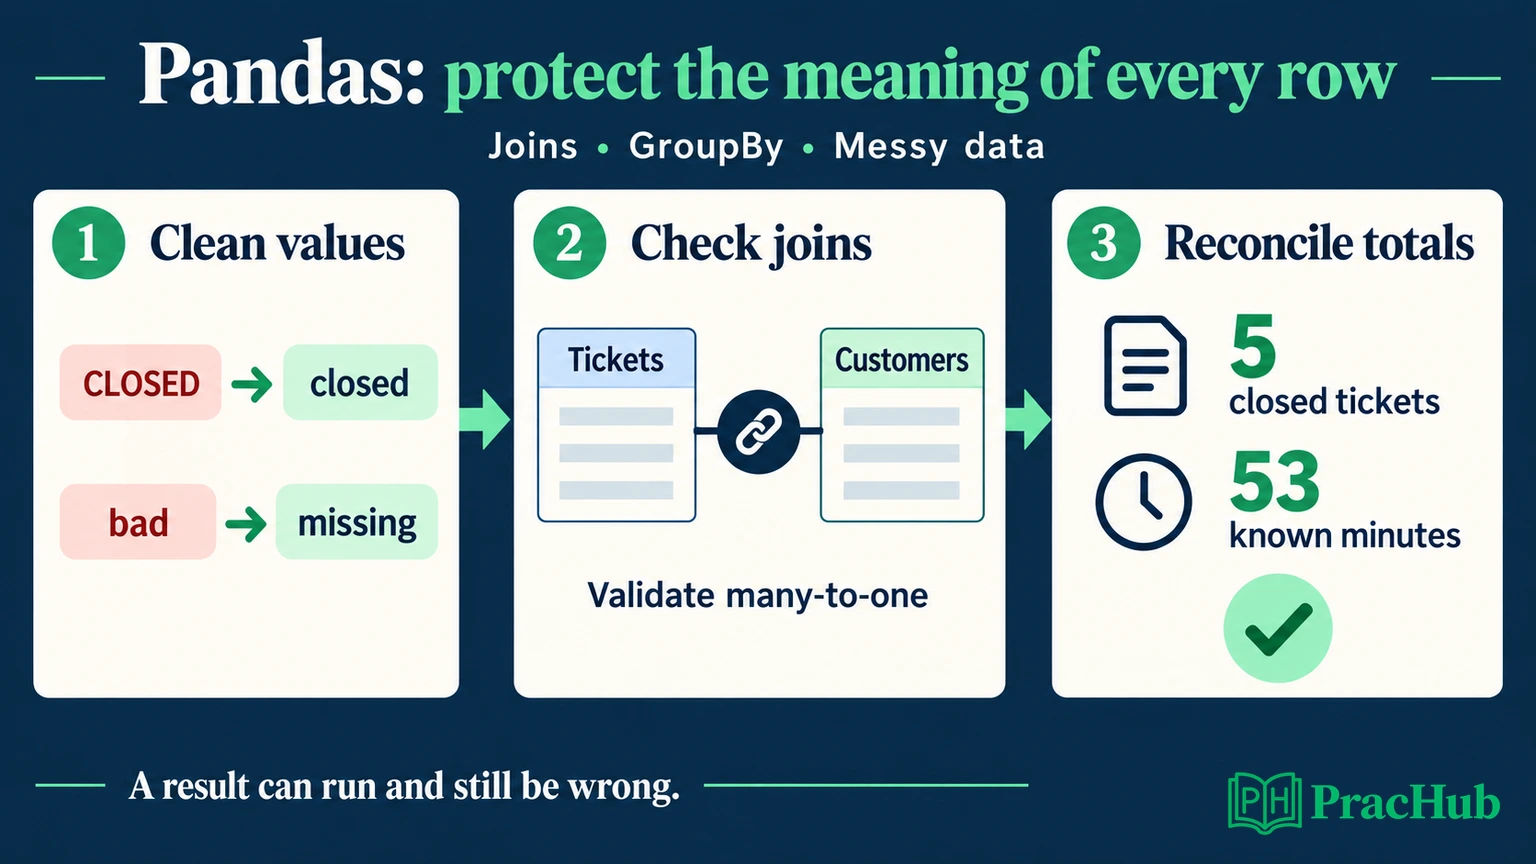
Predict the output before running anything. Five tickets survive the status filter. Enterprise has two known times totaling 40 minutes. Basic has two tickets but only one known time, five minutes. Customer 99 has eight minutes and no matching segment. Those facts become independent checks on the implementation.
Question 1: How would you clean inconsistent values?
Normalize only fields whose meaning permits it. Status labels can be stripped and lowercased here. Customer IDs must retain leading zeros. Converting every column to numbers or stripping every punctuation character would change information rather than clean it.
Official behavior: pd.to_numeric(..., errors="coerce") converts values it cannot parse into missing numeric values. It does not decide whether those records should be removed, corrected, or counted as zero. That policy belongs to the question. Numeric conversion documentation
clean = tickets.copy()
clean["status"] = clean["status"].str.strip().str.lower()
clean["minutes"] = pd.to_numeric(
    clean["minutes_raw"], errors="coerce"
)
clean["invalid_minutes"] = (
    clean["minutes_raw"].notna() & clean["minutes"].isna()
)
closed = clean.loc[clean["status"].eq("closed")].copy()
assert closed["ticket_id"].is_unique
assert closed["minutes"].dropna().ge(0).all()
Ticket 4 stays in the closed-ticket population, with a missing measurement and a parsing flag. Its handling time is unknown. Filling it with zero would claim the ticket took no time; dropping its row would undercount closed tickets. Explain both consequences before choosing either operation in another prompt.
The flag deliberately describes this fixture. In a CSV export, blank strings may represent legitimate missing values and should be normalized under an explicit rule before classifying parsing failures. Keep the original column until you can explain every rejected value. Also validate allowed status values: normalizing an unexpected label does not make it valid.
Question 2: Why did a left join increase the row count?
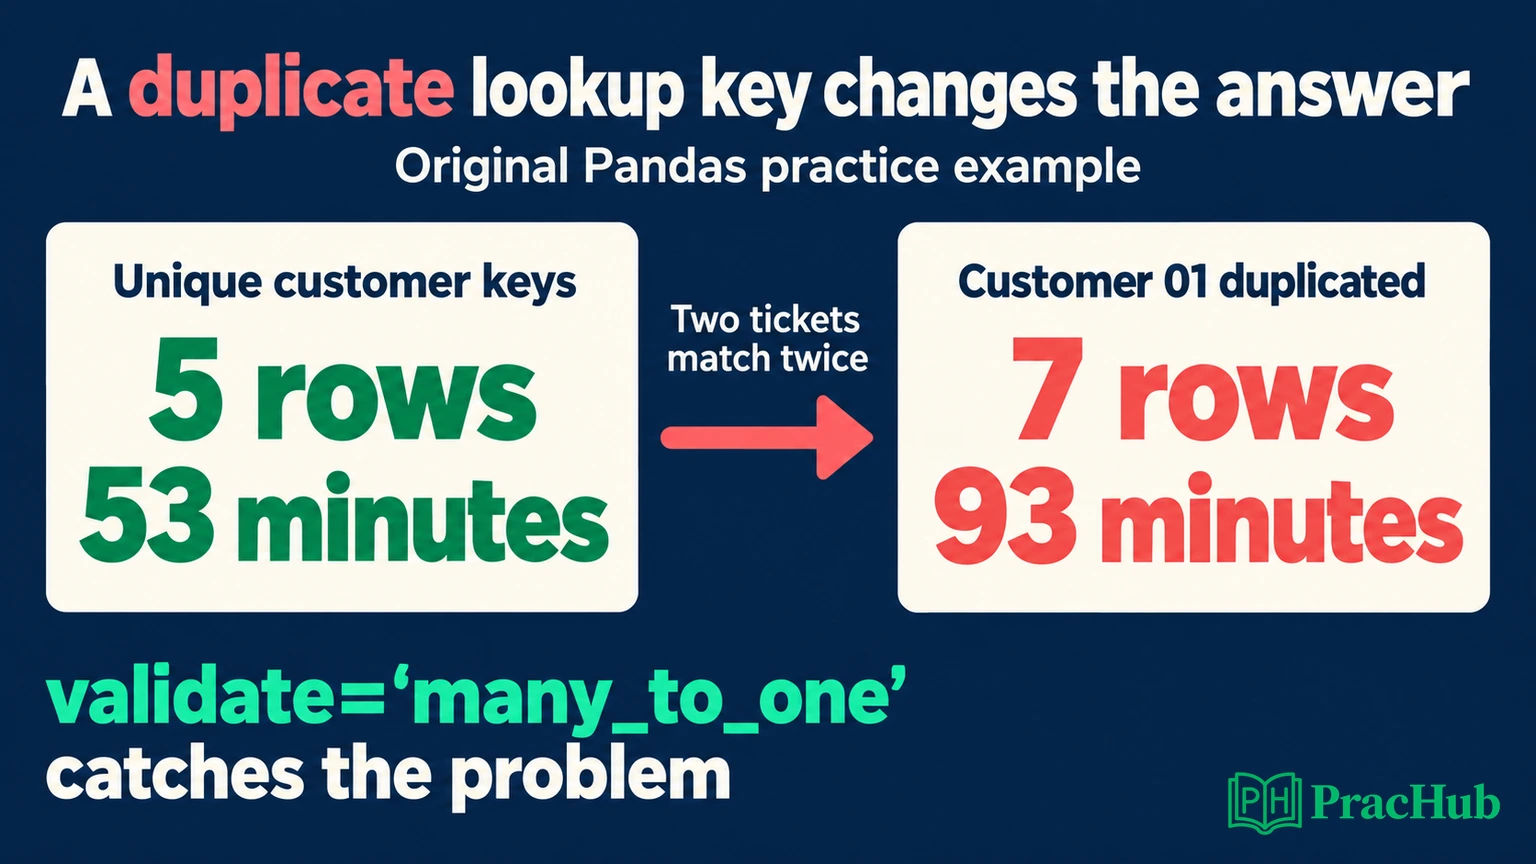
A left join preserves unmatched left records, but it does not guarantee one output row per left record. If customer 01 occurs twice in the lookup, each of its two tickets gets two matches. The five-ticket result becomes seven rows, and known minutes increase from 53 to 93.
Official behavior: Pandas supports validate="many_to_one" to require unique right-side keys and indicator=True to expose match status. These options make the intended relationship inspectable. Merge documentation
joined = closed.merge(
    customers,
    on="customer_id",
    how="left",
    validate="many_to_one",
    indicator=True,
)
assert len(joined) == len(closed)
assert joined["ticket_id"].is_unique
unmatched = joined.loc[
    joined["_merge"].eq("left_only"), "customer_id"
]
The unmatched list contains customer 99. Keep that diagnostic separate from missing segment values: a matched customer could itself have a missing segment. An indicator distinguishes failure to find a customer from incomplete customer metadata.
For an adversarial test, append another copy of customer 01 to the lookup. The validated merge should raise an error. Do not “repair” the failure by dropping duplicate joined rows blindly. First determine whether the lookup contains an accidental duplicate, historical customer versions, or genuinely multiple memberships. Each situation needs a different business rule.
Question 3: Should you aggregate before or after joining?
Choose the order from the requested entities. For ticket statistics by a stable, unique customer segment, enriching tickets through a many-to-one lookup and then aggregating is reasonable. If both tables contain repeated customer observations, joining their raw records can produce every matching pair.
Candidate report: A PracHub-curated LinkedIn Data Scientist account published in August 2026 describes a mistake involving aggregation before a join during a Python ratio question. It illustrates a grain error in one interview; it does not establish a universal LinkedIn process or an “always group first” rule. Read the account
Our preparation inference is to state the intended relationship aloud. If the task compares each customer's ticket count with their survey count, aggregate those separate event tables to customer level before joining. If it asks which specific ticket matches which survey, customer-level aggregation may destroy the information required to answer.
A useful follow-up is historical segmentation. “Current customer segment” and “segment when the ticket closed” are different metrics. The second needs effective dates and a time-aware matching rule. A uniqueness check on the current lookup cannot prove historical correctness.
Question 4: How do size, count, and mean differ?
Use the missing measurement to explain the denominator. Official behavior: GroupBy size counts rows, while count counts nonmissing values in the selected column. Group size, Nonmissing counts
summary = joined.groupby(
    "segment", dropna=False, observed=True
).agg(
    tickets=("ticket_id", "size"),
    measured=("minutes", "count"),
    mean_minutes=("minutes", "mean"),
).reset_index()
| Segment | Tickets | Measured | Mean known minutes |
|---|---|---|---|
| Basic | 2 | 1 | 5 |
| Enterprise | 2 | 2 | 20 |
| Missing segment | 1 | 1 | 8 |
“Missing segment” is an explanatory display label for the null group, not a value inserted into the code. Pandas' mean excludes missing measurements, so Basic's mean is five, not 2.5. Always state that this is average known handling time, and report measurement coverage with it.
A group whose times are all missing should not be presented as fast. Its mean is missing and its measured count is zero. If you additionally report totals, decide whether an all-missing group should produce a missing total using sum(min_count=1). A default-looking zero can otherwise hide complete absence of measurement.
Question 5: Where did the unmatched group go?
Official behavior: GroupBy defaults to dropping missing group keys. Setting dropna=False keeps the null group. For categorical keys, observed controls whether unobserved categories appear; its default changed to True in Pandas 3.0. Explicit arguments help make the intended output portable. GroupBy options
Here, omitting the null group reports only four tickets, even though the join retained five. That is why checking the merged row count alone is insufficient. Reconcile summary["tickets"].sum() with len(joined) and investigate any difference.
There is a second trap for SQL users. Pandas can match null join keys to each other, unlike ordinary SQL equality joins. If missing customer IDs are not valid identities, quarantine them or remove null keys from the lookup before merging. Decide this separately from keeping a missing segment in the final report.
Do not fill missing IDs with a shared string simply to make joining easier. Several unrelated unknown customers would then appear to have the same identity. A shared placeholder can create relationships the input never established.
Question 6: When should you use transform instead of agg?
Suppose the follow-up asks for every ticket's difference from its segment's mean known handling time. The output must still contain one row per ticket. A transformation fits that requirement; an aggregation produces group-level results. The official GroupBy guide distinguishes these output shapes. Split, aggregate, and transform
joined["segment_mean"] = joined.groupby(
    "segment", dropna=False, observed=True
)["minutes"].transform("mean")
joined["minutes_above_mean"] = (
    joined["minutes"] - joined["segment_mean"]
)
In ticket order, the differences are −10, 10, 0, missing, and 0. Ticket 4 receives its segment's mean of five, but its own difference remains missing because its original time is unknown. The transformation supplies context; it does not impute the source measurement.
Prefer a built-in operation when it expresses the calculation clearly. Using groupby.apply immediately can leave you with unnecessary work to control the output shape. Explain the expected index and row count, then inspect them. Shorter code is useful only when its alignment behavior remains understandable.
Question 7: How would you resolve duplicate records?
First distinguish exact repeated records from updates. Two identical exports may be safely collapsed under an explicit deduplication rule. Two rows with the same ticket ID but different times require a decision about which observation is authoritative.
Official behavior: drop_duplicates(subset=..., keep="last") retains the last occurrence in the existing row order. “Last” does not mean latest timestamp unless you establish that order. Duplicate removal
For a latest-update requirement, parse the update timestamp, validate it, sort by the entity key and update time, and then retain the designated record. Specify a deterministic tie-breaker or reject conflicting ties. Sorting invalid date strings lexicographically is not a substitute for interpreting timestamps.
The ticket fixture assumes unique ticket IDs, so its code rejects duplicates rather than silently resolving them. That is intentional. Adding a generic deduplication line would conceal a violated input assumption and could discard valid revisions without explanation.
Practice the explanation and the counterexample
These five PracHub questions provide related practice. They are question-bank records, not predictions of a particular employer's interview. For each, write the output grain and one failure case before opening a solution.
| PracHub question | Specific practice focus |
|---|---|
| Manipulate and merge DataFrames correctly | State join cardinality and distinguish row-level enrichment from aggregation. |
| Transform messy transactions with pandas | Explain update ordering, conflicting duplicates, and cleaning policies. |
| Compute Total Spent in 2023 Excluding Refunds | Apply the requested population filter before calculating totals. |
| Load and visualize large CSV robustly | Make missing-value rules and memory limits explicit. |
| Illustrate SQL Join Results with Duplicate Keys | Predict duplicate-key expansion, then compare SQL and Pandas null behavior. |
Finish a practice answer with evidence: expected row count, unmatched IDs, measurement coverage, and one deliberately broken input. For this exercise, a duplicated lookup key must fail validation; a malformed duration must stay visible as missing; all five closed tickets must survive the final count.
Continue with Data Analyst practice on PracHub. Solve one question with a tiny hand-calculated fixture, then change one assumption. Being able to explain the resulting difference is a stronger preparation target than memorizing a long chain of methods.
Sources and Further Reading
- Pandas merge: cardinality validation, indicators, and null keys
- Pandas DataFrame.groupby: missing keys and categorical options
- Pandas numeric conversion
- Pandas GroupBy size
- Pandas GroupBy count
- Pandas GroupBy user guide
- Pandas duplicate removal
- Candidate account: LinkedIn Python aggregation and join mistake
Comments (0)