PrepLinx Review: Statistical Interview Mocks, Whiteboards, and Free Limits
Quick Overview
Review PrepLinx’s statistical-round description, public prompt tester, login gate and four-total-interview allowance. A constructed multiple-testing calculation and experiment follow-up tree distinguish fluent delivery from valid inference; voice, code and whiteboard execution remain untested.
PrepLinx advertises statistics interviews that ask for spoken reasoning alongside a code editor and whiteboard. Its public round page gives a concrete description of that format, but our start attempt required login. Plan a trial from the public material, then verify the actual voice, workspace and feedback behavior.
PracHub publishes this review and owns the complementary practice links. Our routing-experiment p-value question offers another explanation task. The multiple-testing calculation and follow-up tree below are original educational work, separate from PrepLinx’s interviewer, rubric or scores.
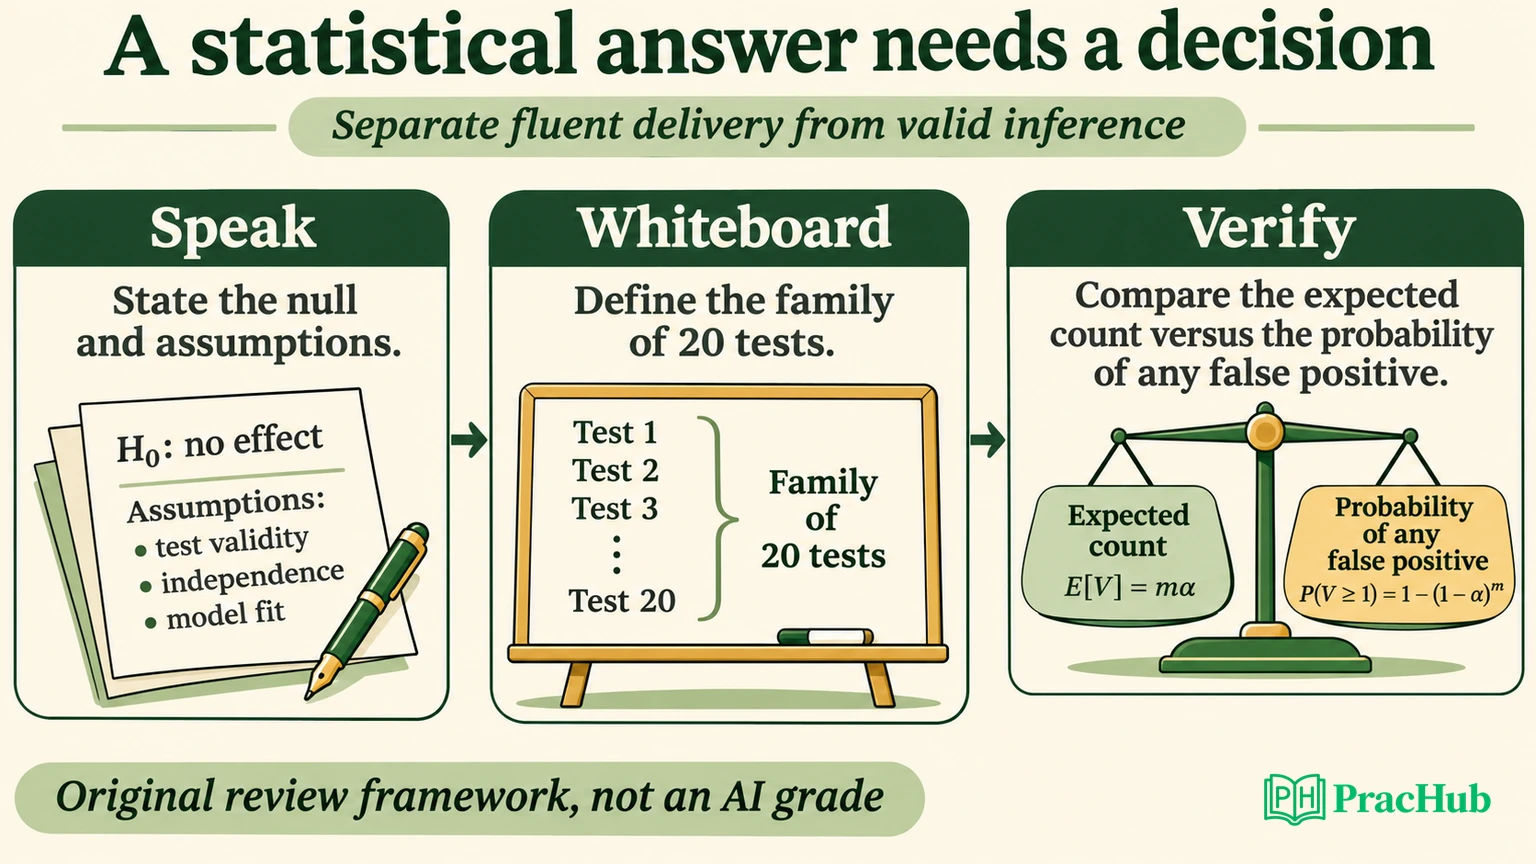
What the statistics round is designed to rehearse
Provider description, checked November 3, 2026: the statistical mock page describes questions about testing, probability, experiments, inference and regression. It emphasizes explaining assumptions and results aloud. The advertised workspace includes a code editor and a whiteboard.
The page describes sessions of up to thirty minutes and three difficulty levels. It also advertises dimensional feedback, quotations from the learner’s responses and a transcript. We did not receive a report or independently evaluate whether its feedback accurately reflects a response.
These are product-format claims, not evidence of a particular company’s interview process. We found no independent candidate reports or calibrated hiring outcomes supporting this review. A provider’s hiring-signal label should not be treated as a validated employment prediction.
Our interpretation: the useful question is whether the format makes an assumption visible and then challenges it. Check whether a fluent definition supports the proposed conclusion. A statistical mock should help you distinguish the computed quantity, its conditions and the decision it informs.
Our start attempt reached authentication
Direct observation: selecting the round’s free-mock link reached a login page. Its destination preserved the data-science statistical-round parameters. We did not sign in or create an account, and did not upload a resume or job description.
We did not authorize a microphone, start a voice session, run code or draw on a whiteboard. Consequently, the visible description of those tools is not a hands-on workspace test. We also did not inspect transcript retention, credit deduction or account history.
This boundary does not establish that the round is unavailable to registered users. It establishes what an unsigned visitor could reach in our check. Use that boundary to decide what an account-side trial still needs to establish.
The public question tester is a different surface
The homepage’s Question tester displayed Behavioral, Coding, System design and Product choices. We selected System design and saw a news-feed prompt. The control changed the displayed question; answering with the AI interviewer still linked to login.
We did not see a Statistics choice in that public control. That does not contradict the separate statistical-round page. It means this particular unsigned tester did not demonstrate a statistical conversation, whiteboard session or scored answer.
A generated prompt can help you rehearse aloud on your own. It cannot establish whether an interviewer notices an incorrect denominator, follows up on dependence or accurately quotes your reasoning. Those capabilities require a different trial and evidence from an actual exchange.
Four free interviews means four in total
The pricing page described four total free interviews with no card requirement. It advertised Starter and Pro monthly allowances but marked both plans coming soon, with disabled availability buttons. We did not activate the free allowance or purchase a plan.
The displayed future prices were $19 per month for Starter and $39 for Pro, with different annual-billing figures. Those are dated offers, not currently completed purchases. Do not turn a coming-soon card into a claim that an upgrade is available now.
The public FAQ says free interviews do not expire and a session too short to score, under three minutes, does not count. We read the provider’s statement but did not test its accounting. Four total interviews should not be described as four renewed every month.
| Intended trial | Public evidence | Account-side check still needed |
|---|---|---|
| Statistical voice session | Dedicated round page and login route | Actual questions and follow-up behavior |
| Calculation workspace | Editor and whiteboard advertised | Runtime, drawing and persistence |
| Free allowance | Four total interviews described | Balance and deduction behavior |
| Feedback report | Dimensions and quotations described | Correctness and calibration |
| Paid access | Coming-soon cards | Launch, checkout and activation |
Original case: separate expected count from the probability of any rejection
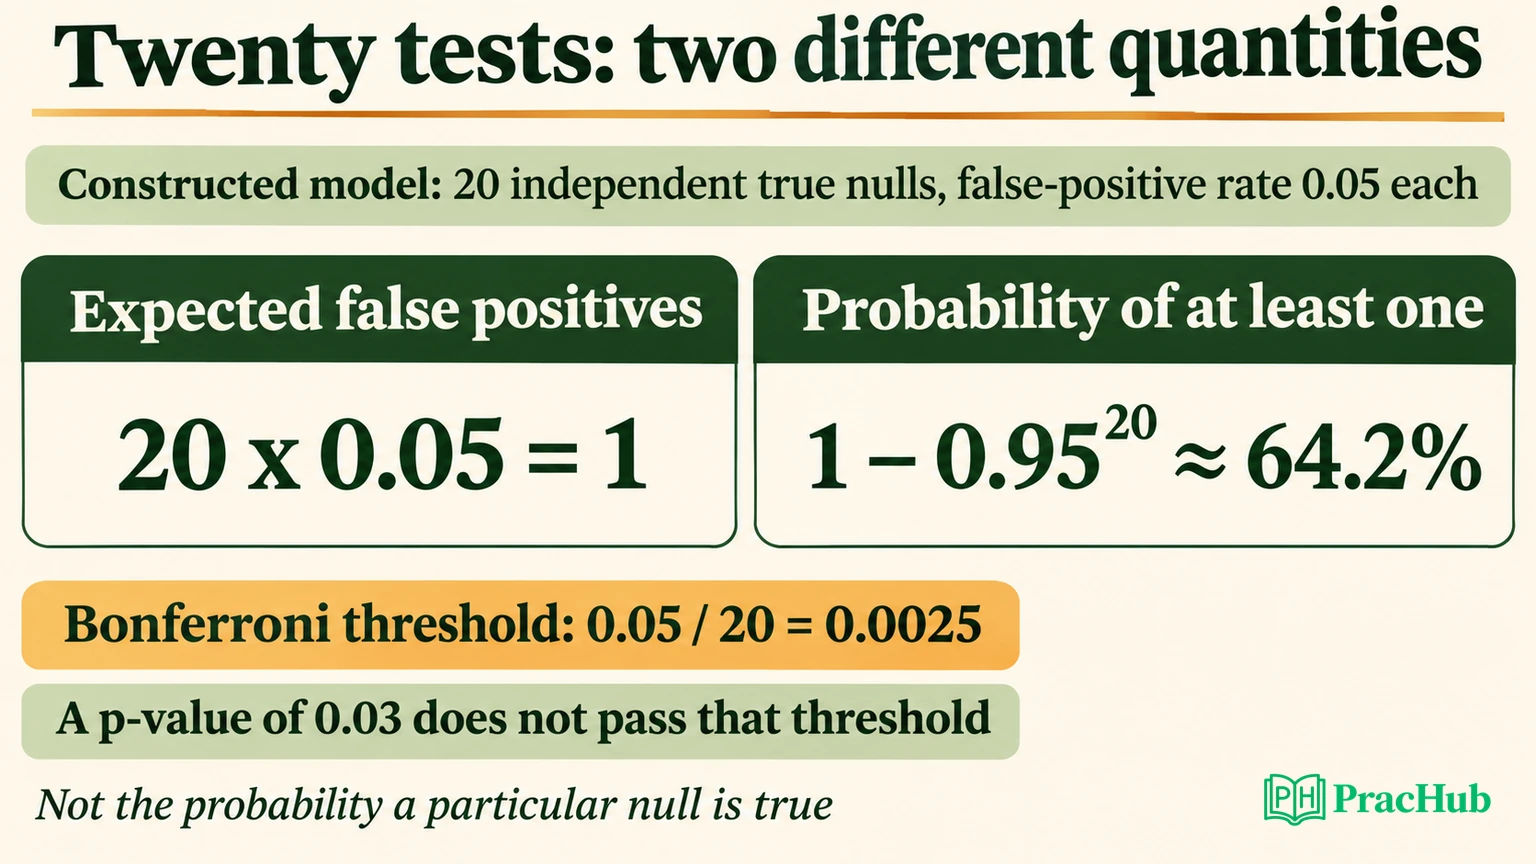
Consider a deliberately idealized family of twenty tests. Every null hypothesis is true, each test has an exact five-percent false-positive probability, and the rejection events are independent. These assumptions define our mathematical model; they do not describe a dataset or PrepLinx session.
The expected number of false positives is twenty times 0.05, or one. That is an average over repeated families under the assumptions. It does not mean that every family contains exactly one rejection.
The probability of no false positives is 0.95 to the twentieth power. Therefore the probability of at least one is one minus that quantity, approximately 0.6415, or 64.2 percent. This is a probability about a repeated-testing procedure when all twenty nulls are true.
It is not the probability that a particular observed result is false, nor the probability that its null hypothesis is true. Those interpretations require different information and reasoning. The American Statistical Association’s p-value statement explicitly distinguishes p-values from probabilities that hypotheses are true and cautions against threshold-only decisions.
| Quantity in the constructed model | Calculation | Meaning |
|---|---|---|
| Expected false-positive count | 20 × 0.05 = 1 | Average number across repeated families |
| Probability of any false positive | 1 − 0.95²⁰ ≈ 64.2% | Chance of at least one rejection in this all-null model |
| Bonferroni per-test threshold | 0.05 / 20 = 0.0025 | Threshold for a five-percent family-wise bound |
We checked these quantities with exact-fraction Python arithmetic. We also supplied an invented p-value list containing 0.03 and nineteen values of 0.5. One passes an unadjusted 0.05 threshold; none passes the stated Bonferroni threshold. No experiment data, test statistic or platform grade was generated.
Ask which assumptions survive a follow-up
Suppose the interviewer says the twenty outcomes are correlated. The expected count still adds the individual false-positive probabilities, provided each remains 0.05. Independence was not needed for that expectation. However, the product calculation for no rejection no longer follows from the given information.
Explain which calculation depended on independence. Do not discard every result when one assumption changes, and do not retain every result unchanged. Identify which step used the assumption and rebuild that step.
The Bonferroni family-wise bound comes from limiting the sum of individual error probabilities. It does not require independent tests when the individual p-values are valid for their respective nulls. The official statsmodels multiple-testing reference documents Bonferroni alongside other correction methods; we did not run that library in our arithmetic check.
A second follow-up is whether all twenty tests belong to the same decision family. That is a design question to specify, not a number to choose after seeing the smallest p-value. The relevant error criterion can change with the scientific or product objective.
A third asks about repeated looks over time. Twenty metrics at one fixed analysis and repeated peeking at one metric are different procedures. The simple calculation above does not automatically cover optional stopping, changing sample sizes or adaptively selected tests.
An original follow-up tree for an experiment answer
Use this tree to prepare a spoken response before opening any mock. It is our independent practice asset, not a reconstruction of PrepLinx’s interview script. Each branch asks for evidence that would change the conclusion.
| Starting claim | Follow-up | What the answer must specify |
|---|---|---|
| One metric is significant | Was it a primary outcome or one of many? | Planned hypothesis family and reporting |
| The result is reliable | What was randomized and measured? | Unit, sample and dependence |
| The correction fixes it | Which error rate are you controlling? | Family-wise error versus another criterion |
| The feature should launch | How large is the effect and what could worsen? | Estimate, uncertainty and guardrails |
| More data will settle it | What stopping rule and effect size matter? | Planned analysis and decision sensitivity |
A deliberately incomplete answer is “p equals 0.03, so launch.” It omits the family, effect size, uncertainty and consequences. Define the test family and changed procedure before claiming to address multiple testing.
A stronger answer asks whether the result concerns the planned primary metric, reports the other analyses and states what the chosen error control permits. It then separates statistical evidence from the product decision. We did not submit either answer to PrepLinx.
Use a whiteboard for structure and code for a specified calculation
For the original case, a whiteboard can show twenty hypotheses, the rejection threshold and the event “at least one rejection.” That picture helps separate a count from a probability. The assumptions should be written beside the diagram so that a changed dependence condition has an obvious place to act.
Code is useful once the quantity is specified. Our small calculation verifies arithmetic for a supplied model. It cannot determine the correct randomization unit, recover unreported analyses or justify a launch decision. Those are inputs to the analysis rather than outputs of exponentiation.
In a future workspace trial, check whether you can label those assumptions, show the relevant calculation and explain the result without reading a prepared answer. We did not test PrepLinx’s supported runtimes, package installation or whiteboard persistence, so those remain open product questions.
A voice transcript adds another layer. The sentence “this is not the probability the null is true” changes meaning if its negation is lost. We did not test transcription. Inspect an actual transcript before attributing a feedback criticism to the answer you intended to give.
Evaluate feedback through a changed conclusion
A useful correction should identify a specific missing condition and explain its consequence. For example, it might show that the independence assumption supports the 64.2-percent calculation, while a different argument supports the Bonferroni bound. That gives you a revision to defend.
Inspect the correction alongside the overall score. A higher second score might follow clearer delivery, a different question or a different grading response. Without a controlled comparison, it does not establish that your statistical reasoning improved.
For a bounded trial, save the original answer, the exact feedback and the corrected derivation. Then change one condition and answer again. You can inspect whether the correction transfers to the new case, even when a numerical score is difficult to interpret.
We did not receive feedback, compare repeated sessions or measure learning outcomes in PrepLinx. The framework above defines what would make a future trial useful. It does not claim that the platform already meets or fails those standards.
Practice the gaps the product leaves open
These independent PracHub questions extend the statistical reasoning. They are not PrepLinx prompts, hidden references, feedback dimensions or evidence of current employer rounds.
| PracHub question | What to examine |
|---|---|
| Welch's t-Test p-Value for a Routing Experiment on Time to Pickup, and Its Validity | Check the test assumptions and sampling unit before interpreting its p-value. |
| Explain Type I/II errors vs precision/recall | Separate testing errors from classification metrics and decision costs. |
| Explain P-Value Reporting and Bootstrap for Coefficient Estimation | Explain what a reported p-value and a coefficient estimate each establish. |
| Define Product Health and Experiment Design | Define the product metric, experiment unit and decision before computing. |
| Defend a Research Direction and Experiment Design | Defend the design and the limitations of the resulting evidence. |
Who should try PrepLinx next
PrepLinx is worth a focused account-side trial if you want spoken statistical questions with advertised code and whiteboard support. The public statistical page explains the intended format, while our actual start stopped at login. Four free interviews are a provider allowance; paid plans were not yet available when checked.
Prepare the routing-experiment prompt first. State the null, randomization unit, outcome family and decision, then explain what a p-value cannot tell you. Use any future feedback to repair one specific step and verify the revised explanation independently.
Comments (0)