QuantumBlack Data Scientist Interview: Project Deep Dives and Live Coding
Quick Overview
Prepare for QuantumBlack data science interviews by separating official guidance from one candidate report, defending your project decisions and practising live implementation. Includes an original project evidence map, tested Python streaming mean and variance, numerical edge cases, and follow-ups about merging summaries and changing requirements.
For a QuantumBlack Data Scientist interview, prepare a project you can explain beyond its headline metric. You should be able to defend the data, the method you chose, the alternatives you rejected, and the part of the work you personally owned. Then practise applying that same precision while writing code.
Our preparation thesis: a convincing project story and a convincing coding solution share one habit: make a claim, identify the evidence that supports it, and state where it stops being reliable. The project example and streaming-statistics exercise below are original practice material, not QuantumBlack interview questions.
Use PracHub's Data Scientist questions to build follow-ups around the parts of your project that are hardest to defend.

What is official, and what comes from one candidate
Official role context: QuantumBlack's careers page describes engineers, product managers, designers, and data scientists working together on AI and business problems. It points candidates toward interview preparation, but it does not establish a universal Data Scientist interview sequence. QuantumBlack's careers page.
Official interview guidance: McKinsey says technical applicants receive assessments tailored to relevant skills, which may include coding challenges, problem-solving tasks, or other exercises. It also says recruiters confirm interview details. Its broader discussion of personal-experience and problem-solving interviews should not be converted into a guaranteed QuantumBlack loop for every office and seniority. McKinsey's interview guidance.
Candidate report: a March 2026 Senior Data Scientist 1 account describes a project-focused technical round with questions about methods and alternatives, followed by a code-pair round the author found difficult to optimize. The author lists possible later rounds but does not describe completing them. This is one person's account, not evidence that every candidate receives the same algorithm, difficulty, duration, or sequence. The candidate's discussion.
We did not establish two independent same-cycle reports sufficient to reconstruct one standard process. Our inference: prepare both technical project discussion and live implementation, while checking your actual invitation for the role-specific format.
Choose a project with decisions you can defend
Choose a project where you can explain at least one consequential decision from firsthand involvement. A smaller project with clear ownership can support a better discussion than a prestigious team initiative whose design you only observed.
Start with a short account of the problem, the intended user, the decision the system supported, and your responsibility. Then identify the constraint that made the work difficult: labels arrived late, inference had to fit a latency budget, an intervention changed the target, or the available data did not represent future users.
For practice, imagine a fictional support-ticket triage classifier. Its job is to recommend a routing queue when a ticket arrives. You owned feature construction and validation; another engineer owned serving infrastructure, and the operations team defined queue policy.
That division of responsibility is more credible than claiming sole ownership of every layer. Use “I” for your decisions and “we” for team outcomes. If you contributed to a result without controlling the experiment or deployment, explain that boundary.
Do not invent performance numbers to make the story sound stronger. If exact results are unavailable, describe the metric definition, direction of change you can substantiate, and what evidence you would need to quantify it properly.
Build a map from project claims to evidence
Use a compact table to connect each major claim to evidence and a likely follow-up. Fill it with your own work; the entries below illustrate the triage example rather than prescribe an answer to memorize.
| Project claim | Evidence to prepare | Alternative and weakness to discuss |
|---|---|---|
| Features were available at ticket creation | Field timestamps and a sample reconstructed input | Post-resolution tags would be informative but unavailable at prediction time |
| The model improved routing | Comparison against the existing rule baseline under the same split | A stronger model may still be impractical if confidence is poorly calibrated |
| Validation represented deployment | Time windows, customer grouping, and label maturity rules | A random split may mix repeated templates or future information |
| The solution was operationally useful | Routing overrides, queue load, and error slices | Aggregate accuracy can hide costly misroutes in a small queue |
| I owned the analysis | Specific code, decisions, reviews, and handoffs you performed | Team outcomes should not be presented as individual work |
The table should expose weak points, not conceal them. If you cannot explain how the labels were generated, that is a preparation priority. If you do not know whether the baseline used the same information cutoff, qualify the comparison before an interviewer has to find the mismatch.
For each row, rehearse a follow-up beginning with “What would change your mind?” A model-choice answer becomes stronger when you can name evidence that would favor a simpler baseline or a different evaluation design.
Explain alternatives and failures without losing the thread
A useful method-choice explanation connects the alternative to a constraint. For the triage example: “We compared a rules baseline with a text classifier. The rules were easier to inspect but missed varied wording. I would only accept the classifier if its gains persisted on later tickets and its uncertain predictions could fall back to manual routing.”
That is an original example of reasoning, not a claim that this comparison happened at QuantumBlack. Replace it with the alternatives you actually evaluated in your own work.
When discussing leakage, identify a concrete field and timestamp. “We checked leakage” is vague. “The resolution category was created after routing, so it could not be an input to the arrival-time model” makes the failure understandable.
Likewise, explain a failed iteration through the evidence that changed your diagnosis. Perhaps a strong random-split score disappeared when repeated customer templates were separated. The lesson is not simply that the model overfit; it is that the original validation answered the wrong generalization question.
Then distinguish remediation from proof. Removing one suspicious feature does not establish that every remaining feature is valid. Rebuild the information-availability check, rerun the baseline comparison, and inspect the slices most affected by the change.
A technical deep dive should also reach deployment limits. State who could override the prediction, what happened when inputs were missing, how delayed labels affected monitoring, and which failure would trigger rollback. These details connect model decisions to the people using the system.
Original live-coding task: summarize a numeric stream
Now switch from project discussion to implementation. Build an append-only accumulator for count, mean, and variance without retaining every observation. Support both population variance and sample variance through an explicit query option.
Agree on the contract first: inputs are Python integers or floats, excluding booleans; each value must be finite and have magnitude at most one trillion. The stream is used by one caller at a time. Empty queries return no mean or variance; a singleton has population variance zero but no sample variance. Deletion, rolling windows, and distributed merging are not required initially.
Technical convention: Python's statistics module distinguishes population variance from sample variance. Their denominators are n and n - 1, respectively, where defined. The choice belongs in the statistical contract rather than being guessed from the word “variance.” Python's statistics documentation.
The following implementation keeps a count, running mean, and sum of squared deviations, often called m2:
import math


class RunningStats:
    def __init__(self):
        self.n = 0
        self.mean = 0.0
        self.m2 = 0.0

    def add(self, value):
        if type(value) not in (int, float) or abs(value) > 1e12:
            raise ValueError("Use bounded numeric observations")
        value = float(value)
        if not math.isfinite(value):
            raise ValueError("Observation must be finite")
        self.n += 1
        delta = value - self.mean
        self.mean += delta / self.n
        self.m2 += delta * (value - self.mean)

    def snapshot(self, sample=False):
        denominator = self.n - 1 if sample else self.n
        return {
            "count": self.n,
            "mean": self.mean if self.n else None,
            "variance": self.m2 / denominator if denominator > 0 else None,
        }
math.isfinite rejects infinities and NaN. The validation happens before any state change, so a rejected observation does not increment the count or contaminate the accumulator. Python's math reference.
The magnitude bound keeps the exercise focused on ordinary floating-point values. It does not promise exact arithmetic or identical final bits across every platform and update order. If the application requires exact rational results, agree on a different representation and its cost.
Explain the update with an example, then test it
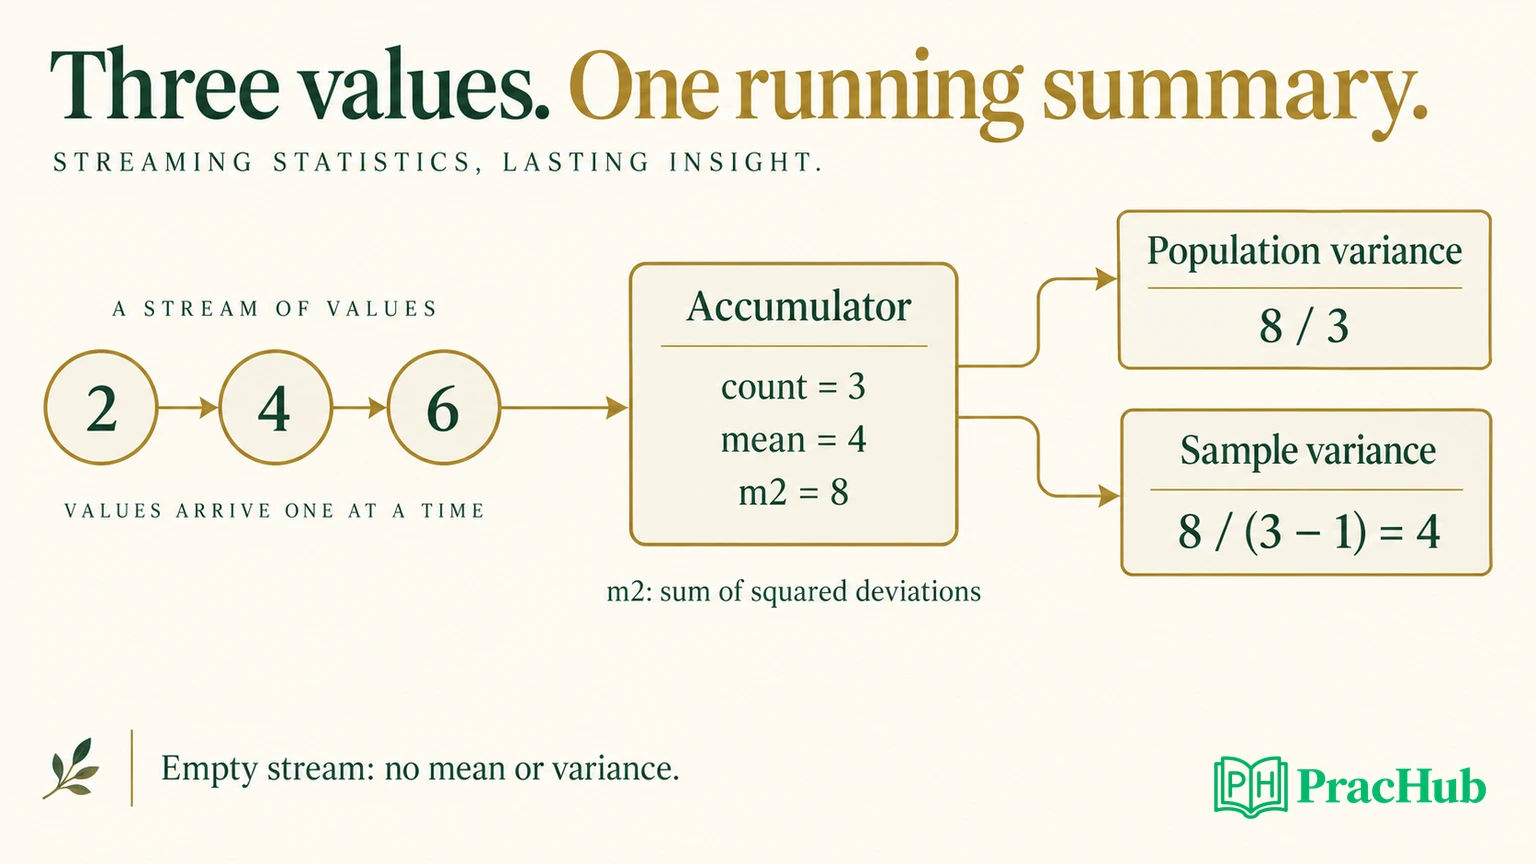
Insert 2, 4, and 6. The mean is four. Squared deviations from that mean total eight, so population variance is 8 / 3 and sample variance is four.
When a new value arrives, delta measures its distance from the previous mean. The mean shifts by delta / n. The second expression uses the updated mean to extend the squared-deviation total without storing the earlier observations.
This update avoids subtracting two large, nearly equal quantities to obtain a small variance. That subtraction can lose useful precision. Still compare results with an appropriate tolerance rather than assuming floating-point equality.
| Check | Expected behavior | Why it matters |
|---|---|---|
| Empty stream | Count zero; mean and variance absent | No divide-by-zero default |
| One value, 5 | Mean five; population variance zero | Distinguishes sample and population conventions |
| Values 2, 4, 6 | Mean four; population variance 8/3 | Checks the basic update |
| Repeated values | Variance zero | Detects incorrect deviation accumulation |
| Negative and mixed values | Match a trusted offline calculation | Prevents positive-only assumptions |
| NaN, infinity, boolean, oversized value | Reject without changing state | Protects the accumulator's contract |
| Large common offset with small differences | Close to offline variance | Exposes numeric cancellation issues |
Our reference tests execute the article's class and compare it with Python's offline statistics functions. They also inspect state before and after invalid input. These checks support the stated exercise behavior; they do not establish a production monitoring system's correctness.
For the stated arithmetic model, each insertion and query uses constant work and a fixed number of accumulators. If an interviewer pushes on arbitrary-size counts or exact arithmetic, acknowledge that numeric representation changes the cost model.
Handle a follow-up by changing the contract deliberately
Suppose the interviewer now asks to combine two workers' summaries. Averaging their means is wrong unless the counts are equal. Three observations with mean two and one observation with mean ten have combined mean four, not six.
You also cannot average their variances blindly: differences between the group means contribute to the combined variation. Explain that additional term before writing a merge function. Decide how an empty summary behaves and whether summaries use compatible conventions.
A rolling window is another distinct change. The current object cannot remove an old observation because it does not retain the window or provide a removal update. Name the memory and numerical trade-offs before claiming the append-only solution already supports it.
If asked for a median instead, explain why count, mean, and squared deviations are insufficient to reconstruct the order statistics. The candidate report's mention of a heap-related question is not a reason to force heaps into every streaming problem. Choose the data structure from the requested operations.
During live coding, narrate these decisions at meaningful points: before choosing state, after a failing example, and when a new requirement changes the design. Reading every line aloud obscures the reasoning the interviewer needs to evaluate.
Connect preparation to your actual experience
Return to your project evidence map and choose the claim with the weakest support. Rehearse a candid explanation of what you know, what you inferred, and what you would measure next. Then choose one implementation exercise that probes that weakness, such as data validation, threshold evaluation, or streaming summaries.
Official assistance boundary: McKinsey welcomes responsible AI use for preparation but prohibits generating real-time interview answers and using AI in assessments unless specifically permitted. Practise until you can explain and adapt the work yourself. McKinsey's interview and assessment guidance.
A useful final rehearsal combines a short project introduction, two adversarial technical follow-ups, and a small coding change. Finish by identifying one unsupported claim you corrected and one test that changed your implementation.
Five questions for focused follow-ups
These are adjacent practice prompts, not a QuantumBlack question bank. The project prompts include other roles; use their ownership and evidence questions without claiming they describe your interview format.
| PracHub question | Skill to rehearse |
|---|---|
| Explain a research project in depth | Connect hypotheses, data, validation, and your contribution. |
| Describe project scope and ownership | Separate personal responsibility from team outcomes. |
| Compute and Explain Mean and Variance | Set statistical and numerical conventions before coding. |
| Maintain the Median of a Number Stream | Choose state based on insertion and query requirements. |
| Debug a failing ML classifier | Diagnose validation, calibration, and deployment gaps systematically. |
Continue with PracHub's Data Scientist collection, and make each answer specific enough that another person can challenge it with data or a test.
Comments (0)