Tableau LOD Interview Questions: FIXED, INCLUDE, EXCLUDE, and Filter Order
Quick Overview
Prepare for Tableau LOD interview questions through an original subscription-billing dataset. Compare FIXED, INCLUDE, and EXCLUDE at different view grains, predict regular versus context-filter results, and explain repeated values, customer averages, and denominator changes. Includes a reproducible worksheet verification plan.
Tableau LOD interview questions test whether you can predict a number when the worksheet changes. Reciting that FIXED specifies dimensions, INCLUDE adds them, and EXCLUDE removes them is a useful start. A complete answer explains when filters apply and how Tableau displays the calculation at the view's grain.
The central question is: which records contribute to this value, and which dimensions separate its groups? Answer that before changing the formula. For broader practice connecting calculations to business meaning, explore PracHub metric-definition questions.
This guide uses an original subscription-billing exercise. Official Tableau documentation supplies the calculation rules. The numerical results below are expected results derived from those rules, not recorded Tableau execution; native worksheet verification remains pending. These are editorial practice prompts, not candidate reports or claims about an employer's interview bank.

Begin with six billing records
Our single source contains one row per subscription invoice. Amount is billed revenue in one currency, before any refunds. It is not recognized revenue, cash collected, or a daily recurring-revenue balance. A customer has one stable plan in this small fixture; real plan changes would require an explicit attribution rule.
| Invoice | Customer | Plan / Month | Amount |
|---|---|---|---|
| I1 | A | Basic / Jan | 20 |
| I2 | A | Basic / Feb | 20 |
| I3 | B | Basic / Jan | 30 |
| I4 | C | Pro / Jan | 60 |
| I5 | C | Pro / Feb | 60 |
| I6 | D | Pro / Feb | 90 |
Use Month as a string dimension with the two values Jan and Feb for this exercise. That avoids accidentally comparing a month date part across multiple years. Invoice identifiers and customer identifiers are strings; Amount is numeric. There are no nulls, duplicates, joins, or secondary data sources.
The control totals are Basic 70 and Pro 210, for total billing of 280. January contributes 110 and February 170. Customer totals are A 40, B 30, C 120, and D 90. These numbers let you detect an incorrect aggregation without a large workbook.
Before answering an LOD question, state whether the requested metric is invoice amount, customer billing, plan billing, or a share of billing. Those are different grains even when the same Amount field appears in every formula.
Which grain does each expression use?
Create three calculated fields, giving each the name shown above its expression:
// Plan Billing
{ FIXED [Plan] : SUM([Amount]) }

// Customer Billing Within View
{ INCLUDE [Customer] : SUM([Amount]) }

// Billing Without Month
{ EXCLUDE [Month] : SUM([Amount]) }
Official definitions: FIXED uses the declared dimensions. INCLUDE combines its dimensions with those in the view. EXCLUDE removes specified dimensions from the view's calculation grain.
With Plan on Rows and no other grouping dimensions, Plan Billing calculates at Plan. Customer Billing Within View calculates at Plan–Customer. Billing Without Month also calculates at Plan because Month is not part of this view.
Now add Month beside Plan on Rows. FIXED still calculates Plan billing. INCLUDE now calculates Plan–Month–Customer billing. EXCLUDE removes Month, leaving Plan. Moving a field onto Detail or Color can also change the view's grouping; inspect the Marks card, not only the row and column headers.
An interview answer should name both grains explicitly: “The worksheet has one mark per plan and month, while this FIXED value is calculated once per plan.” That explains why two marks can carry the same value without implying duplicate source records.
Why does the outer aggregation matter for INCLUDE?
On the Plan-only worksheet, display Customer Billing Within View using AVG, not its default aggregation. This first totals each customer's billing within each plan, then averages those customer-level totals.
Basic has customer totals 40 and 30, so the expected average is 35. Pro has customer totals 120 and 90, so its expected average is 105. Changing the displayed aggregation to SUM instead asks for the sum of customer billing: 70 and 210.
Compare that with AVG([Amount]). It averages invoice rows: Basic is 70/3, approximately 23.33; Pro is 210/3, or 70. Neither is the average customer total. Customer A and customer C each have two invoices, so invoice-level averaging gives those customers more observations.
This is a useful response to “Why use INCLUDE here?” You need an intermediate customer grain before displaying a plan-level average. The calculation makes that intermediate step explicit, as in Tableau's official INCLUDE examples.
Do not describe the result as average billing across every subscribed customer. Customers without invoice rows are absent from this source. If the business denominator includes non-billed subscribers, you need those customers represented in the data and a rule for their zero billing.
What changes when Month enters the view?
Add Month to the worksheet and retain AVG for Customer Billing Within View. The expected results now average customers within each plan–month group:
| Plan / Month | SUM Amount | AVG INCLUDE Customer | FIXED Plan / EXCLUDE Month |
|---|---|---|---|
| Basic / Jan | 50 | 25 | 70 / 70 |
| Basic / Feb | 20 | 20 | 70 / 70 |
| Pro / Jan | 60 | 60 | 210 / 210 |
| Pro / Feb | 150 | 75 | 210 / 210 |
The Basic January average is (20 + 30) / 2 = 25. In Basic February, only A has an invoice, so the average is 20. Pro February averages C's 60 and D's 90, giving 75.
Removing Month returns the customer averages to 35 and 105. You cannot recover those values by simply averaging the displayed monthly averages. The customer groups and their billing periods have changed. Explain the new intermediate groups before attempting any arithmetic on visible marks.
The last column intentionally shows equal FIXED and EXCLUDE values in this unfiltered view. Equal output does not mean equivalent behavior. The next filter change separates them.
Does FIXED ignore a February filter?
Keep Plan and Month in the view, then apply an ordinary dimension filter retaining only Feb. The expected surviving marks are Basic February and Pro February.
Official filter behavior: FIXED is evaluated before ordinary dimension filters, whereas INCLUDE and EXCLUDE are evaluated after them. Extract, data-source, and context filtering can affect what FIXED sees. Tableau explains this sequence in its LOD filter documentation.
In this exercise, the ordinary February filter leaves Plan Billing at 70 for Basic and 210 for Pro. Billing Without Month sees the filtered February records and returns 20 and 150. Excluding Month from the grouping does not restore January records removed by the dimension filter.
Now promote the same February filter to context. Its restriction occurs before FIXED, so Plan Billing becomes 20 and 150 as well. The filter values have not changed; its position in the evaluation sequence has.
| February-only state | FIXED Basic / Pro | EXCLUDE Basic / Pro | AVG INCLUDE Basic / Pro |
|---|---|---|---|
| Ordinary dimension filter | 70 / 210 | 20 / 150 | 20 / 75 |
| Context filter | 20 / 150 | 20 / 150 | 20 / 75 |
“FIXED ignores all filters” fails this counterexample. A more precise answer is: “This ordinary Month filter does not alter the FIXED Plan computation, but it removes January marks. Moving Month into context changes the input records available to FIXED.”
Which denominator should a billing share use?
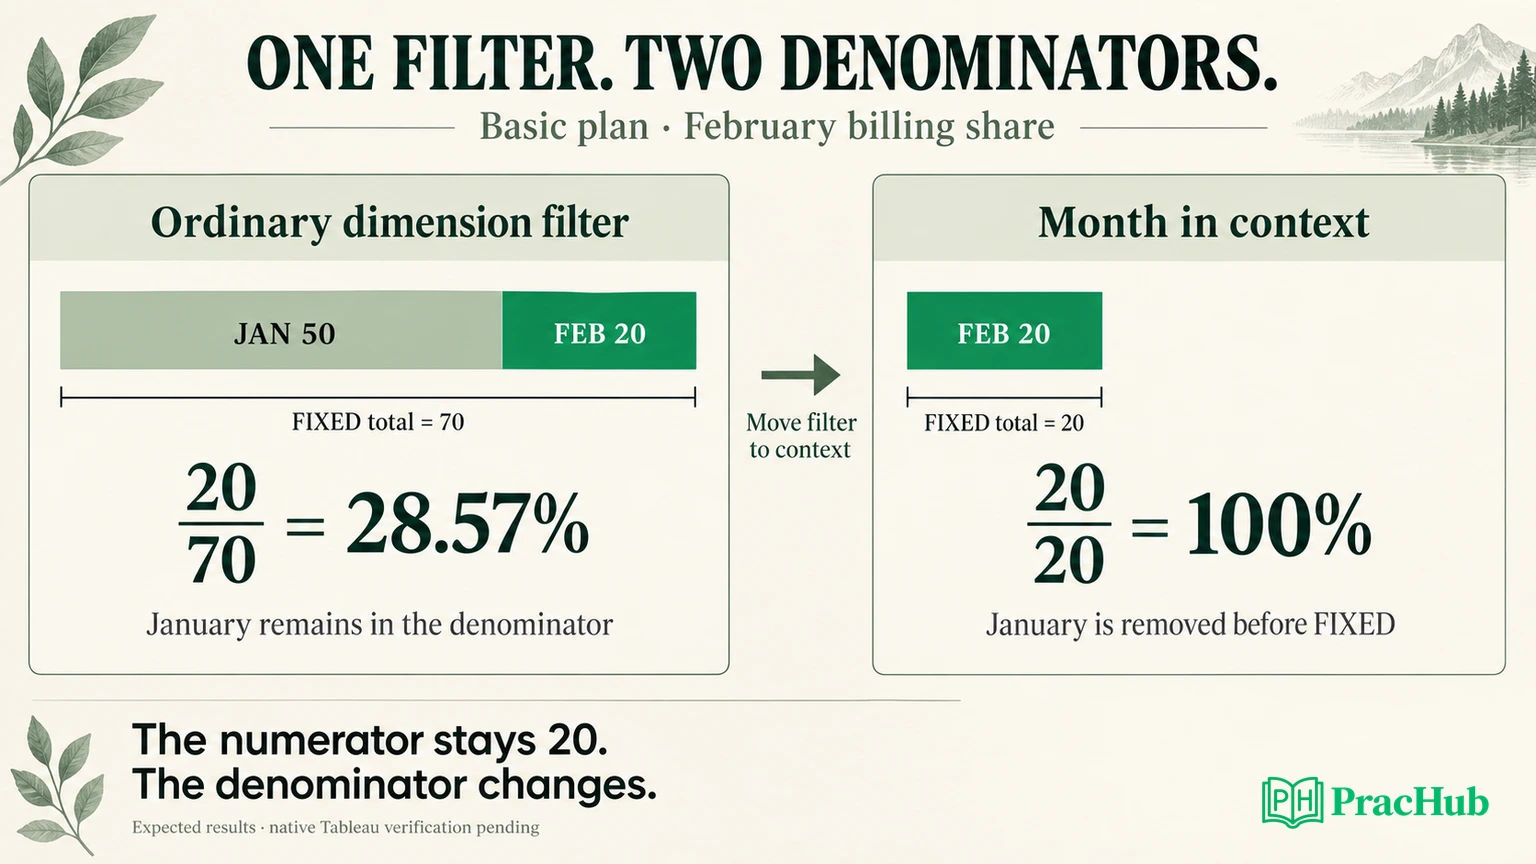
Consider February's share of the two-month billing total for each plan. With the ordinary February filter, use:
SUM([Amount]) / ATTR([Plan Billing])
The expected shares are Basic 20/70 = 28.57% and Pro 150/210 = 71.43%. Each mark has one Plan Billing value, which is why ATTR is suitable for this view. These are shares within separate plans; there is no requirement that they add to 100% across plans.
Move the February filter into context and each share becomes 100%. That is correct for February billing divided by February billing, but it no longer answers “What share of the two-month period occurred in February?”
Replacing Plan Billing with Billing Without Month also produces 100% under the ordinary February filter. The denominator's grouping omits Month, but its available records are already February-only.
Before promoting filters to context as a blanket fix, ask which denominator the stakeholder intended. If the comparison should retain a broader reporting period, resetting the denominator to the selected period changes the metric. Document that choice beside the field name or dashboard description.
Why do repeated LOD values not mean repeated revenue?
In the unfiltered Plan–Month view, Basic's Plan Billing value 70 appears on both January and February marks. Pro's 210 likewise appears twice. Those are reference values for each mark, not four disjoint revenue amounts.
Tableau's aggregation and replication guidance distinguishes a calculation coarser than the view from one that must be aggregated up to it. EXCLUDE commonly displays replicated values and uses ATTR to signal that behavior.
Manually summing the four displayed reference values gives 560, twice the source total of 280. That arithmetic does not establish what Tableau's grand-total feature will calculate. Totals have their own evaluation context and configuration; inspect them separately instead of assuming they sum visible labels.
Likewise, ATTR is not a universal repair for disagreement. If a mark contains more than one relevant value, investigate why the mark's grain and the calculation's grain differ. A visible asterisk is a diagnostic clue, not an instruction to choose whichever aggregation makes it disappear.
How should you verify the worksheet?
Recreate the six records in a CSV with separate Invoice, Customer, Plan, Month, and Amount columns. Connect that file as a single source, confirm its types, and create the three fields. Start with a text table so chart formatting cannot hide the numbers.
Record the Tableau version and connection type. For every comparison, capture the fields on Rows, Columns, and the Marks card; each filter and whether it is context; the aggregation on each displayed LOD field; and the exported crosstab values.
Verify the Plan-only averages first, then the four unfiltered Plan–Month marks. Apply the ordinary February filter, promote it to context, and finally remove it. Check that the original totals return. Change one setting at a time so a discrepancy has an identifiable cause.
These steps are a pending native verification plan, not a claim that a workbook has already passed. Arithmetic checks can confirm 20/70, but they cannot validate Tableau's actual filter configuration, data types, or generated view. Avoid presenting an inferred result as a captured application result.
For interview rehearsal, explain a changed value in this order: source records, view grain, LOD grain, filter stage, and final aggregation. If the prompt omits one of those inputs, state your assumption and show how the answer would change under the alternative.
Practice the surrounding decisions
These PracHub questions extend the exercise into modeling, filtering, and communication. They are adjacent practice, not evidence that this exact billing fixture appears in interviews.
| PracHub question | Focus for your answer |
|---|---|
| Compare Tableau live vs extract and filters | Connect calculation behavior to a larger dashboard's data access choices. |
| Compare Tableau blending, joins, and filters | Add multiple sources only after explaining the single-source grain. |
| Choose Between JOIN, BLEND, and RELATIONSHIP in Tableau | Defend modeling and visualization choices together. |
| Choose Effective Graphs for Data Exploration | Choose an encoding that makes comparisons and denominators clear. |
| Translate goals into robust product metrics | Specify the population, period, and denominator before calculating. |
Continue with metric-definition interview practice. For each metric, explain whether changing a filter should change the numerator, denominator, both, or only the displayed marks.
Comments (0)