Voloridge Quantitative Research Intern 2027: Python, Statistics, and Interview Process
Quick Overview
An evidence-labeled guide to Voloridge’s 2027 Quantitative Research Intern role, separating official requirements and recruiting stages from historical reports, with original point-in-time Python and model-validation exercises.
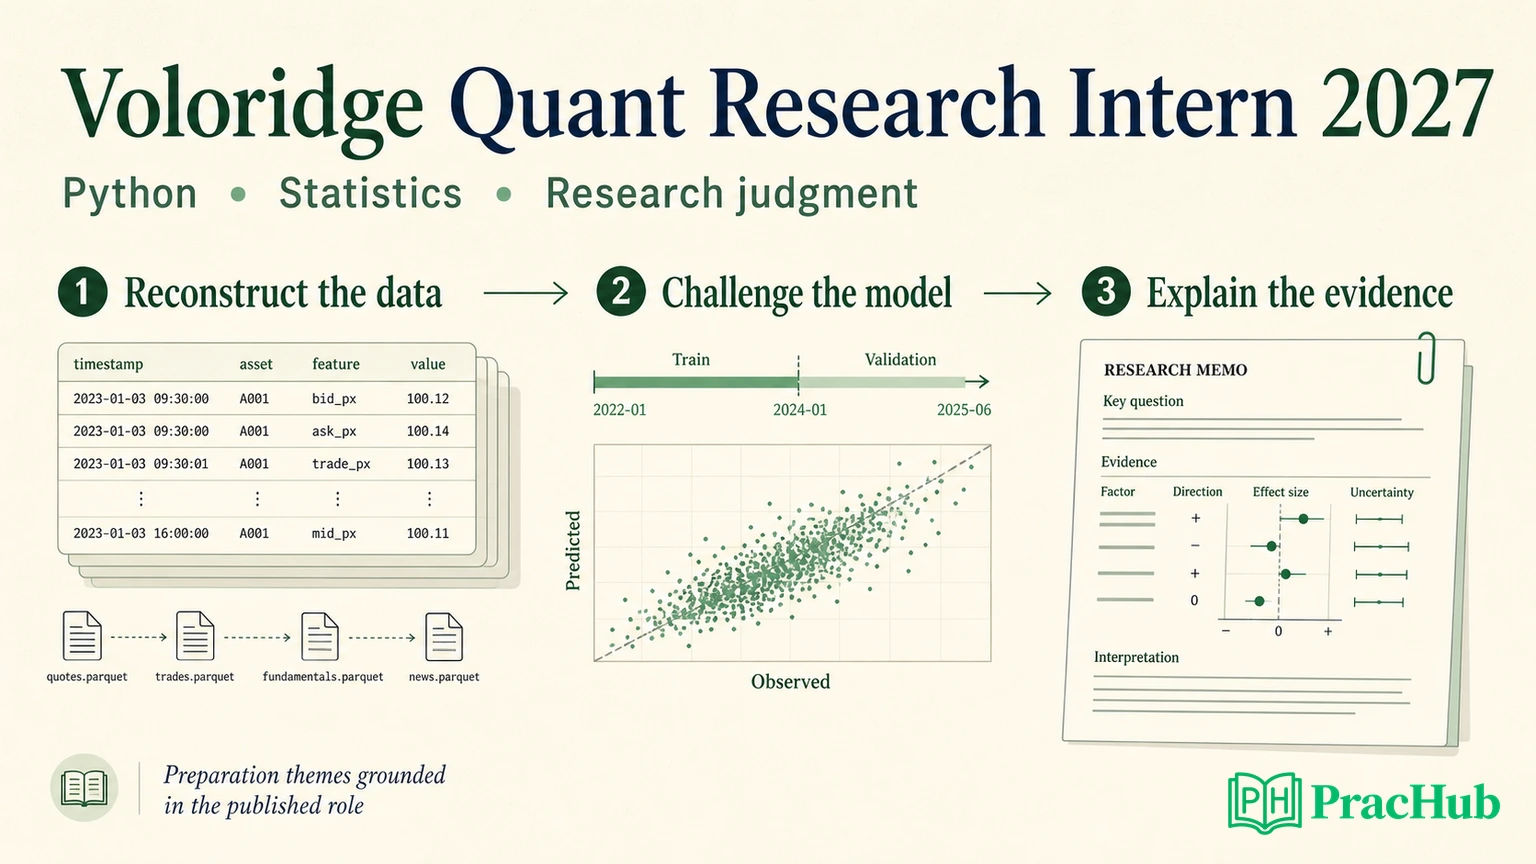
The Voloridge Quantitative Research Intern 2027 role is officially listed, and its emphasis is clear: work with unconventional datasets, apply statistics and machine learning, and explain research to other researchers. Python is a useful preparation language, but the posting asks for experience with at least one programming language, rather than specifying a Python-only assessment.
The interview format is less settled. Voloridge publishes a general recruiting framework, while available intern reports describe individual experiences from earlier recruiting periods. This guide separates those sources from original exercises so you can prepare without assuming a fixed question count, timer, or take-home assignment.
Start with PracHub Machine Learning questions, then use the data-version and validation exercises below to connect implementation with research judgment. The linked practice records are cross-company material, not predictions of Voloridge’s questions.
What the official 2027 posting confirms
Official facts: This is a 10-week, onsite internship in Jupiter, Florida. The minimum requirements include at least three completed years of an undergraduate or graduate program in mathematics, statistics, physics, or an equivalent field; programming experience; and demonstrated mathematical and statistical ability. The work includes collecting and cleaning unconventional datasets, conducting research with data scientists, and presenting findings. Official 2027 Quantitative Research Intern listing
The listing mentions a potential full-time opportunity, not a guaranteed return offer. It does not provide a universal application deadline or exact internship start date. If your academic calendar or degree progress creates ambiguity, ask the recruiting team how the requirement applies to your circumstances.
Keep the role title precise when researching. Quantitative Developer Intern, Quantitative Research Fellowship, and roles at VOLO Health are separate openings. Their interview accounts should not be combined into a single research-intern process simply because they share part of the organization’s name.
Preparation inference: Build evidence that you can turn a messy dataset into a defensible result. A compact research project with transparent assumptions can support that discussion better than a notebook containing many models and an unexplained winning score.
The interview process: official framework and reported experience
Official framework: Voloridge’s careers page lists resume submission, an application and compliance questionnaire, an HR video interview, assessments, team video or telephone interviews, and final interviews. Assessments may be administered internally or through an external provider. The company-wide description allows final meetings in the office or, in some circumstances, virtually; it is not a promise that every intern follows every step. Voloridge recruiting process
Candidate reports: A Quantitative Research Internship account published April 21, 2026 describes a 40-minute conversation with a quantitative researcher and no progression beyond that screen. A separate Quantitative Research Intern account published June 3, 2025 describes HR screening, a CTO conversation, an online or take-home project, and a research-team discussion. The dates identify report publication, not confirmed 2027 interview events. 2026 internship report, historical intern report.
These accounts support preparing to explain research and potentially complete practical work. They do not establish two independent accounts from the 2027 cycle. There is insufficient evidence here to name a mandatory assessment provider, passing score, question count, or standard total duration.
For planning, ask which stages remain, whether practical work is timed or take-home, which tools are allowed, and when to expect an update. Separate an assessment’s completion deadline from the company’s response window. Neither is the same as an application closing date.
Python preparation should make assumptions inspectable
Recommended practice: Take a small research dataset from raw records to a reproducible evaluation. Be able to explain joins, missing values, duplicate records, grouping, time ordering, and numerical checks before discussing model complexity. These are preparation priorities inferred from the advertised work, not a leaked coding syllabus.
Give each function a clear contract. A cleaning function should say which rows it rejects and why. A feature function should state which observations it can use. An evaluation function should receive predictions aligned with the intended targets, rather than relying on two arrays that happen to have equal lengths.
Begin with a readable implementation and a tiny example you can calculate manually. Then discuss vectorization, memory use, or chunked processing if the input size makes them relevant. A fast join that duplicates target rows silently can be worse research code than a slower implementation whose output is correct and auditable.
Prepare to describe your debugging process aloud. If a score improves unexpectedly, check row counts, target alignment, and feature availability before celebrating. Write assertions that fail when an assumption breaks; do not merely print intermediate tables and hope to notice the problem.
Original exercise: reconstruct what was knowable at 09:30
This is an original Python research exercise, designed around the posting’s unconventional-data emphasis. It is not a reported Voloridge prompt or a description of the firm’s data pipeline.
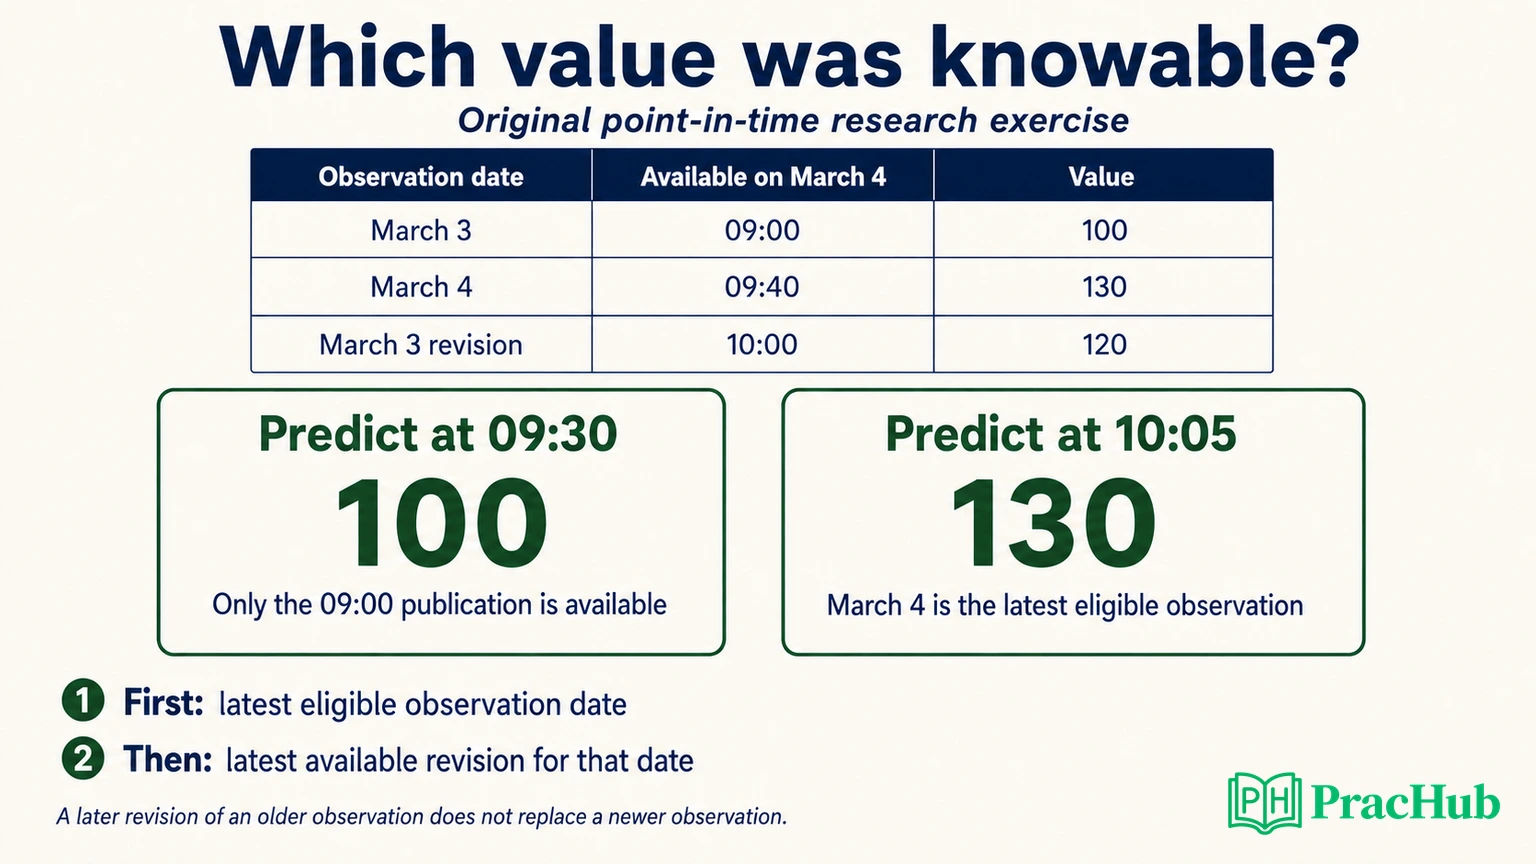
A vendor publishes a daily activity measure for one entity. Your prediction occurs on March 4 at 09:30. The feature contract is: choose the most recent observation date available by prediction time, then use the latest available revision for that date.
| Observation date | Available to your system | Value | Eligible at March 4, 09:30? |
|---|---|---|---|
| March 3 | March 4, 09:00 | 100 | Yes |
| March 3, revised | March 4, 10:00 | 120 | No: revision arrived later |
| March 4 | March 4, 09:40 | 130 | No: observation arrived later |
The correct value is 100. Joining on observation date alone can expose data that was not yet available. Deduplicating the vendor table to its final revision before reconstructing historical predictions can create the same problem.
Now move prediction time to 10:05. Under this contract, the answer is 130, because March 4 is the latest eligible observation date. A naive “latest publication wins” rule could select the March 3 revision of 120, published at 10:00. That is a different feature definition.
For a simple reference implementation, filter each entity’s records to available_at <= prediction_at, select the maximum observation date, then select the latest revision within that date. Define tie handling explicitly. If the same entity, observation date, and availability time carry conflicting values, reject the conflict or apply a documented revision rule. Do not let input order choose the answer.
The official pandas documentation describes merge_asof as supporting backward matches to the last key at or before the left key, with sorted merge keys and optional grouping. It is useful for an availability-ordered state table. However, you must first ensure each state represents the feature contract above; the function does not decide how old-period revisions should affect a newer observation. pandas merge_asof
Test a prediction before all publications, equality at the cutoff, multiple entities, an out-of-order input file, and the later revision of an older observation. Preserve the matched observation date and availability timestamp alongside the value. Those fields make the result explainable when a researcher challenges your backtest.
Statistics preparation: defend the conclusion, not only the formula
Recommended practice: For each statistical concept, prepare a definition, a calculation, and a failure case. Begin with expectation and variance, conditional probability, covariance, regression, confidence intervals, and hypothesis testing. Connect them to the research decision you are making rather than reciting a list of formulas.
For regression, explain the target and baseline before interpreting a coefficient. Distinguish predicting an outcome from establishing a causal effect. If two features are strongly correlated, discuss coefficient instability and what additional diagnostic would help. A coefficient’s sign alone does not tell you whether a feature will remain useful on new data.
For hypothesis testing, define the null and sampling assumptions. Explain that a small p-value is not the probability that the hypothesis is false, and does not measure practical value. If you tried many candidate features, reporting only the smallest p-value hides the search process. Keep an experiment record and reserve data that did not influence selection.
For time-dependent observations, question whether the rows provide independent evidence. Thousands of rows from the same dates or related entities may contain much less independent information than the row count suggests. Explain how you would examine performance by time period and entity, and how dependence affects uncertainty estimates. The objective is an honest account of what the sample supports.
Original validation comparison: when a promising feature disappears
Use this hypothetical research result to rehearse a model discussion. The numbers are invented for practice; they are not Voloridge performance figures or benchmarks.
| Evaluation setup | Hypothetical R² | Interpretation to investigate |
|---|---|---|
| Random row split using final revised vendor values | 0.31 | Future information and split design may inflate the result |
| Chronological validation using point-in-time values | 0.07 | More credible, but still a validation result used in development |
| Same chronological validation with the vendor feature removed | 0.00 | Possible incremental contribution, requiring further checks |
You changed both the data reconstruction and split design between the first two rows, so the drop does not isolate one cause. Repeat controlled comparisons if you want to attribute the difference. Also verify that all rows use the same target definition, eligible sample, and metric calculation before comparing them.
Fit imputation, scaling, and feature selection only on each training fold. Scikit-learn’s guidance recommends pipelines to keep learned transformations within the training boundary. A pipeline helps prevent preprocessing leakage, but cannot repair a feature table that already includes future revisions. Common pitfalls and recommended practices
For ordered data, a time-based splitter can train on earlier observations and evaluate later ones. Scikit-learn’s TimeSeriesSplit also exposes a gap parameter. For panel data, split by time boundaries across entities; for forward-looking labels, check when each training label becomes observable. A gap measured in rows may not match the target horizon or publication delay; verify those boundaries using timestamps. TimeSeriesSplit documentation
The next decision is whether the 0.07 result survives reasonable choices made without repeatedly tuning to the same validation period. Check subperiods, missing-data patterns, and a simpler baseline. After selecting the method, evaluate an untouched holdout once. If you redesign after seeing that result, treat the holdout as development data and disclose the change.
If you receive a take-home research task
The historical intern report makes a project worth preparing for; your invitation determines whether one applies. Recommended approach: first confirm the target, permitted data and tools, deadline, submission format, and expected level of explanation. If the brief leaves a modeling choice open, write down your assumption and proceed with a bounded baseline.
Keep the submission reproducible. Include an entry point, dependency information, data-handling notes, and a short explanation of how to regenerate the main result. Do not depend on hidden notebook state or manually edited intermediate files. Record randomness where it affects the experiment, while recognizing that one fixed seed does not establish robustness.
Use the report to explain a decision: what you tried, what evidence changed your view, and what remains uncertain. Include a failed hypothesis if it clarifies your reasoning. A modest result with a careful validity check can demonstrate better judgment than an impressive score whose provenance you cannot explain.
Five PracHub questions for focused preparation
These are cross-company practice records, selected for research-data handling and statistical explanation. They are not confirmed Voloridge questions; some full details may require access.
| PracHub question | Practice focus | Follow-up to rehearse |
|---|---|---|
| Apply Leakage-Safe Imputation and Ordinal Encoding | Training-only transformations | Explain what must be refitted inside each fold |
| Perform no-intercept linear regression from two datasets | Data alignment and regression assumptions | Defend the decision to omit an intercept |
| Resolve a Mismatch Between Regression and Classification Metrics | Target and metric consistency | Identify an ambiguous evaluation request before training |
| Evaluate Alternative Data for an Investment Pitch | Availability, provenance, and incremental value | Reconstruct the vendor-data cutoff in this article |
| Explain p‑values to a product manager | Clear statistical communication | Explain uncertainty without claiming proof |
Prepare a research explanation you can defend
Choose one project and rehearse a concise opening: the question, dataset, baseline, main result, and largest limitation. Then be ready for detailed follow-ups about preprocessing, sampling, failed approaches, and your individual contribution. The historical intern account specifically mentions past research; the current job also includes presenting work to researchers.
Finish your preparation with Apply Leakage-Safe Imputation and Ordinal Encoding, then explain why training-only preprocessing would still leave the 09:30 vendor revision bug unfixed. That distinction connects Python correctness to statistical validity—the central preparation theme for this data-focused internship.
Sources and Further Reading
- Voloridge: Quantitative Research Intern 2027 official listing
- Voloridge: recruiting process and internship overview
- Glassdoor: internship account published April 21, 2026
- Glassdoor: Quantitative Research Intern account published June 3, 2025
- pandas: merge_asof API documentation
- Scikit-learn: common pitfalls and recommended practices
- Scikit-learn: TimeSeriesSplit
Research checked September 7, 2026. Official 2027 role details are separated from historical candidate reports. Exercise data and scores are hypothetical; no fixed 2027 interview format or hiring timeline is established here.
Comments (0)