Web Performance Interview Questions: Core Web Vitals, Caching, and Rendering
Quick Overview
A practical web performance interview guide covering Core Web Vitals, HTTP caching, rendering, DevTools diagnosis, and production verification.
A page can earn a respectable Lighthouse score and still feel slow to real users. A fast laptop may hide a four-second hero image on mid-range mobile, while one long JavaScript task can make a page look ready but ignore the first click.
That gap is why strong web performance interview answers do more than recite “lazy-load images” or “use memoization.” Interviewers want to see whether you can connect a user-visible symptom to the right metric, isolate the expensive phase, choose a targeted fix, and prove that the experience improved.
Use PracHub's Frontend Engineer interview questions to practice that reasoning in realistic coding, debugging, and design prompts. This guide gives you a reusable framework for Core Web Vitals, HTTP caching, browser rendering, and production verification.
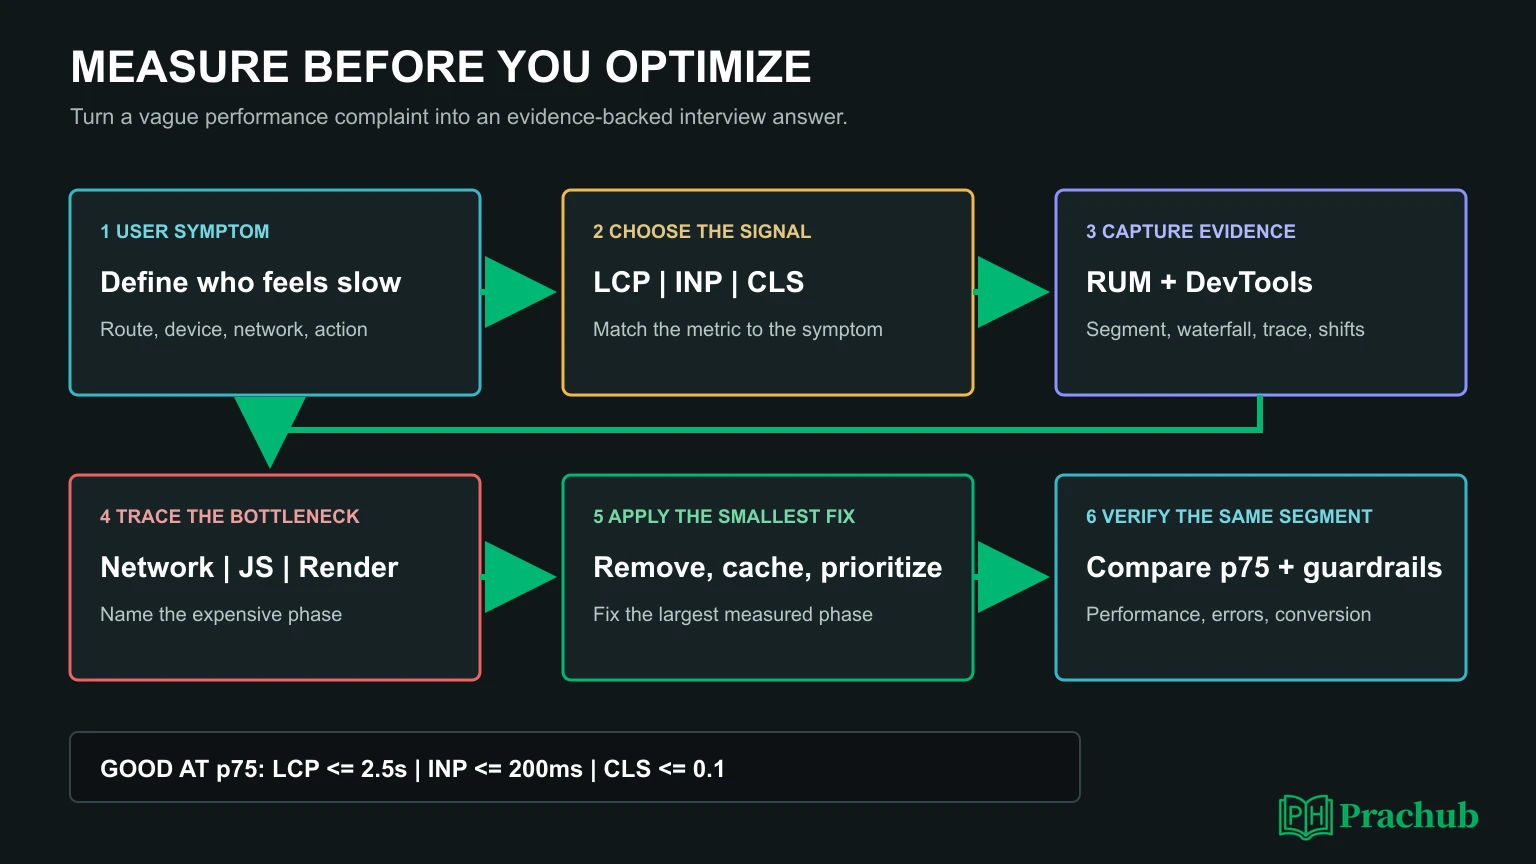
Quick answer: diagnose performance before prescribing fixes
A senior answer follows six steps: define the affected user journey, name the failing user-visible metric, reproduce it under representative conditions, trace the responsible network or main-thread work, apply the smallest high-impact fix, and repeat the same measurement.
The key is causal evidence. “The bundle is large” is an observation. “A route-level chunk blocks the main thread for 280 milliseconds before the checkout button can respond” is a diagnosis that supports a decision.
| User symptom | Primary signal | Evidence to inspect |
|---|---|---|
| Main content appears late | LCP, TTFB, FCP | LCP element, request waterfall, server timing, render delay |
| Clicks or typing feel delayed | INP and long tasks | Interaction breakdown, call stack, scripting, forced layout |
| Content jumps while loading | CLS | Layout-shift clusters, unstable elements, late inserts |
| Repeat visits are still slow | Cache hit rate and transfer size | Cache-Control, Age, ETag, 304s, CDN and browser-cache behavior |
How to explain Core Web Vitals in an interview
The current Core Web Vitals are Largest Contentful Paint (LCP), Interaction to Next Paint (INP), and Cumulative Layout Shift (CLS). Google classifies a page using the 75th percentile of page views. “Good” means LCP at or below 2.5 seconds, INP at or below 200 milliseconds, and CLS at or below 0.1.
LCP measures the main content's loading experience
LCP reports when the largest eligible content element in the viewport renders. In an interview, do not jump directly to image compression. Break LCP into possible server delay, resource discovery delay, resource download time, and render delay.
If the LCP image is discovered late, preload or prioritize that one resource. If the bytes are excessive, use responsive dimensions and a modern format. If the image is ready but hidden behind synchronous JavaScript or CSS, reduce render-blocking work. Do not lazy-load the actual LCP image merely because lazy loading sounds like a performance best practice.
INP measures interaction responsiveness
INP covers the delay from a user interaction until the browser can present the next frame. A useful breakdown is input delay, event-handler processing, and presentation delay. The cause may be a long task already occupying the main thread, expensive application code, or layout and paint after the handler finishes.
Good fixes include deleting unnecessary JavaScript, splitting long tasks, yielding between chunks, moving suitable computation to a worker, and reducing layout work. A Web Worker can help with CPU-heavy parsing or calculation, but it cannot manipulate the DOM or make an oversized layout cheap.
CLS measures unexpected visual instability
CLS is not “all movement.” It focuses on unexpected layout shifts. Common causes include images without reserved dimensions, ads that expand after load, web fonts that change text geometry, and banners inserted above existing content.
Reserve stable space, use predictable placeholders, avoid injecting content above what the user is reading, and animate with transforms when appropriate. Then inspect the actual shift cluster and affected element rather than guessing from a final screenshot.
Field data and lab data answer different questions
Field data describes experiences from real devices, networks, geographies, and sessions. Lab tools provide a controlled environment for reproducing a problem before release. A strong candidate uses both without pretending they are interchangeable.
Chrome DevTools can capture local LCP, CLS, and interactions that contribute to INP. Lighthouse cannot directly measure INP in a synthetic page load without user interaction, so Total Blocking Time is commonly used as a lab proxy. A green local trace does not disprove a poor p75 field metric; it may only mean you have not reproduced the affected segment.
HTTP caching interview questions that reveal seniority
Caching questions test correctness as much as speed. Begin by identifying the resource, who may store it, how long it stays fresh, how it is invalidated, and what happens when the origin is unavailable.
What is the difference between no-cache and no-store?
no-cache allows a response to be stored but requires validation before reuse. With an ETag, the server can return a small 304 Not Modified when the content is unchanged. no-store tells caches not to store the response. Using no-store everywhere can discard useful browser features and repeat unnecessary work.
How would you cache HTML, assets, and APIs?
Fingerprint static JavaScript, CSS, fonts, and images so they can use a long max-age with immutable. Let frequently updated HTML revalidate. Use s-maxage when a shared CDN needs a different freshness window from the browser, and use stale-while-revalidate only when briefly stale content is acceptable.
Personalized responses require extra care. Mark them private or prevent storage when the data demands it, and ensure cache keys include the dimensions that change the representation. A missing Vary dimension or authorization boundary can turn a performance optimization into a data leak.
Browser rendering interview questions: trace the pipeline
The critical rendering path turns HTML, CSS, and JavaScript into pixels. The browser builds the DOM and CSSOM, creates a render tree, calculates layout, paints pixels, and may composite layers. Different changes trigger different portions of that pipeline.
A classic problem is layout thrashing: code writes a style, immediately reads geometry such as offsetHeight, then repeats. The browser is forced to calculate layout synchronously many times. Batch reads before writes, reduce DOM size, and avoid animating properties that repeatedly change geometry when a transform can express the effect.
SSR, CSR, and hydration are trade-offs, not rankings
Server rendering can deliver useful HTML earlier, while client rendering may postpone visible content until JavaScript executes. Hydration combines server-rendered HTML with client interactivity, but heavy hydration can make a page look ready before it responds.
In an interview, choose based on content, personalization, interaction needs, cacheability, and operational cost. Streaming or partial hydration may improve the path, but architecture labels do not replace measurement of TTFB, LCP, JavaScript execution, and INP.
Worked scenario: a slow commerce product page
Assume real-user monitoring shows p75 LCP of 4.1 seconds for mid-range Android users on slower mobile networks. The desktop lab score is good. Start by segmenting the field data and confirming the affected route, device class, geography, and LCP element.
Next, reproduce the conditions and inspect the waterfall and Performance trace. If TTFB dominates, investigate server work, edge caching, and backend dependencies. If the hero request starts late, examine HTML discovery, client-only rendering, preload priority, and competing requests. If download time dominates, correct image dimensions and compression. If render delay dominates, inspect CSS, JavaScript, fonts, and hydration.
Choose one fix that attacks the largest phase, ship it behind a controlled rollout, and compare the same segment. Protect conversion, errors, accessibility, and visual quality as guardrails. This is a stronger answer than listing ten optimizations without knowing which one matters.
Worked scenario: typing freezes a large results table
Suppose every keystroke filters 50,000 rows, rebuilds thousands of DOM nodes, and triggers layout. The symptom is interaction latency, so record the interaction and separate input delay, JavaScript processing, and presentation work.
First avoid work: filter or aggregate on the server when the full dataset is unnecessary, virtualize the visible rows, cancel obsolete requests, and keep urgent input state separate from slower result updates. Memoization helps only when a repeated calculation or render boundary is both expensive and reusable. Re-profile the same dataset and interaction afterward.
Performance mistakes that weaken an interview answer
Optimizing before measuring is the most common mistake. Other weak signals include treating one Lighthouse run as production truth, preloading every asset, applying no-store to all responses, moving DOM work to a Web Worker, or using memoization without checking its cost and dependencies.
Another mistake is reporting an average after the fix. Performance distributions matter. Compare p50 and p75 or p95 for the same user segment, and explain what regression budget or alert would keep the gain from disappearing next month.
Practice web performance questions on PracHub
Attempt each prompt as a diagnosis. State the symptom, choose the metric, name the evidence you would collect, prioritize one fix, and describe the before-and-after verification.
| PracHub question | Practice focus | Why it helps |
|---|---|---|
| Diagnose Cold-Load and Massive-Table Performance in a Web App | Cold LCP, transfer, memory, virtualization | Forces an end-to-end diagnosis across network, JavaScript, rendering, and data ownership. |
| Debug and optimize React performance issues | Profiling, leaks, rendering, input latency | Connects framework symptoms to browser evidence and targeted fixes. |
| Implement, Debug, and Optimize a React Table | Large lists, memoization, virtualization | Tests whether performance choices preserve component correctness and API design. |
| Build and optimize a video playlist component | Media loading, shared state, large-list rendering | Adds resource-heavy UI constraints and practical performance trade-offs. |
A seven-day web performance interview plan
| Day and focus | What to do |
|---|---|
| Day 1: Metrics | Explain LCP, INP, and CLS, including thresholds, percentiles, and field-versus-lab limits. |
| Day 2: Network | Read a waterfall and separate DNS, connection, TTFB, discovery, download, and priority. |
| Day 3: Caching | Design policies for HTML, fingerprinted assets, public APIs, and personalized responses. |
| Day 4: Rendering | Trace DOM, CSSOM, layout, paint, compositing, and one forced-layout bug. |
| Day 5: JavaScript | Profile an interaction, identify a long task, and practice work avoidance, chunking, and workers. |
| Day 6: Scenarios | Solve the cold-load and large-table PracHub prompts under a 30-minute limit. |
| Day 7: Mock interview | Give one complete diagnosis with assumptions, evidence, prioritized fix, trade-offs, and verification. |
Frequently asked questions
What web performance topics are asked in frontend interviews?
Expect Core Web Vitals, network waterfalls, HTTP caching, image and font loading, JavaScript execution, browser rendering, list virtualization, SSR and hydration, profiling tools, and production monitoring. Senior rounds emphasize prioritization and trade-offs over memorized definitions.
Should I memorize the Core Web Vitals thresholds?
Know the current good thresholds and the 75th-percentile rule, but spend more time learning how to diagnose each metric. Interviewers gain more signal from a correct LCP or INP investigation than from numbers with no causal model.
Is Lighthouse enough to diagnose production performance?
No. Lighthouse is useful for repeatable lab checks and regression detection, but real-user data captures the diversity of production devices, networks, and behavior. Use lab evidence to debug and field evidence to understand impact.
Does memoization always improve frontend performance?
No. Memoization adds comparison, memory, and complexity. Use it when measurement shows expensive repeat work and inputs remain stable enough to reuse the result. Removing work or narrowing the rendered tree is often better.
What makes a web performance answer senior-level?
A senior answer defines the user and constraint, chooses a user-visible metric, gathers evidence, prioritizes the largest bottleneck, states costs and failure modes, and verifies the result with comparable field and lab measurements.
Final takeaway
Web performance interviews are not speed-tip quizzes. They test whether you can turn an ambiguous complaint into a measurable problem, understand the browser and network path, make one defensible change, and prove that users benefited.
Practice that complete loop with PracHub's Frontend Engineer interview questions. Narrate your evidence before your optimization, and every answer will sound more like production engineering and less like a checklist.
Sources and Further Reading
- web.dev: Web Vitals
- web.dev: How Core Web Vitals Thresholds Were Defined
- Chrome DevTools: Performance Panel Overview
- MDN: Critical Rendering Path
- MDN: HTTP Caching
- MDN: Cache-Control Header
- web.dev: Rendering on the Web
Research note: This guide was checked on August 22, 2026. Core Web Vitals definitions, browser tooling, and framework behavior can evolve, so verify current documentation when preparing for a specific interview.
Comments (0)