Causal Inference And Analysis Populations
Asked of: Data Scientist
Last updated
What's being tested
Interviewers are probing the candidate's ability to design, analyze, and defend randomized experiments that estimate causal effects of a free-trial/free-month treatment on downstream subscription and revenue metrics. Expect to show rigorous experiment design (unit of randomization, power, observation window), clear causal reasoning (ITT vs. triggered vs. complier effects), robust metric design (primary metric + guardrails), and practical diagnostics (SRM, attrition, contamination). OpenAI cares because product decisions hinge on credible lift estimates, reliable ROI calculations, and defensible tradeoffs between short-term costs and long-term value.
Core knowledge
-
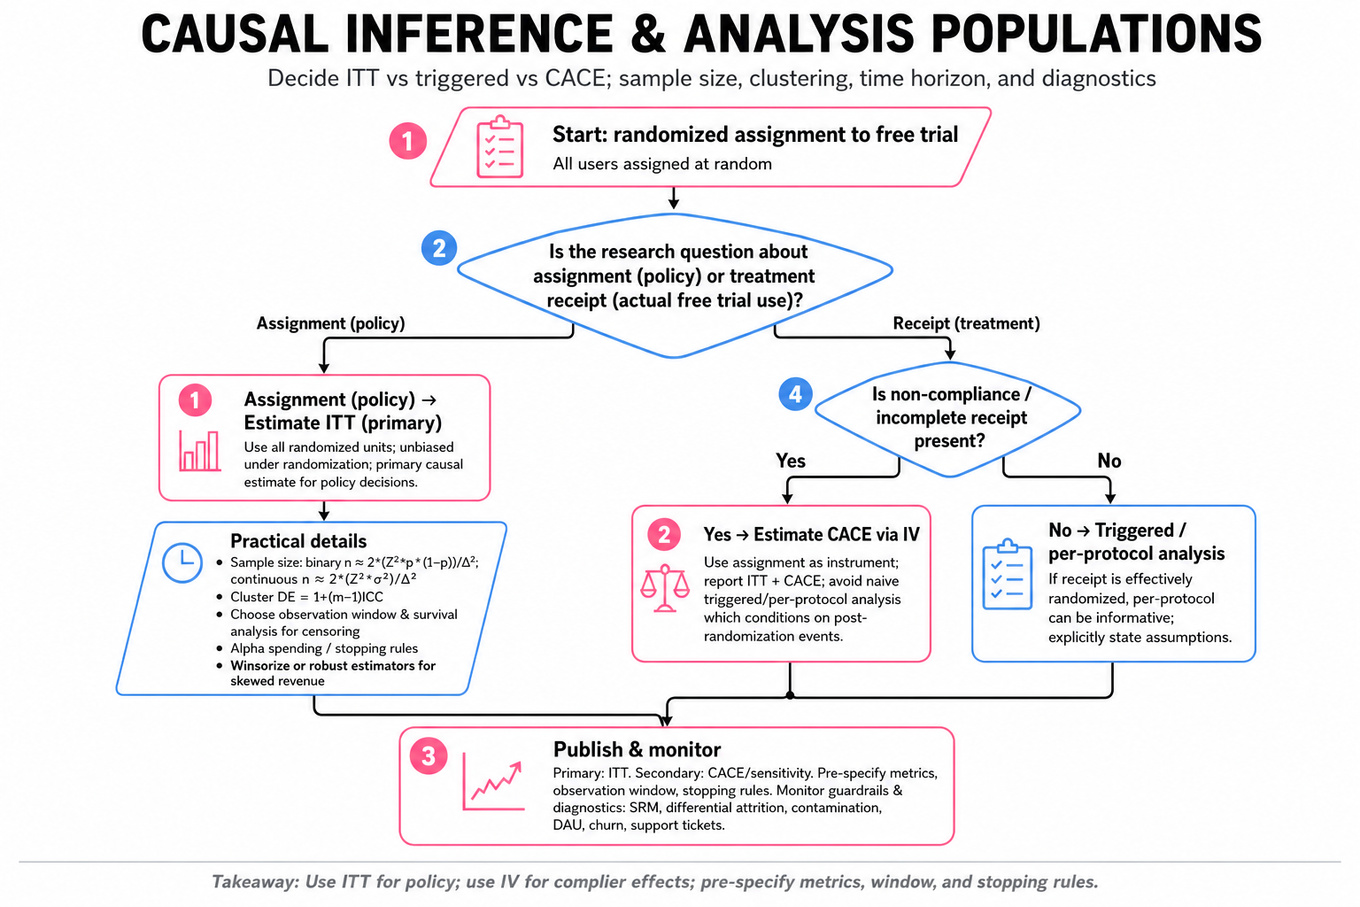
Intent-to-treat (ITT): ITT estimates effect of assignment on outcome for all randomized units; unbiased under randomization even with non-compliance. Use ITT as primary causal estimate for policy decisions.
-
Triggered / per‑protocol vs. CACE: Triggered analyses restrict to users who actually experienced treatment; this conditions on post-randomization events and is biased for causal effect unless you estimate complier-average causal effect (CACE) via instrumental variables using assignment as instrument.
-
Sample size for binary outcomes: For two proportions , per-arm . Plug realistic baseline and minimum detectable effect (MDE).
-
Continuous outcomes and variance: For mean differences, . If unknown, pilot or use historical
revenue per uservariance; heavy right-tail revenue often needs winsorizing or robust estimators. -
Clustering and design effect: If randomizing by group, multiply by DE = 1 + . Estimate ICC from past data; even small ICCs inflate required sample size for large clusters.
-
Time horizon, censoring, delayed effects: Choose observation window to capture conversion delays; use survival analysis (Kaplan–Meier, Cox) when censoring common; report cumulative incidence at pre-specified horizons.
-
Multiple testing & sequential monitoring: Pre-specify primary metric and stopping rules. Use alpha spending (O’Brien–Fleming) or always-valid p-values to avoid inflated Type I error with peeking.
-
Guardrail metrics & harms: Define guardrails (e.g.,
DAU, churn, support ticket rate) and safety thresholds. Monitor SRM (sample ratio mismatch), differential attrition, instrumentation errors fromPostgresor event pipelines. -
SUTVA and interference: Check for spillovers/contamination (e.g., referrals, team accounts). If interference likely, consider cluster randomization or network-aware estimands.
-
Business ROI and LTV modeling: Translate lift into expected net benefit: NetBenefit = Δconversion * ARPU_lifetime − cost_of_free_trial. When conversion impacts long-term retention, simulate LTV under multiple retention scenarios rather than relying only on short-window conversion.
Worked example — Design a free-month experiment
Frame quickly: ask target population (new users vs. all), unit of randomization (user vs. account), business objective (short-term revenue vs. lifetime retention), and constraints (budget, anti-fraud, legal). Organize response around four pillars: (1) Primary metric and guardrails — e.g., 30‑day subscription conversion rate (primary), DAU and support cost as guardrails; (2) Randomization & populations — user-level randomization, ensure deterministic assignment, record assignment timestamp; (3) Power & timeline — compute MDE using baseline conversion, sample size formula, adjust for clustering/attrition; (4) Analysis plan — pre-specify ITT as primary, report CACE with IV as secondary, survival curves for delayed conversions. Flag tradeoff: longer observation windows capture downstream subscriptions but increase experiment duration and exposure cost; shorter windows reduce power for infrequent conversions. Close: "If I had more time, I'd run simulations on user-level conversion latency, estimate heterogeneous effects by cohort, and build an LTV model to compute payback period."
A second angle — Design and analyze a free-trial A/B test
Here the analytical emphasis shifts toward triggered analyses, treatment take-up, and time-to-conversion. You should still pre-specify ITT primary, but plan secondary analyses: estimate CACE with two-stage least squares to recover effect on compliers, use survival analysis for time-varying hazard of subscription, and check proportional-hazards assumptions. Also prepare SQL cohort queries that account for deduplication, first-exposure time, and right-censoring, and plan for heterogeneity checks (e.g., geography, platform) to inform rollout decisions.
Common pitfalls
Pitfall: Conditioning on post-randomization events (analyzing only users who activated the trial) — this yields selection bias; present ITT first and use IV/CACE to address compliance.
Pitfall: Reporting p-values without business context — a statistically significant 0.2% lift may be economically meaningless once free-trial costs and churn are included; always translate to dollars/ARPU and payback.
Pitfall: No pre-specification or flexible stopping — ad-hoc peeking inflates false positives; name the primary metric, analysis population, horizon, and stopping rule up front, and follow it.
Connections
Interviewers may pivot to sequential testing & monitoring (always-valid inference), causal heterogeneity / uplift modeling (segment-level treatment effect estimation), or instrumental variable / principal stratification methods when compliance or triggering is central.
Further reading
-
[A Practical Guide to Controlled Experiments on the Web (Kohavi et al.)] — classic field-guide on online A/B best practices, metrics, and pitfalls.
-
[Always‑Valid Inference for Sequential Testing (Johari, Pekelis, Walsh)] — concise overview of optional stopping and always-valid p-values for experimentation.
Practice questions
- Design a free-month experimentOpenAI · Data Scientist · Technical Screen · hard
- Write SQL for post-trial conversion cohortsOpenAI · Data Scientist · Technical Screen · medium
- Design and analyze a free-trial A/B testOpenAI · Data Scientist · Technical Screen · hard
- How would you evaluate a free-trial A/B test?OpenAI · Data Scientist · Technical Screen · medium
- Determine Metrics to Measure Free-Trial Impact on SubscriptionsOpenAI · Data Scientist · Online Assessment · medium
Related concepts
- Causal InferenceAnalytics & Experimentation
- Causal Inference And IdentificationStatistics & Math
- Causal Inference, Confounding, And MatchingAnalytics & Experimentation
- Causal Inference, Difference-In-Differences, And Cannibalization
- Causal Inference And Quasi-ExperimentsAnalytics & Experimentation
- Causal Inference And ConfoundingStatistics & Math