Logistic Regression And Imbalanced Classification
Asked of: Data Scientist
Last updated
What's being tested
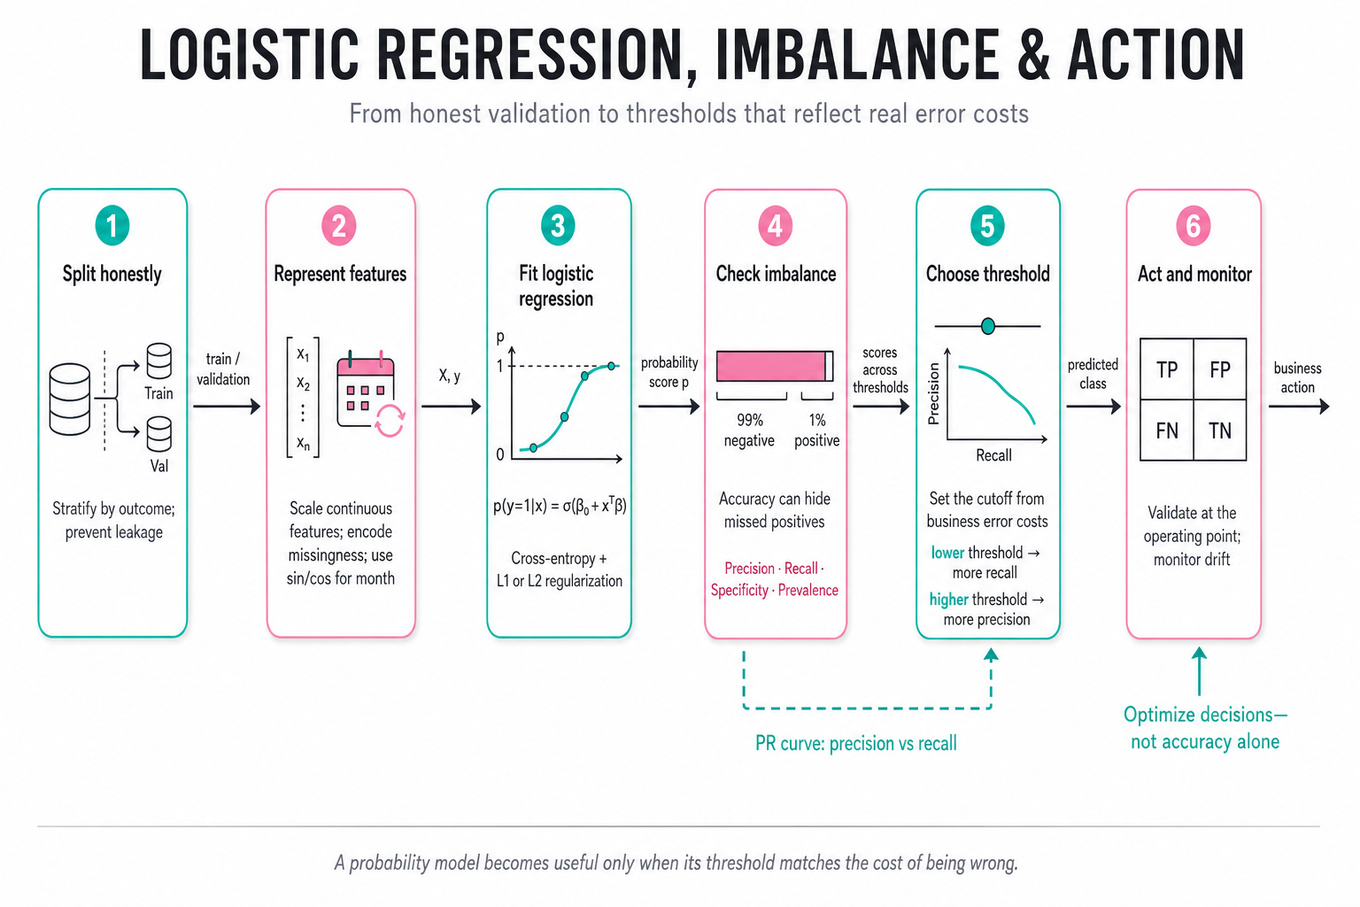
These questions test whether you can connect logistic regression, imbalanced classification, and decision-making under asymmetric error costs, rather than reciting model definitions. You should be able to diagnose whether poor performance comes from data leakage, feature representation, regularization, class imbalance, threshold choice, or genuine underfitting. Google cares because deployed classifiers influence user experiences and operational decisions, so a Data Scientist must select metrics, validate honestly, and translate probabilities into business actions.
Core knowledge
-
Logistic regression models the positive-class probability as , where . The log-odds are linear: , making coefficients interpretable but limiting nonlinear interactions.
-
Training usually minimizes cross-entropy loss: . It strongly penalizes confident wrong predictions and estimates probabilities well when labels, features, and regularization are appropriately specified.
-
L1 regularization adds and can produce sparse coefficients, useful for many correlated or weak features; L2 regularization adds and usually distributes weight more smoothly. Tune using leakage-safe cross-validation.
-
Feature scaling is not required for tree splits, but it matters for gradient-based logistic optimization and makes regularization comparable across coefficients. Standardize continuous features, handle missingness explicitly, and encode categorical variables consistently between training and evaluation.
-
Calendar variables require representation care: month encoded as integers creates a false distance between December and January. Encode cyclic seasonality as and , or use appropriate one-hot indicators when month effects need not be smooth.
-
Class imbalance makes accuracy misleading: predicting every example as negative can achieve 99% accuracy with a 1% positive rate while detecting nothing. Report the confusion matrix, prevalence, precision, recall, specificity, and metrics at an operationally meaningful threshold.
-
Precision–recall curves plot precision against recall as the score threshold varies. Precision is and recall is ; average precision or AUPRC is often more informative than AUROC when positives are rare because it reflects false-positive burden among predicted positives.
-
AUROC measures ranking quality across all thresholds: , approximately. It can look strong with extreme imbalance even when precision is unusable, so pair it with AUPRC, prevalence, precision at a required recall, or recall at a fixed review capacity.
-
Calibration asks whether predicted probabilities match observed frequencies: among cases assigned probability 0.8, roughly 80% should be positive. Use reliability diagrams, calibration slope/intercept, Brier score, or held-out calibration methods such as Platt scaling or isotonic regression.
-
Threshold selection is a decision problem, not a default modeling fact. With false-positive cost and false-negative cost , choose the threshold using expected cost, capacity, or service-level constraints; never tune it on the test set.
-
Imbalance can be addressed with class-weighted loss, resampling, or thresholding. Class weights alter the optimization objective and may distort probability calibration; oversampling must occur inside each training fold, never before splitting, or duplicate examples can leak across validation data.
-
Validation must match the deployment unit and time direction. Use grouped splits when multiple rows belong to one user, domain, or document, and temporal splits when future information would be unavailable at prediction time; otherwise metrics can be dramatically overstated.
-
Random forests capture nonlinearities and interactions with little feature scaling, but can overfit small datasets, produce less smooth probabilities, and be difficult to interpret. Logistic regression often wins when labels are limited, effects are approximately additive, and calibrated extrapolation matters.
-
Diagnose underfitting through high training and validation error, residual structure, or systematically poor performance across subgroups. Diagnose overfitting through a large train–validation gap, unstable coefficients, performance collapse under temporal or grouped validation, and improvement from stronger regularization.
Worked example
For “Identify and Fix Predictive Model Performance Gaps,” I would first clarify the target, prediction horizon, positive-class prevalence, deployment threshold, and whether the reported gap is between training and validation, segments, or time periods. I would organize the response around four pillars: audit the split and label definition for leakage, correct feature representation such as cyclical month encoding, standardize features and tune regularization, and evaluate imbalance with recall, precision, AUPRC, calibration, and threshold-specific costs. I would explicitly ask whether the model must rank cases or make a fixed action, because that determines whether ranking metrics or thresholded confusion-matrix metrics dominate. If recall is the priority, I might use class-weighted cross-entropy or select a lower threshold, while warning that this can sharply increase false positives and may require recalibration. I would compare results under a grouped or temporal holdout if repeated entities or future prediction are involved. I would close by saying that, given more time, I would inspect subgroup calibration, confidence intervals from bootstrap or repeated splits, and error examples near the selected threshold.
A second angle
For “Compute precision–recall curve on imbalanced data,” the framing shifts from debugging a model to constructing a trustworthy evaluation procedure. I would preserve continuous scores, sort examples by descending score, and compute cumulative true positives and false positives at each distinct threshold rather than evaluating only 0.5. I would emphasize that the baseline precision equals the positive prevalence, so AUPRC must be interpreted relative to that baseline and the operational cost of review. I would also distinguish average precision from trapezoidal interpolation and report a selected operating point, such as recall at a precision floor.
Common pitfalls
Pitfall: Saying “use accuracy because the model is 99% accurate” ignores prevalence and can reward an all-negative classifier. Report a confusion matrix and choose metrics tied to the action cost or capacity.
Pitfall: Treating AUROC as sufficient for rare-event detection is analytically incomplete. A model can rank positives well while producing unacceptable precision; add AUPRC and threshold-specific performance.
Pitfall: Listing class weights, SMOTE, and threshold tuning without explaining validation or calibration sounds memorized. State where each operation occurs, how the threshold is selected, and what tradeoff it creates.
Connections
An interviewer may pivot to cost-sensitive learning, probability calibration, survival or time-to-event modeling, fairness across subgroups, or drift monitoring. Be ready to distinguish population-level discrimination from subgroup reliability and from causal claims about interventions.
Further reading
-
“The Precision-Recall Plot Is More Informative than the ROC Plot When Evaluating Binary Classifiers on Imbalanced Datasets” — Davis and Goadrich’s classic comparison of ROC and precision–recall evaluation.
-
“Predicting Probabilities with Supervised Learning” — Practical treatment of calibration and probability quality.
-
The Elements of Statistical Learning, Hastie, Tibshirani, and Friedman — Chapters 4, 7, and 9 for logistic regression, model assessment, and additive/nonlinear methods.
Practice questions
- Compute precision–recall curve on imbalanced dataGoogle · Data Scientist · Technical Screen · medium
- Build and evaluate bad-link classifierGoogle · Data Scientist · Technical Screen · medium
- Handle highly imbalanced classification dataGoogle · Data Scientist · Technical Screen · medium
- Explain logistic regression vs forests and boostingGoogle · Data Scientist · Technical Screen · hard
- Detect Overfitting or Underfitting in Logistic Regression ModelsGoogle · Data Scientist · Technical Screen · medium
- Compare Logistic Regression and Random Forest in Limited Data ScenariosGoogle · Data Scientist · Onsite · medium
- Build Classifier: Evaluate with AUROC for Imbalanced DataGoogle · Data Scientist · Technical Screen · medium
- Identify and Fix Predictive Model Performance GapsGoogle · Data Scientist · Technical Screen · medium
Related concepts
- Logistic Regression, Regularization, And Imbalanced ClassificationMachine Learning
- Classification Thresholds, Imbalanced Learning And RiskMachine Learning
- Supervised ML, Imbalance, Overfitting, And OptimizationMachine Learning
- Evaluation, Statistical Inference, And Class ImbalanceMachine Learning
- Logistic Regression And Linear ModelsMachine Learning
- Supervised ML Fundamentals, Evaluation And Feature EngineeringMachine Learning