YouTube Engagement And Quality Analytics
Asked of: Data Scientist
Last updated
What's being tested
These cases test whether you can turn ambiguous product questions into measurable outcomes, credible comparisons, and actionable diagnoses. You must connect metric definitions, randomization, causal inference, segmentation, and model adjustment rather than treating engagement as a single number. Google cares because small measurement errors can drive decisions affecting ranking, advertising quality, creator incentives, and billions of viewing sessions.
Core knowledge
-
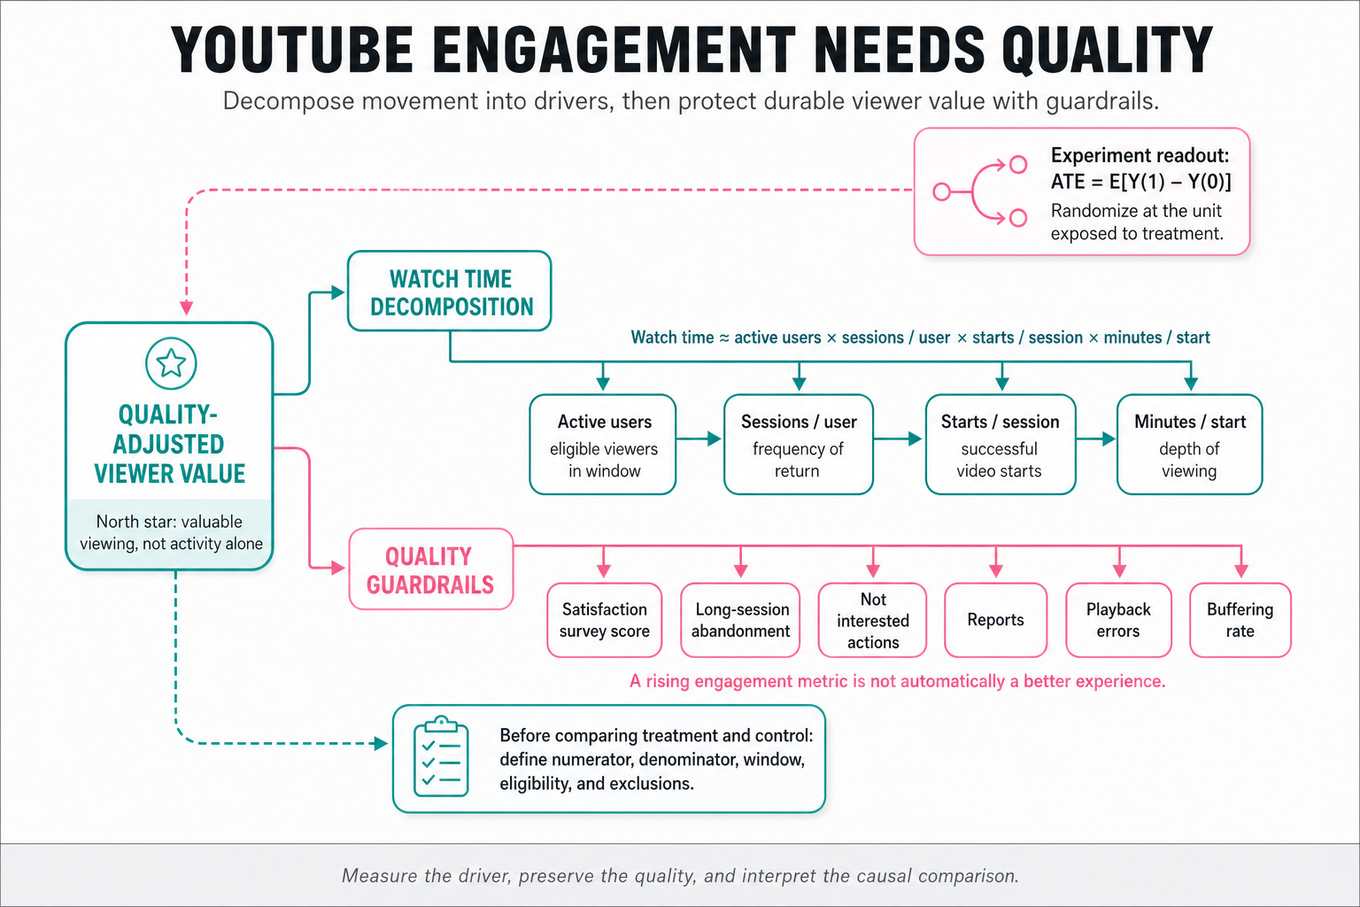
Metric trees decompose
DAUor watch time into interpretable factors: active users × sessions per user × starts per session × minutes per start. Define numerator, denominator, window, eligibility, and exclusions before analyzing movement. -
North-star metrics should represent durable user value, not merely activity. Pair watch time or successful video starts with quality guardrails such as satisfaction surveys, long-session abandonment, “not interested” actions, reports, errors, and buffering.
-
Randomized controlled experiments estimate an average treatment effect: . Randomize at the unit exposed to treatment—viewer, session, device, or region—and choose the unit to limit contamination and interference.
-
Interference violates the usual stable-unit assumption when one viewer’s treatment changes another viewer’s outcomes, such as shared recommendations or social viewing. Consider user-level assignment, cluster randomization, geo experiments, or exposure-based analyses, while acknowledging reduced power.
-
Power analysis depends on baseline variance, minimum detectable effect, significance level, and traffic allocation. For a proportion, approximate standard error is ; use historical variance and account for clustering, repeated users, and multiple primary metrics.
-
Latency experiments should distinguish client-perceived video-start latency from backend request latency. Analyze treatment effect on starts, watch time, retention, and abandonment, while guarding against buffering, playback errors, startup quality, and users receiving fewer starts because they quit earlier.
-
Mixed-effects regression separates systematic item differences from reviewer severity: , where is an ad fixed effect and is a reviewer random effect. Adjusted ad scores remove estimated reviewer composition bias.
-
Shrinkage in hierarchical models pulls noisy reviewer or ad estimates toward the population mean, especially with few observations. Validate with held-out reviewers, residual checks, calibration, and sensitivity to random-effect distributions; do not present adjusted scores as causal truth automatically.
-
Ordinal outcomes such as one-to-five ratings may violate linear-regression assumptions. Compare linear mixed models with cumulative-logit mixed models, inspect whether conclusions and rankings are stable, and communicate whether the score is predictive, descriptive, or decision-oriented.
-
Segmentation and cohorts localize changes by platform, country, app version, acquisition channel, new versus returning users, device class, and exposure to launches. Pre-specify meaningful segments, control false discoveries, and distinguish composition shifts from within-segment behavior changes.
-
Instrumentation validation precedes causal storytelling: reconcile client and server counts, inspect event coverage, compare stable dashboards, and check timestamp or definition changes. Upstream logs and experiment-exposure tables are evidence sources to query, not pipeline components to redesign.
Worked example
For “Design tests to measure latency impact,” I would first clarify which latency—tap-to-first-frame, time to playable, or request completion—is changing, and whether the goal is engagement, satisfaction, or both. I would state that the primary outcome is a pre-specified metric such as successful starts per eligible session or watch time per user, with startup abandonment and buffering as guardrails. My answer would have four pillars: treatment assignment, power and analysis, quality diagnostics, and heterogeneity or long-term effects. I would randomize at the viewer level if treatment can persist across sessions, define eligibility before exposure, and use intention-to-treat as the primary estimate. I would explicitly flag the tradeoff between session-level randomization, which may increase contamination, and user-level randomization, which improves treatment consistency but requires more users and can create persistent user experience differences. I would verify balance, estimate confidence intervals, inspect quantiles and early exits, and check that reduced startup latency is not purchased through worse playback stability. I would segment by device, network type, geography, and new versus returning viewers, but treat those results as exploratory unless powered or corrected. If I had more time, I would add a longer holdout to test retention and examine whether repeated exposure changes behavior.
A second angle
For “Diagnose YouTube Usage Decline: Key Metrics and Segmentation,” the same discipline applies without a randomized treatment: first establish whether the decline is real, then decompose it into population, frequency, and per-session components. The main challenge is separating instrumentation or denominator changes from genuine behavior, so compare multiple independent definitions and unaffected reference metrics. Segmentation becomes a hypothesis-generation tool rather than proof of causality; a platform-specific decline may reflect rollout exposure, user composition, or an external outage. The strongest close proposes a targeted experiment or quasi-experimental comparison to validate the suspected cause.
Common pitfalls
Pitfall: Treating watch time as unambiguously positive. More minutes can result from slower playback, compulsive low-quality consumption, or fewer alternative activities; pair it with satisfaction and quality guardrails and explain the decision metric.
Pitfall: Saying “randomize users and compare means” without defining exposure, interference, power, or the primary metric. A stronger answer names the assignment unit, estimand, analysis population, confidence interval, and failure modes that could invalidate interpretation.
Pitfall: Overclaiming from a mixed-effects model or a descriptive segment. Reviewer random effects can adjust composition bias, but they do not prove rating validity; similarly, a declining Android cohort does not establish that an Android change caused the overall decline.
Connections
An interviewer may pivot to sequential testing, multiple-hypothesis correction, difference-in-differences, survival analysis, or ranking evaluation. Be ready to connect product metrics to offline relevance measures such as NDCG while explaining why online user outcomes remain the decision criterion.
Further reading
-
Trustworthy Online Controlled Experiments — Ron Kohavi, Diane Tang, and Ya Xu’s practical treatment of experimentation, guardrails, power, and novelty effects.
-
The Design and Analysis of Split-Plot Experiments — useful grounding for clustered assignment and dependence structures.
-
Gelman and Hill, Data Analysis Using Regression and Multilevel/Hierarchical Models — a rigorous reference for partial pooling and mixed-effects modeling.
Practice questions
Related concepts
- Facebook Product AnalyticsAnalytics & Experimentation
- Instagram Product AnalyticsAnalytics & Experimentation
- Ads Ranking And Monetization AnalyticsAnalytics & Experimentation
- Video Calling And Group Calls Product AnalyticsAnalytics & Experimentation
- Cohort, Retention, Funnel And Product MetricsAnalytics & Experimentation
- Feed And News Feed AnalyticsAnalytics & Experimentation