DoorDash Analytics Engineer Interview: SQL, Data Modeling, and Business Partner Cases
Quick Overview
Prepare for DoorDash Analytics Engineer interviews with SQL, data modeling, dashboard, and business-partner practice. Separate official role requirements from candidate reports, then work through a tested delivery-event example and a clear metric contract.
A DoorDash Analytics Engineer interview can test more than whether your SQL runs. You may need to explain why a delivery appears twice, why two teams report different rates, and whether yesterday's dashboard should change when an event arrives late. Prepare to connect the query, the data model, and the decision someone will make from the result.
The evidence supports practicing SQL, programming, reusable datasets, and business communication. It does not establish one worldwide interview sequence. Below, official facts, candidate reports, and original preparation exercises are labeled separately. Start with PracHub's DoorDash Analytics Engineer questions, then use the delivery example to test your reasoning beyond a memorized answer.
What Is Verified About the Role and Interview?
Official role evidence: DoorDash's Hyderabad, India Analytics Engineer posting describes canonical datasets, reliable ETL/ELT pipelines, metrics, dashboards, and collaboration with technical and business teams. It asks for strong SQL, comfort with a language such as Python or Scala, and data-quality experience. This particular vacancy asks for five or more years of relevant experience; those requirements do not define every DoorDash AE opening. DoorDash Analytics Engineer, India
Candidate reports: Two different March 2026 accounts describe completed technical screens. A March 13 post reports four SQL questions and one Python question on CodeLink. A March 6 post reports five SQL and two Python questions on HackerRank. Their locations and levels are not established, and neither provides a verified evaluation rubric. Treat the differences as a reason to confirm your invitation's format, not as numbers to average into a standard screen. March 13 report, March 6 report
Historical candidate report: An October 2025 experience, curated by PracHub, describes modeling, an ETL project discussion, a business-partner case, and behavioral questions. A September 2, 2026 post separately lists modeling, dashboard, business-case, and leadership topics for an upcoming loop. The latter is an invitation-stage account asking for guidance, not a completed-loop review. Neither proves that your onsite has four identical rounds. October 2025 experience, September 2026 preparation post
Preparation inference: Give SQL and data modeling substantial practice time, keep Python fundamentals active, and rehearse business explanations. Ask your recruiter which rounds, tools, and deliverables apply to your role. Do not transfer a Data Scientist or Software Engineer preparation guide wholesale into an AE plan.
Start SQL Practice by Defining the Delivery Metric
Original exercise: A partner asks, “What percentage of yesterday's deliveries were late?” Before writing a query, define “deliveries,” the comparison timestamp, and the reporting cutoff. The following schema and numbers are synthetic; they are not DoorDash's internal metric or a reported interview prompt.
For this exercise, use orders created on September 1 in UTC. Count an order as late when its completed-delivery timestamp is strictly later than the promise recorded at checkout. An order completed exactly at the promise is on time. The denominator includes completed orders with both timestamps available.
Cancellations and in-progress orders are outside that denominator. Missing promises and missing completion events must appear in separate quality counts. Otherwise, a clean-looking percentage could conceal a broken feed.
Our fixture uses six orders. At the first reporting cutoff, September 2 at midnight UTC, their states are:
| Order | Treatment in the metric |
|---|---|
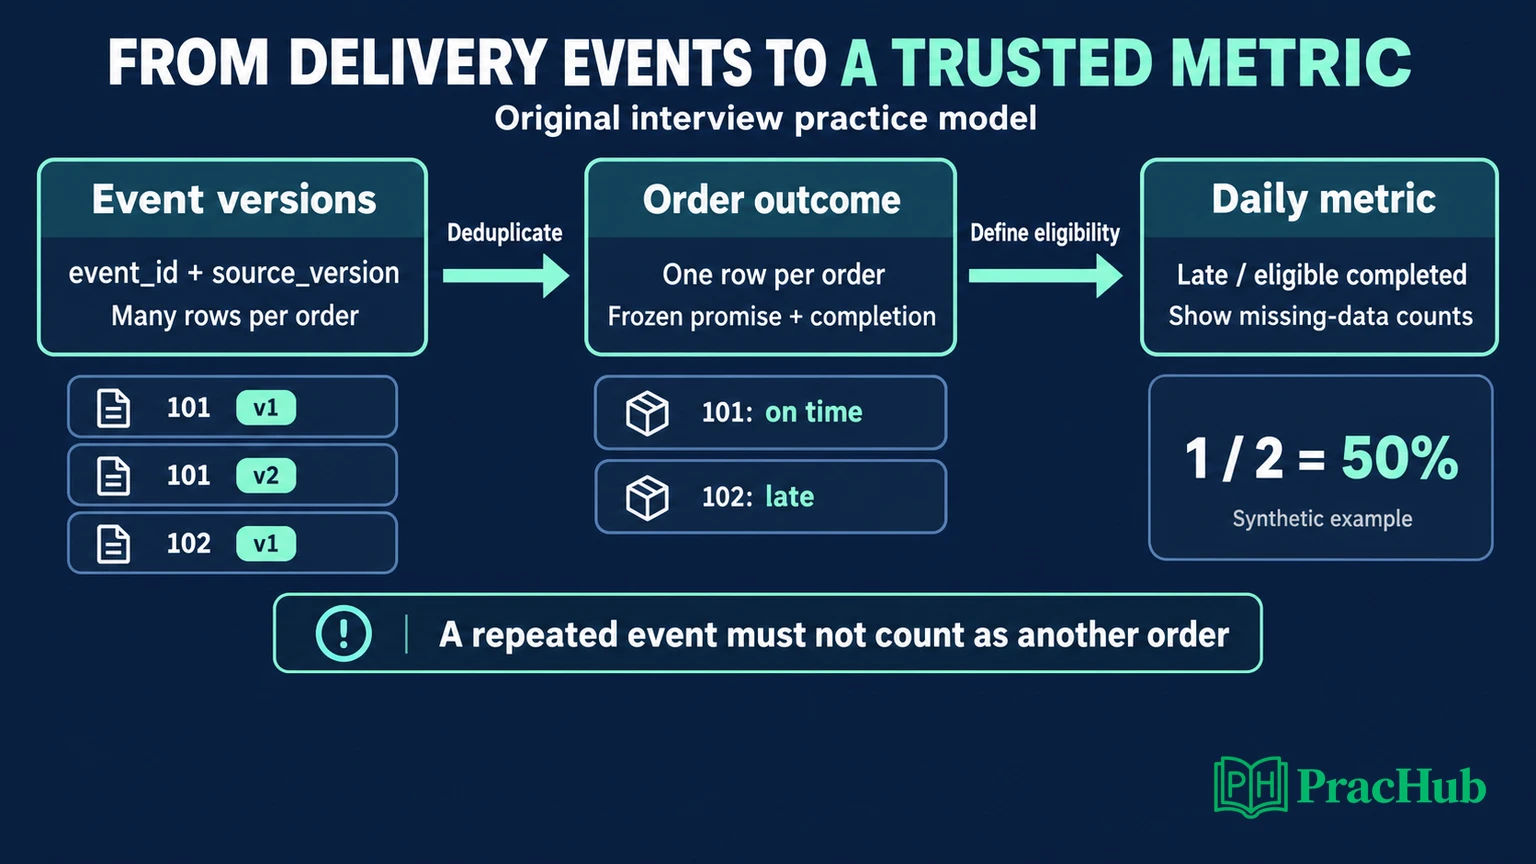
| 101 | On time; its completion event has two source versions. Count the order once. |
| 102 | Late; count it in both numerator and denominator. |
| 103 | Cancelled; exclude from this rate and track separately. |
| 104 | Completed, but missing its promise; exclude and flag. |
| 105 | In progress; exclude from the completed-order rate. |
| 106 | Marked delivered, but its completion event has not arrived; exclude and flag. |
The expected result is one late order out of two eligible orders: 50%. This denominator is part of the answer. A query that returns 50% without explaining the excluded records has not finished the analytical task.
Write SQL That Preserves One Row per Order
Original model: orders contains one row per order with order_id, created_at, promised_at, and status. The event table contains event_id, source_version, order_id, event_type, event_ts, and ingested_at. A logical event can have multiple source versions; the latest available version wins.
We executed the query below with SQLite 3.51.0. All fixture timestamps use the same sortable UTC text format. :as_of is a bound timestamp parameter, initially 2026-09-02 00:00:00. The orders table is a fixed reporting snapshot; only event availability changes in this small exercise.
WITH ranked AS (
  SELECT *, ROW_NUMBER() OVER (
    PARTITION BY event_id
    ORDER BY source_version DESC, ingested_at DESC
  ) AS rn
  FROM delivery_events
  WHERE ingested_at <= :as_of
), completed AS (
  SELECT order_id, MIN(event_ts) AS delivered_at
  FROM ranked
  WHERE rn = 1 AND event_type = 'delivered'
  GROUP BY order_id
), eligible AS (
  SELECT o.order_id, DATE(o.created_at) AS order_day,
         CASE WHEN c.delivered_at > o.promised_at
              THEN 1 ELSE 0 END AS is_late
  FROM orders o
  JOIN completed c ON c.order_id = o.order_id
  WHERE o.status = 'delivered'
    AND o.promised_at IS NOT NULL
)
SELECT order_day, COUNT(*) AS eligible_orders,
       SUM(is_late) AS late_orders,
       ROUND(100.0 * SUM(is_late) / COUNT(*), 2)
         AS late_pct
FROM eligible
GROUP BY order_day;
The source contract makes (event_id, source_version) unique. The completion rule chooses the earliest successful delivery event after resolving versions. If a real prompt allows redelivery, invalidated completions, or different attempt semantics, clarify that rule before using MIN.
Observed result: The query returns September 1, two eligible orders, one late order, and 50.0%. A deliberately incorrect join against every available event version returns 33.33%, because the on-time order is counted twice. Adding DISTINCT at the end is not a substitute for deciding the correct grain.
We also verified that removing the superseded version does not change the correct result and that rerunning with the same cutoff gives the same output. An empty eligible set produces no grouped row; a dashboard should represent that as no eligible data, not invent a zero-percent rate. The SQL window-function syntax is documented by SQLite.
Before discussing performance, verify correctness at each intermediate grain. Then inspect the plan in the actual warehouse. Filter the requested order cohort early when that is safe, but retain the event history needed to resolve its versions. Filtering only on a recent event date can silently discard a correction to an older order. Explain the trade-off between scanning less data and preserving the metric contract.
For Python preparation, practice explaining a short algorithm with lists, dictionaries, and boundary cases as well as reading tabular transformations. The historical AE account includes a fixed-window coding task; that does not establish that every Python screen uses the same pattern. Confirm the permitted language and environment rather than assuming pandas is required.
Defend the Model When History Changes
Original follow-up: Order 106's late completion arrives at 01:00 on September 2. Rerunning with a September 3 cutoff produces two late orders out of three eligible orders: 66.67%, still attributed to September 1. Our fixture executed and checked that result.
The delivery did not become late on September 2. The system learned about its September 1 outcome later. Distinguish event time from ingestion time, and explain whether the dashboard shows a frozen report or a restated historical series.
For a reusable model, keep raw versions available for investigation, derive an order-level outcome table, and build the daily aggregate from that table. These are preparation recommendations, not a claim about DoorDash's warehouse design. Store or reconstruct the promise used for evaluation; comparing against a revised ETA could change the meaning of “late.”
For a broader delivery case, separate order, delivery-attempt, support-ticket, and refund facts. State each grain before joining. Multiple attempts or tickets per order can multiply counts even when every source table is internally correct. Aggregate to the required grain or define a bridge before combining them.
Then explain how you would protect the model: unique order keys, valid event references, completion timestamps that follow creation, explicit missing-data counts, and reconciliation between source and modeled totals. For incremental processing, identify affected historical order dates and rebuild their aggregates when corrections arrive. A freshness timestamp alone cannot prove completeness.
Handle a Business Partner Who Wants a Different Denominator
Original case: Operations wants a completed-delivery reliability rate. A commercial partner wants to include cancelled orders because customers still experienced a failed purchase. Both concerns can be valid; the two rates answer different questions.
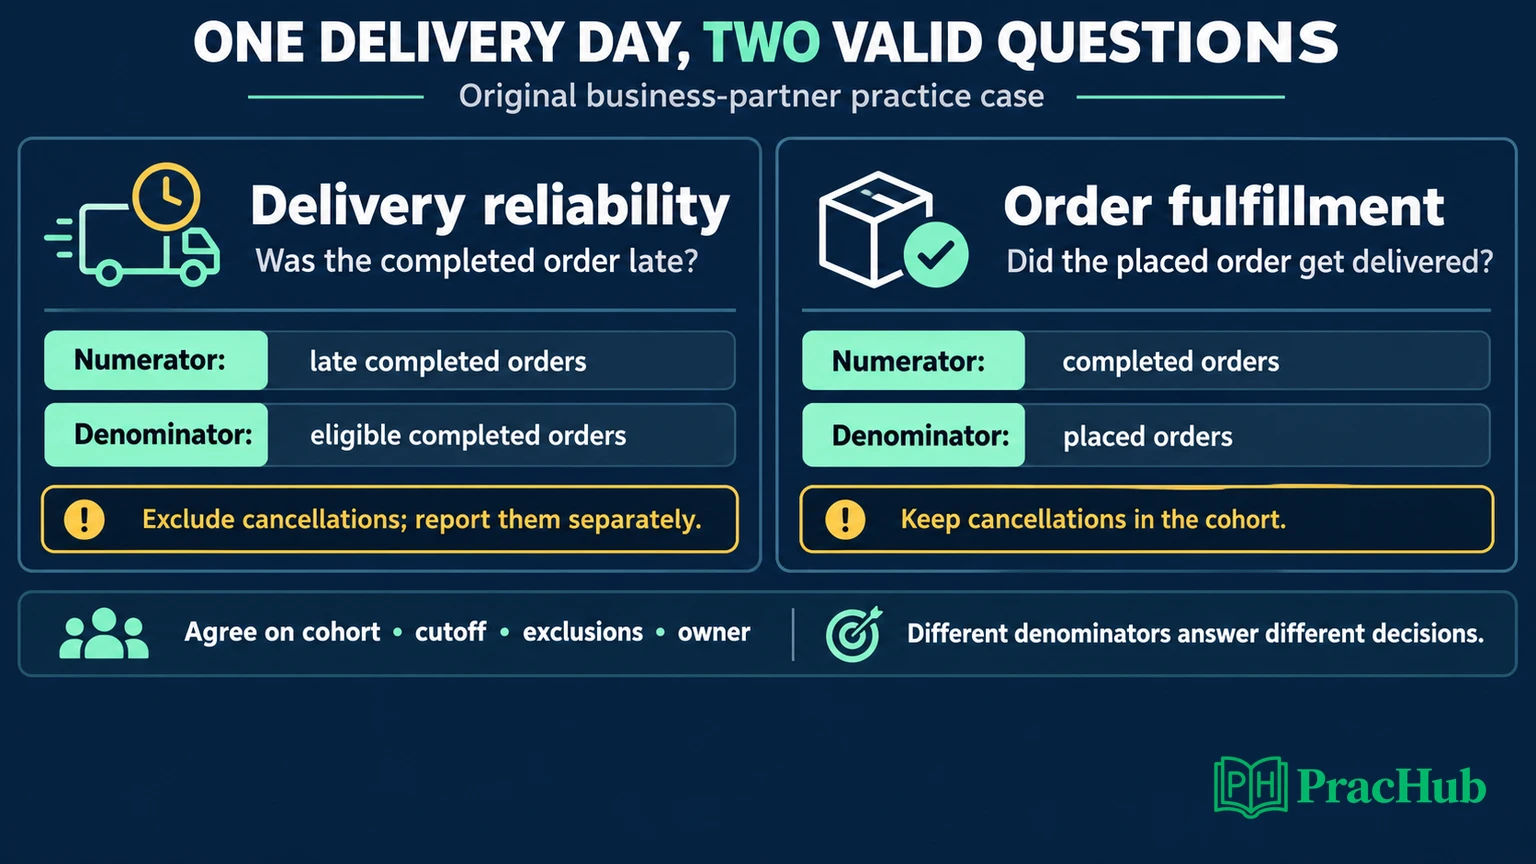
Start by asking what action the partner plans to take. Improving pickup execution calls for a different diagnosis from investigating why placed orders fail to complete. Avoid forcing both teams to use a metric whose name hides that distinction.
Propose a short metric contract: name, decision, numerator, denominator, cohort date, timezone, exclusions, data cutoff, revision policy, and owner. For the reliability view, retain late completed orders over eligible completed orders. For fulfillment, use completed orders over placed orders, with cancellations remaining in the cohort. Show unresolved orders separately and compare cohorts at similar maturity.
A concise response could be: “The 50% figure measures lateness among completed orders we can evaluate. It does not measure the chance that a placed order succeeds. I would publish a separate fulfillment measure, display cancellations and missing data, and agree on when each cohort is mature enough to compare.”
That answer connects a technical definition to the stakeholder's decision. Follow it with a proposed next step: inspect the affected market, merchant segment, and time window before recommending an intervention. A change in order mix or a delayed event feed could move the aggregate without proving that courier performance deteriorated.
The historical AE report also mentions a support-cost allocation case. Treat that as a different decision: allocating accounting cost is not the same as designing employee compensation. In preparation, clarify the objective before choosing weights. Ticket counts alone can obscure handling time, case difficulty, reopenings, and work shared across agents.
Make the Dashboard Explain Its Own Limitations
Preparation inference: Practice sketching a dashboard that a business partner could use without you narrating every number. For the synthetic delivery case, lead with the rate and eligible count, show cancellations and missing-data counts nearby, and label the as-of time and historical revision policy.
A useful drill-down follows the decision: market and merchant segments, then delivery stages where timestamps support diagnosis. Do not add charts merely because the tool can draw them. Explain which comparison would lead the viewer to act and what evidence would stop them from acting prematurely.
Rehearse a metric-drop investigation in order. Confirm that the definition and instrumentation stayed stable; inspect completeness and join cardinality; compare mature cohorts; then examine business segments and operational changes. Present competing explanations and the next check that would distinguish them. This is a preparation method, not an official DoorDash scoring framework.
For the project discussion, choose an ETL example you owned deeply enough to explain a failure. Describe the source contract, transformation decisions, tests, backfill strategy, and stakeholder disagreement. State what you personally changed and how you verified recovery. Trace one incorrect record through the diagram to show why the recovery worked.
Practice Five Relevant DoorDash Questions
Use these verified PracHub questions as practice destinations, not predictions of your exact loop. The first four are labeled Analytics Engineer. The final question is labeled Machine Learning Engineer and is included for its delivery-quality and stakeholder reasoning.
| PracHub question | What to rehearse |
|---|---|
| Find Maximum Window Sum | Explain a fixed-size window, boundary cases, and Python implementation. |
| Compute Fitness App DAU | Define activity, timezone, event deduplication, and user grain. |
| Allocate Support Cost and Diagnose Decline | Clarify allocation objectives and separate data defects from business changes. |
| Walk Through an ETL Project | Defend pipeline choices, tests, recovery, and personal ownership. |
| How would you prevent wrong items in deliveries? | Connect complaint attribution, operational changes, and guardrails. |
Continue with DoorDash Analytics Engineer interview questions. For each answer, move from definition to query or model, then to a validation check and a business recommendation. That sequence makes your reasoning reviewable even when the interviewer changes the assumptions.
Sources and Further Reading
- DoorDash: Analytics Engineer, India role
- Reddit: Completed technical-screen report, March 13, 2026
- Reddit: Completed technical-screen report, March 6, 2026
- PracHub: Historical October 2025 Analytics Engineer experience
- Reddit: Upcoming-loop preparation question, September 2, 2026
- SQLite: Window functions
Comments (0)