Equivalence Test Interview Questions: Assess Whether a Difference Is Small Enough to Ignore
Quick Overview
Work through equivalence testing with declared margins, two one-sided tests, confidence intervals and four cases that separate precision from equality. Original worked cases, primary references and explicit verification boundaries support focused interview practice.
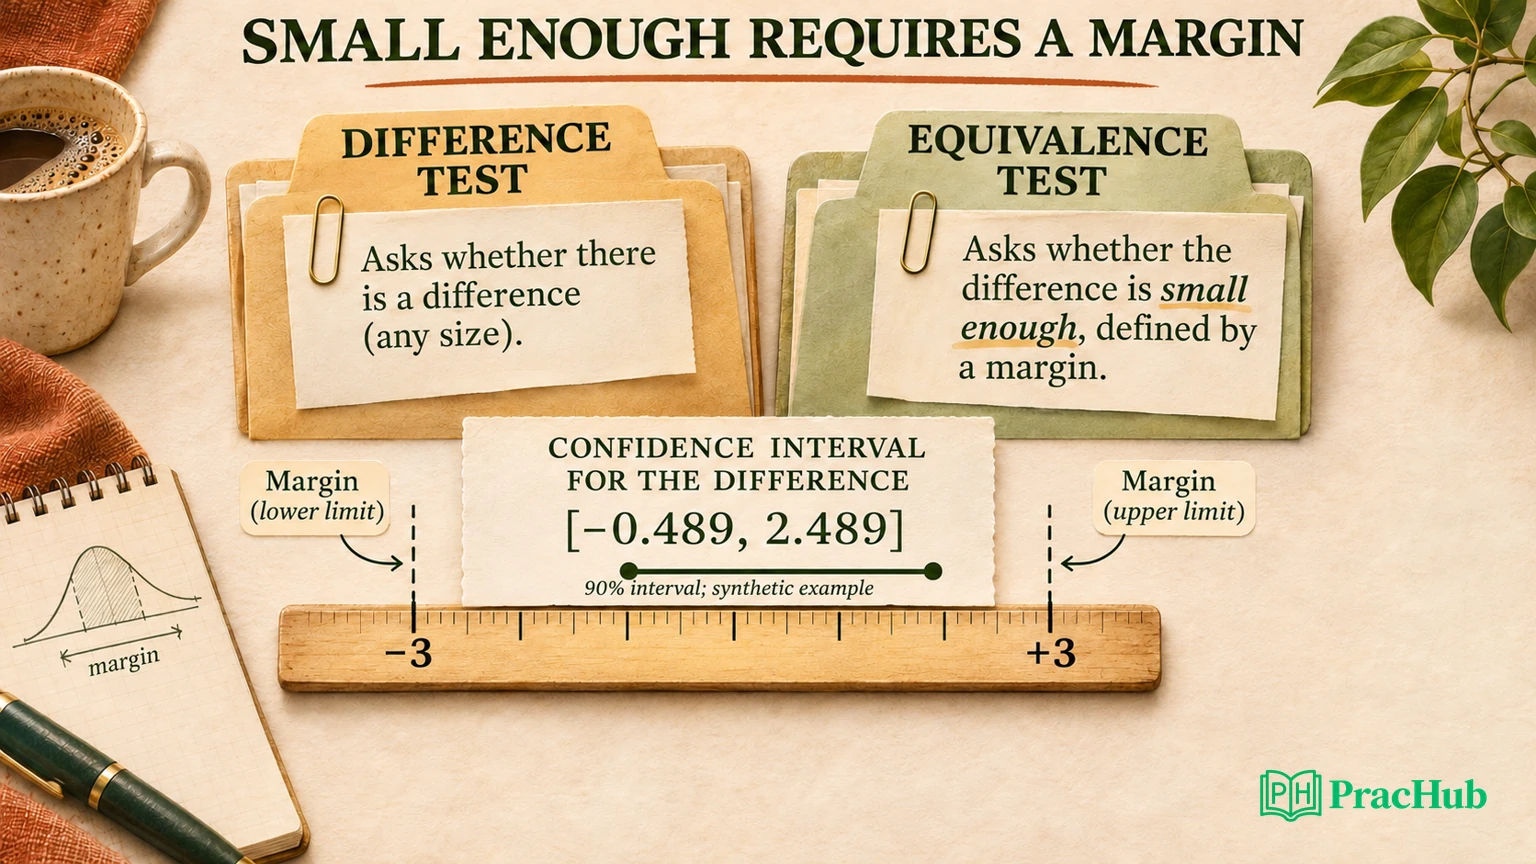
An equivalence test asks whether a difference is small enough relative to prespecified practical bounds. Failing to reject a zero-difference hypothesis does not establish equivalence. For two one-sided tests at 5% each, require both boundary nulls to be rejected; equivalently, the matching 90% confidence interval must lie entirely inside the equivalence region.
This original interview exercise uses a synthetic two-sample comparison, explicit lower and upper tests, and four distinct decision outcomes. PracHub's t-test and effect-size practice supplies the ordinary difference-test background; the new question is whether the evidence supports practical closeness.
Official statsmodels documentation defines the test interface; the cited methodological paper explains equivalence-testing logic. Our sample arrays and simulations are original. Their units and margins are invented for teaching, not an observed business experiment, a clinical conclusion or a candidate's reported assessment.
Decide what difference would matter before seeing the result
Suppose a fictional batch-processing comparison measures completion time in seconds. The owner of the exercise declares that a population mean difference strictly between minus three and plus three seconds is practically negligible for this particular decision. Define the effect as treatment minus control, so positive values mean the treatment takes longer.
Choose the margin as a decision requirement before inspecting the result. It could come from service tolerances, downstream cost or a substantive decision threshold. The article's three-second value has no authority outside this example. An interviewer should hear why a margin is relevant before hearing whether the observed interval fits inside it.
An asymmetric decision can use asymmetric bounds. If slowing the process by two seconds matters but speeding it up by five does not, symmetric bounds may be inappropriate. The statistical machinery does not decide those trade-offs. Write the scale, direction and bounds in the analysis contract before selecting a library function.
Also identify the estimand. Equivalence of mean time does not establish equivalence of tail latency, error rate, cost or every subgroup. A system can have an acceptably small mean difference while behaving differently at the ninety-ninth percentile. Testing the convenient summary is not enough when the actual deployment decision concerns another quantity.
Reverse the null hypothesis explicitly
An ordinary two-sided difference test starts from a null mean difference of zero and asks whether the data provide evidence against it. Equivalence testing starts from the possibility that the true difference is outside the acceptable region. The burden is to rule out effects that are too negative or too positive under the stated model.
For our bounds, the lower one-sided null is that the difference is at most minus three seconds. The upper one-sided null is that it is at least plus three seconds. Equivalence requires evidence against both. Rejecting only the lower null means that very negative differences have been ruled out; it does not rule out an unacceptably positive difference.
The TOST methodological discussion explains this distinction from a nonsignificant conventional test. A wide interval spanning negative and positive practically important effects can easily produce a large p-value against zero. That result is compatible with uncertainty, not necessarily with practical similarity.
Because the equivalence claim requires both one-sided tests to pass, the combined TOST p-value is the larger component p-value. Do not average the two p-values or accept the smaller one. This is an intersection of requirements: the weaker boundary exclusion determines whether the entire equivalence claim is supported.
Calculate the original two-sample example
The synthetic arrays contain forty observations per arm. Control has mean 100 seconds, treatment mean 101 seconds, and each sample has standard deviation four seconds. The arrays were constructed deterministically to have those sample summaries; they are not randomly collected timing measurements.
For an independent-sample Welch calculation, the standard error is sqrt(4²/40 + 4²/40), approximately 0.894427 seconds. Equal sample sizes and variances yield 78 degrees of freedom in this example. Welch's method remains an unequal-variance framework; equal observed variances here simply make the arithmetic easy to inspect.
Against the lower boundary, the statistic is (1 - (-3))/0.894427 = 4.472136. Its one-sided p-value is about 0.000013. Against the upper boundary, the statistic is (1 - 3)/0.894427 = -2.236068, with one-sided p-value about 0.014103. Both are below 0.05, so the declared TOST rule supports equivalence.
The conventional two-sided test against zero has p-value about 0.266984. That does not establish exact equality. The equivalence conclusion comes from the two boundary tests and the three-second margin, not from reinterpreting this nonsignificant result as proof of no effect.
from statsmodels.stats.weightstats import ttost_ind
p_equiv, lower_test, upper_test = ttost_ind(
    treatment, control, -3, 3, usevar='unequal'
)
# lower_test and upper_test each contain statistic, p-value and df.
# Equivalence requires p_equiv < 0.05 for the declared rule.
The statsmodels TOST reference identifies the inputs and returned component tests. Keep the argument order consistent with treatment minus control. Swapping arrays without also checking the interpretation of asymmetric bounds can silently change the question being tested.
Connect TOST to the matching confidence interval
The original example's matching 90% Welch interval is approximately [-0.489, 2.489] seconds. It lies entirely inside (-3,3), matching the two successful one-sided tests. A bound touching or crossing a margin does not satisfy the strict interior rule used by this exercise.
Its 95% interval is approximately [-0.781,2.781]. That also happens to fit inside the margin here, but it is not the interval that defines the standard two-one-sided 5% procedure. Using a 95% interval as the equivalence requirement is more conservative and changes the decision rule in cases nearer a boundary.
The confidence-interval connection follows the one-sided error allocation, not a trick that lets a researcher select whichever interval looks favorable. The confidence-interval API reference supplies the corresponding mean-difference calculation. Specify alpha and variance assumptions explicitly when reproducing the result.
An equivalence interval is still a frequentist confidence procedure, not a probability statement that the fixed true effect lies in this particular observed interval. A useful report says that the data support excluding effects outside the declared margin under the sampling model, with the stated confidence procedure and assumptions.
Keep four decisions separate
Difference detection and equivalence answer different questions, so their outcomes form four combinations. The following synthetic cases use the same three-second margin but change means, precision or sample size. They prevent the mistaken assumption that “different” and “equivalent” are always mutually exclusive labels.
| Case | Difference, sample SD, n per arm | 90% interval in seconds | Difference detected at 5%? | Equivalent by TOST? |
|---|---|---|---|---|
| Equivalent only | 0, 4, 40 | [-1.489,1.489] | No | Yes |
| Both | 1.5, 1, 40 | [1.128,1.872] | Yes | Yes |
| Difference only | 5, 4, 40 | [3.511,6.489] | Yes | No |
| Neither | 1, 12, 10 | [-8.306,10.306] | No | No |
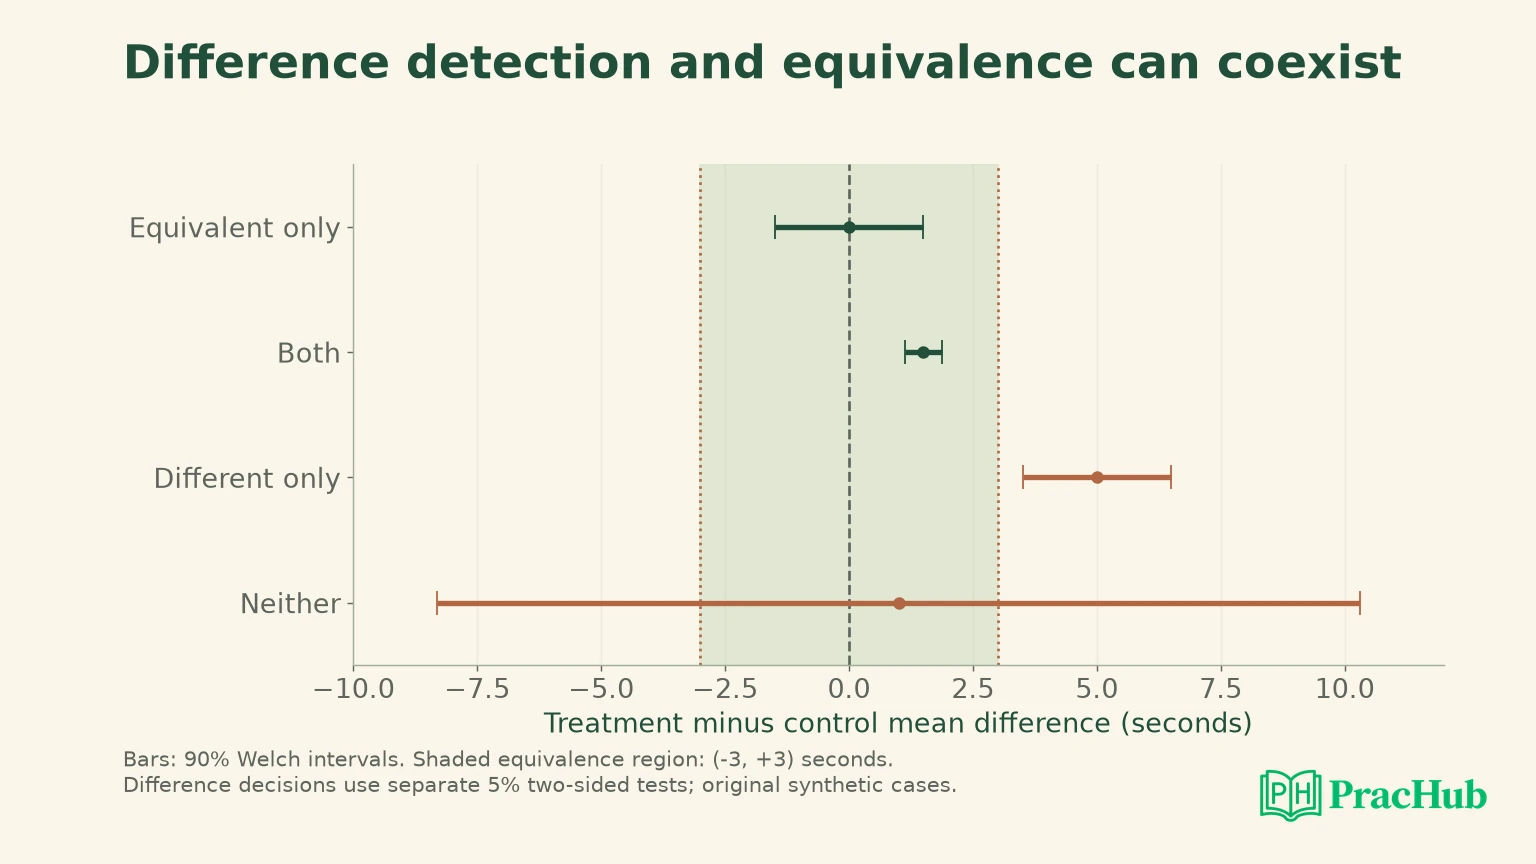
The “both” case exposes a useful distinction. Its positive effect is measured precisely enough to exclude zero, yet it remains comfortably smaller than three seconds. Statistical detectability and practical importance are distinct. There is no contradiction in describing a nonzero effect as negligible under a predeclared decision threshold.
The “neither” case has a wide interval. It provides insufficient evidence for either difference detection or equivalence. Do not translate that into a recommendation to launch, cancel or collect more data automatically; first identify the decision's risk, cost of delay and whether further sampling is feasible under a valid design.
Simulate the boundary without overstating the experiment
A separate original simulation uses a known-variance normal mean-difference estimator with the same standard error, rather than resimulating the finite-sample Welch procedure. For each true difference, it draws 50,000 estimates and checks whether the matching 90% normal interval fits inside the margin. This isolates the decision geometry under an explicitly simpler model.
At a true difference of zero, the simulation declares equivalence 91.138% of the time, with Monte Carlo standard error about 0.127 percentage points. At the boundary of plus three, it does so 4.868% of the time, with MCSE about 0.096 points. At plus four, the rate is 0.304%, with MCSE about 0.025 points.
The boundary result demonstrates, within this model, why false-equivalence error is checked at the margin. It is not a guarantee for arbitrary distributions, clustered measurements, adaptive stopping or estimated variances. The simulation's normal model and fixed standard error are part of the result, not minor implementation details to omit from a report.
Likewise, the 91.138% interior rate is not a universal sample-size recommendation. Power depends on the actual true effect, variance, margin, sample allocation and chosen procedure. A planning calculation must use plausible assumptions and sensitivity checks before data collection. An observed p-value cannot replace that prospective design work.
Diagnose invalid shortcuts before interpreting success
Choosing a wider margin after seeing the interval makes equivalence easier but changes the question after observing the answer. A substantive justification established independently of the result is needed. If the margin genuinely changed for operational reasons, report the change and avoid pretending that it was the original confirmatory analysis.
Paired measurements require paired-difference reasoning. Repeated observations from the same machine or user are not automatically independent samples. Ignoring dependence can misstate precision and therefore misclassify equivalence. Before discussing Welch versus pooled variances, identify the unit of randomization and the source of repeated measurements.
A transformation also changes interpretation. Bounds on a log scale correspond to multiplicative ratios after back-transformation, not the original additive seconds. If the decision concerns relative changes, specify ratio bounds and the statistical model consistently. Applying an additive three-second threshold to a transformed parameter mixes incompatible scales.
Finally, one-sided noninferiority is a different objective. If only unacceptable slowing matters, a lower performance bound may be the relevant test rather than symmetric equivalence. Do not run two tests solely because the term TOST is familiar. The required claim determines which adverse effects must be ruled out.
A clear decision note preserves the effect direction when communicating the result: the treatment mean is one second slower in this synthetic example, and the compatible effects fit inside the independently chosen plus-or-minus-three-second region. Omitting the sign can make a performance report sound as if the treatment was faster. Omitting the margin can make equivalence sound like exact equality. Both pieces belong beside the interval, not in a detached methods appendix.
If stakeholders later ask about a tighter one-second tolerance, the existing result does not inherit the earlier equivalence conclusion. That is a new decision threshold, and the displayed interval already shows why it would not fit. Recomputing the decision under a clearly labeled new margin is transparent sensitivity analysis; describing the original test as having proved every reasonable notion of similarity would overstate the evidence.
Rehearse a decision with assumptions attached
These PracHub records support test selection, confidence-interval interpretation and decisions after nonsignificant results. They are related practice rather than a dedicated equivalence question bank or a prediction of an employer's assessment. Keep practical margins and sampling assumptions explicit when extending them.
| PracHub question | What to defend |
|---|---|
| Recommend a Decision After a Nonsignificant Experiment | Explain why a nonsignificant result leaves important effects unresolved. |
| Interpreting confidence intervals to choose a treatment | Separate interval precision from a treatment-selection decision. |
| Choose and Explain a Classical Hypothesis Test | Choose the null and alternative that match the requested claim. |
| Explain Type I and Type II Errors in Hypothesis Testing | Identify the false-equivalence error at the boundary. |
| Welch's t-Test p-Value for a Routing Experiment on Time to Pickup, and Its Validity | Preserve sample structure and variance assumptions in the calculation. |
Use the nonsignificant-experiment question to report the original one-second estimate, both one-sided p-values and the predeclared three-second margin. Then show the wide “neither” case. A useful recommendation distinguishes evidence of practical closeness from a result that merely failed to detect a difference.
Sources and Further Reading
- statsmodels: Two one-sided independent-sample equivalence tests
- statsmodels: Confidence interval for a mean difference
- Lakens: Equivalence Tests—A Practical Primer
Sources checked November 3, 2026. Python 3.12.14, NumPy 2.5.3, SciPy 1.18.1 and statsmodels 0.15.0 produced the saved synthetic results; no business outcome is claimed.
Comments (0)