Figma Data Scientist Interview: Project Showcases and Product Opportunity Sizing
Quick Overview
Distinguish official role requirements from candidate reports, then practice a defensible project narrative and team-level product opportunity estimate.
For a Figma data scientist interview, prepare to explain a project as a chain of decisions and evidence, then apply the same discipline to an unfamiliar product opportunity. A polished presentation is useful only if you can defend your contribution, measurement choices, assumptions, and conclusion when the interviewer changes the question.
Start with PracHub's relevant data science project discussion. Use the original sizing case below to practice moving from an ambiguous collaboration problem to a calculation another person can reproduce.
Evidence boundary: Official requirements are tied to a specific Figma role. Candidate reports are dated individual accounts, not a verified universal interview loop. All example project statements, feature ideas, inputs, and calculations below are original hypothetical practice material.

Separate the role description from interview reports
Official role evidence: Figma's Data Scientist, Core Data – PhD (2026) listing describes experimentation, causal inference, analytical systems, cross-team work, SQL, Python or R, and clear technical communication. It is a research-oriented Core Data role with a quantitative PhD requirement; that requirement must not be generalized to every Figma data scientist position. Official Core Data listing
Candidate reports: A November 2025 account, describing a September interview, mentions a showcase and hypotheticals about earlier projects. A March 2025 account mentions a product opportunity-sizing case. A July 2026 account mentions a project discussion. These are cross-cycle, self-reported observations with limited detail. Dated Glassdoor reports
The evidence supports practicing project explanation and product reasoning. It does not establish a fixed presentation length, exact round count, or hiring timeline for your invitation. Two independent same-cycle reports were not established for this review, so the guide focuses on transferable preparation within Figma's collaboration context.
Before selecting a showcase, read the actual team description. A methodology project may fit an experimentation-platform role, while a product analytics role may need a stronger story about user behavior and a decision made with partners. Adapt the emphasis without inventing responsibilities you did not have.
Build a project showcase around one decision
Choose a project in which you can explain a consequential choice. “We built a dashboard” names an artifact; “we needed to decide whether onboarding friction justified a product change” names the decision the analysis served.
A useful showcase follows the evidence in an order the listener can inspect. Establish the product problem, the relevant population, your own responsibility, the method, the result, and what happened next. Keep implementation detail available for follow-up rather than placing every query and model on the opening slide.
Use this original structure as a preparation outline, not a required Figma deck format:
| Part | Evidence to prepare |
|---|---|
| Decision | The choice a product or business partner needed to make. |
| Your contribution | The analysis, design, or validation you personally owned. |
| Measurement | Unit, denominator, event definition, and data-quality checks. |
| Method | Why this comparison or model matched the decision. |
| Result | Estimate, uncertainty, and important limitations. |
| Action | What changed, what did not, and what you learned afterward. |
Be precise about collaboration. You may have written the experiment analysis while an engineer implemented assignment and a product manager set rollout constraints. Naming those boundaries makes your contribution easier to evaluate; claiming the entire outcome makes it harder.
When sharing prior work, use material you are permitted to disclose. Replace confidential names and numbers with clearly labeled illustrative values if needed. Explain the analytical structure rather than presenting a synthetic example as your employer's measured result.
Replace a strong-sounding claim with a supportable one
Consider this original weak statement: “My reminder feature increased retention by 12% because teams using it came back more often.” The comparison may select already-engaged teams, and “12%” does not say whether it is a relative change or percentage-point difference.
A more defensible original rewrite is: “In the observational analysis, teams that adopted the reminder had a higher subsequent return rate. Adoption was not randomized, and earlier collaboration intensity differed, so I treated the result as evidence to investigate rather than a causal effect. I proposed a team-level experiment before broad rollout.”
If you actually ran a valid randomized experiment, say so and provide the assignment unit, eligible population, primary outcome, effect estimate, and uncertainty. Do not borrow the language of causal evidence merely because the project included an A/B-test dashboard.
Prepare a counterfactual: what would have changed your recommendation? For example, better short-term engagement paired with more unwanted notifications might justify redesign rather than launch. A project story becomes more credible when it includes a result that would have made you choose differently.
Define the opportunity before multiplying numbers
Official product context: Figma supports comments attached to design-file locations, replies, and resolving comments after feedback is addressed. Those documented interactions provide context for a collaboration case; they do not make a resolved comment a direct measure of design quality. Figma comment management
Our hypothetical feature is a review-owner reminder that helps a team coordinate unresolved feedback during a defined design review. This is an invented exercise, not a statement about Figma's existing or planned roadmap.
The decision is whether a limited experiment is worth prioritizing. The benefit we will size is reduced active coordination effort per week. We are not estimating revenue, paid-seat growth, or Figma's market size.
Define a qualifying review session as one scheduled review of a file with a designated owner and at least one requested collaborator response. A session may contain many comments and several participants. Counting each comment as an independent review would inflate the opportunity before the feature has done anything useful.
For measurement, assume every session has one canonical ID and owning team. A file reviewed twice contains two sessions; duplicate logging of the same session does not. That rule makes the estimate reproducible while exposing what instrumentation would be needed in reality.
Work through a complete base-case estimate
Every number in this table is an original assumption, not a Figma metric. Values describe a hypothetical weekly population and should be replaced with evidence in a real analysis.
| Input | Assumption |
|---|---|
| Weekly active teams | 10,000 |
| Teams with the relevant coordination problem | 30% |
| Qualifying reviews per eligible team per week | 4 |
| Adoption across qualifying reviews | 40% |
| Baseline active coordination effort per review | 20 person-minutes |
| Effort reduction in an adopted review | 20% |
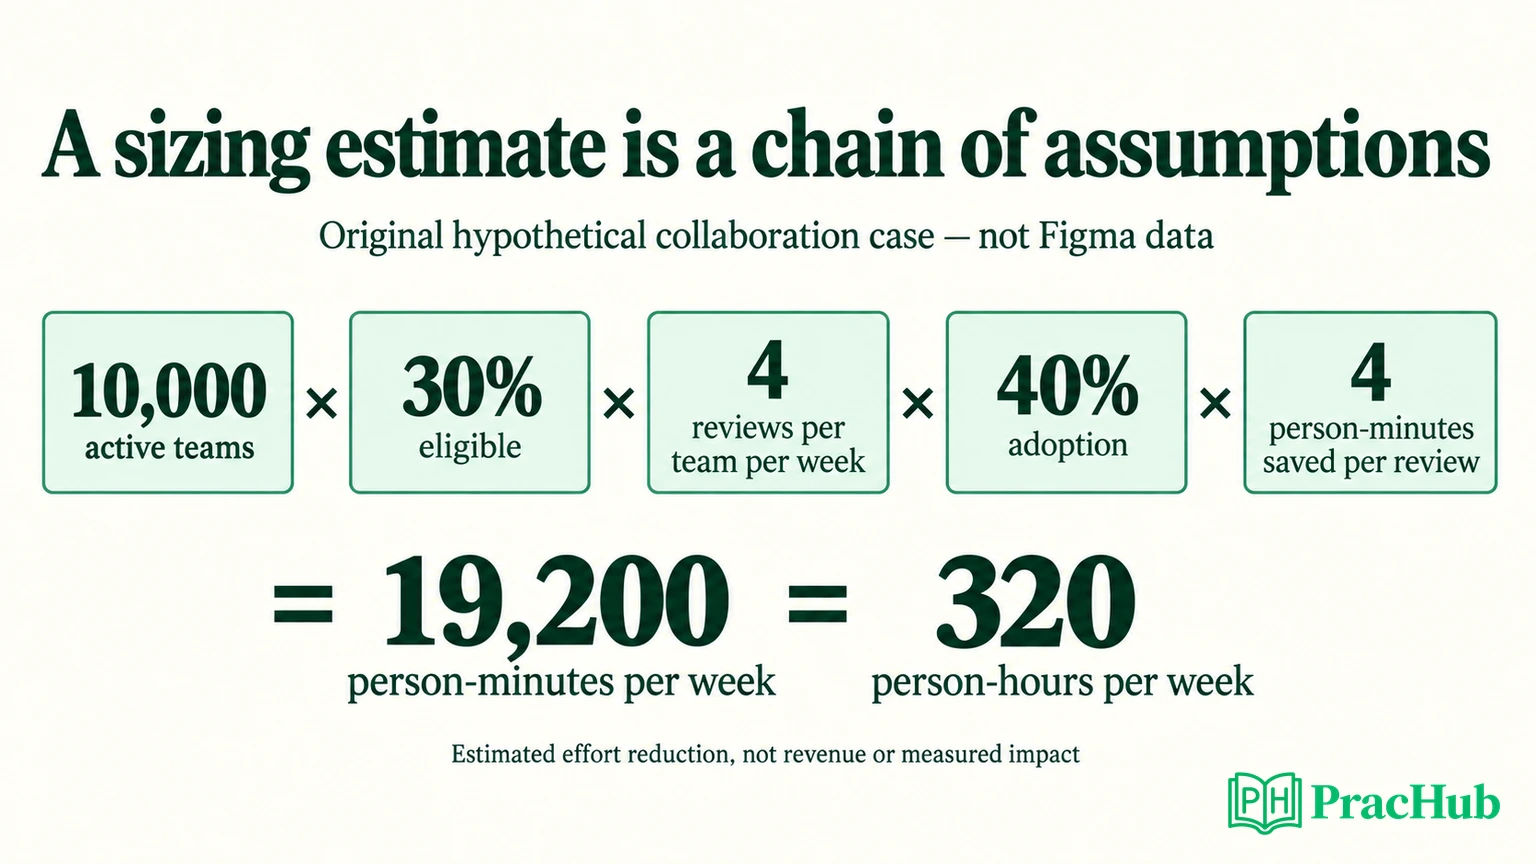
There are 3,000 eligible teams and 12,000 qualifying reviews per week. At 40% adoption, the feature affects 4,800 reviews. A 20% reduction from 20 person-minutes saves 4 person-minutes per adopted review.
The base estimate is therefore 4,800 × 4 = 19,200 person-minutes, or 320 person-hours per week. The units are active effort summed across people, not calendar time between opening and closing a review.
That distinction matters. A review that takes two days to finish may involve only twenty minutes of active coordination. Claiming two days of labor saved would confuse waiting time with effort. Conversely, several participants can spend effort during the same elapsed minute, so person-time and clock-time are not interchangeable.
This is a gross opportunity estimate under stated assumptions. It does not subtract setup effort, maintenance, notification handling, or the cost of displaced work. It also does not imply that every saved minute becomes additional output or billable revenue.
Test the assumptions with sensitivity analysis
Hold the population, eligibility, review frequency, and baseline effort fixed. Vary adoption and effort reduction together to show how strongly the result depends on uncertain behavior:
| Scenario | Adoption | Effort reduction | Hours per week |
|---|---|---|---|
| Low | 20% | 10% | 80 |
| Base | 40% | 20% | 320 |
| High | 60% | 30% | 720 |
The arithmetic was independently recalculated for this article. These scenarios are not confidence intervals, forecasts from a fitted model, or measured Figma outcomes. They are transparent alternatives that identify which assumptions deserve further work.
A useful next question is which input is both uncertain and decision-sensitive. If adoption evidence is weak, a small usability or pilot study may be more valuable than refining the team-count estimate to another decimal place. If the feature changes notification burden, measure that cost before celebrating gross savings.
Also check whether inputs can reasonably vary independently. Teams with the biggest coordination problem may adopt more readily but also have harder reviews. Multiplying separate averages can obscure that relationship. Segmenting by review complexity may produce a more credible estimate than one universal reduction rate.
Design the next measurement around collaboration
For the hypothetical experiment, consider assigning at the team level because collaborators affect each other's workflow. Randomizing individual reviewers inside the same team could expose treatment and control participants to the same reminder behavior.
That is an editorial design recommendation, not a description of Figma's experimentation platform. If people or files span multiple teams, team assignment may still allow spillover. Explain the interference boundary and adjust the design or interpretation accordingly.
Choose a primary outcome that matches the case: active coordination effort per eligible review, measured consistently across variants. Track adoption as a mechanism, but do not restrict the main randomized comparison to post-assignment adopters. That would compare selected behavior instead of preserving the original assignment contrast.
Add guardrails for unwanted reminders, reopened feedback, abandoned reviews, and collaborator satisfaction. A lower coordination-time metric is not enough if people resolve threads prematurely just to stop notifications. Inspect whether the intervention changes the meaning or logging of the outcome itself.
If effort cannot be measured reliably from product events, say so. A small consented time study or structured survey may help validate a proxy. Do not label the interval between two timestamps as active work merely because those timestamps are easy to query.
Handle follow-ups without defending every assumption
“Why teams rather than users?” The feature changes a shared review workflow, and the estimate starts with team-owned sessions. User counts could still help assess reach, but multiplying both users and sessions would double-count effort unless the measurement explicitly requires it.
“What if adoption is only 10%?” With the base 20% reduction, the estimate falls to 80 person-hours per week. Recompute openly, then compare that opportunity with development and operating costs. A smaller estimate may change priority without making the entire method invalid.
“Would you launch after seeing more resolved comments?” Not on that signal alone. Resolution can reflect progress, easier tasks, premature closure, or changes in logging. I would connect it to the defined review outcome and inspect quality guardrails.
“What would you do differently in your past project?” Name a specific limitation and a feasible improvement. Explain whether the change would alter confidence, the decision, or only execution speed. Avoid a hindsight story in which every constraint mysteriously disappears.
Five Figma questions for the next rehearsal
These verified PracHub records provide practice in project communication and product reasoning. They are not proof that your upcoming interview will contain the same questions.
| PracHub question | Practice focus |
|---|---|
| Present a Relevant Data Science Project to a Hiring Manager | Separate your contribution from the team's outcome. |
| Clarify an Ambiguous Product Question and Define a Metric | Establish the decision, population, and unit. |
| How would you measure product success? | Connect a primary metric to useful guardrails. |
| Handle Cross-Functional Pushback on an Analysis | Investigate disagreement with evidence. |
| Describe impact, prioritization, and stakeholder management | Explain why a decision changed and who helped. |
Rehearse the project showcase question with one partner changing an assumption midway. Keep your answer anchored in what was observed, what was assumed, and what decision the evidence can support.
Sources and Further Reading
- Figma Core Data PhD role — official requirements for that specific track.
- Figma Data Scientist candidate reports — dated individual accounts across 2025–2026.
- Figma: View and manage comments — current collaboration product context.
Sources checked September 9, 2026. All sizing values are hypothetical and do not describe Figma's business.
Comments (0)