Graham Capital Quantitative Research Internship: Statistics and Python Preparation for 2027 Applicants
Quick Overview
An evidence-bounded preparation guide for prospective Graham Capital quantitative research interns: official internship policy, historical research discussions, and a worked Python risk-and-cost example.
Preparing for a Graham Capital quantitative research internship starts with a research question you can explain, test, and revise. A polished notebook helps only if you can defend how its data, assumptions, and evaluation fit together.
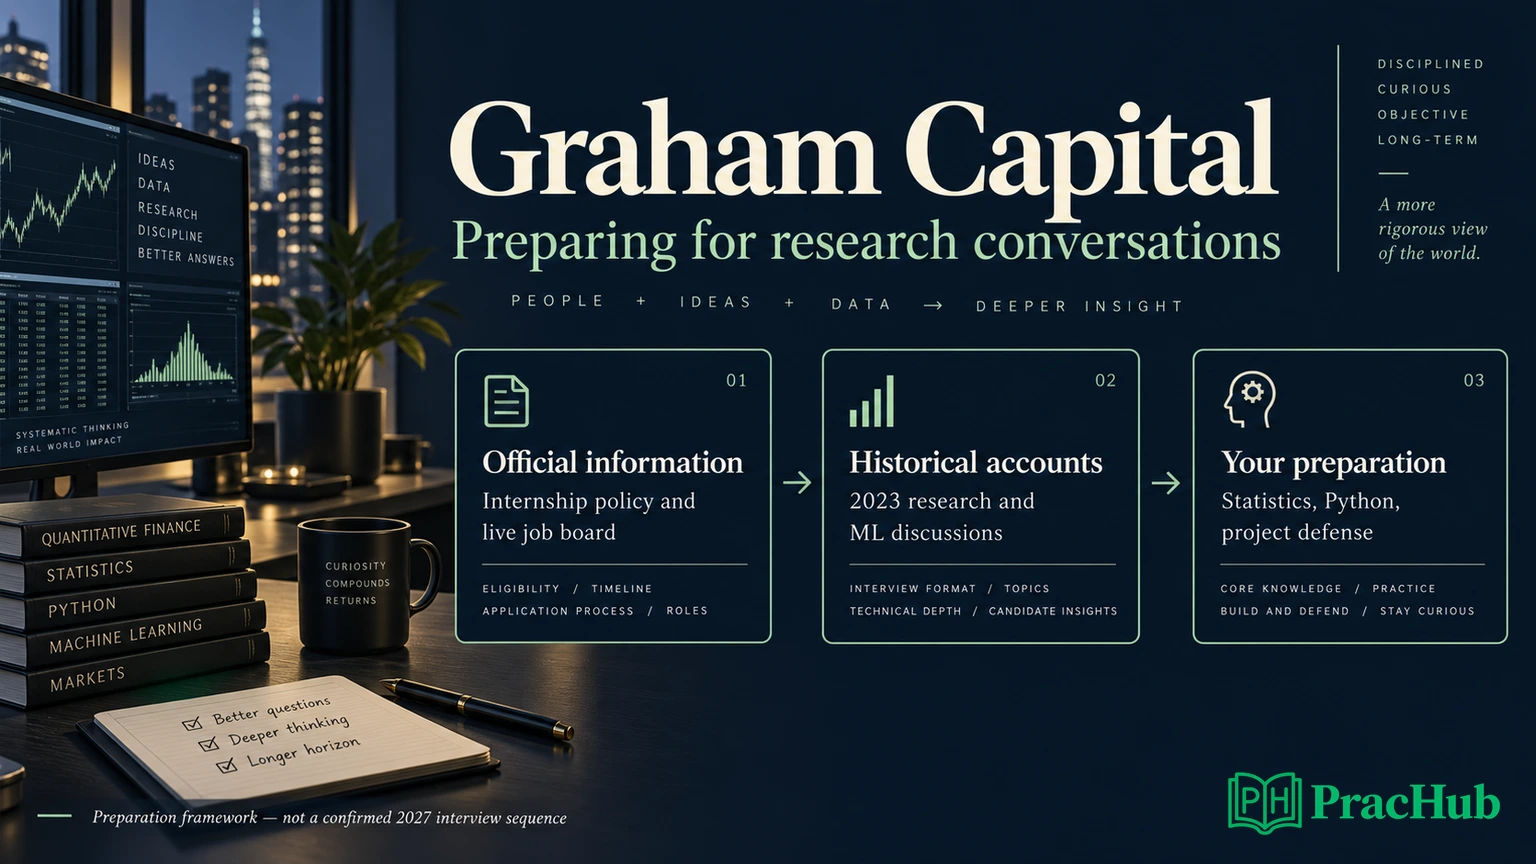
For 2027 applicants, the key distinction is preparation versus a confirmed hiring process. As of September 8, 2026, Graham's official careers page describes a recurring summer internship program, but we did not find a dated 2027 quantitative research internship opening on its job board. This guide combines official information, explicitly historical candidate reports, and practical preparation recommendations.
Start with PracHub's Design cross-validation; explain bias–variance to practice explaining an evaluation decision. It is a cross-company exercise, not a reported Graham interview question.
What is confirmed for prospective 2027 applicants?
Official information: Graham says summer internship applications open in mid-September and hiring is rolling. Its program includes undergraduate and graduate students across departments, with individual and collaborative projects. Interviews typically involve department heads or senior team members. The careers page describes general policy; it does not identify a specific 2027 QR assessment.
Our September 8 check of the official job inventory found seven positions and no internship. That is a dated observation, not evidence that Graham will offer no internship next summer. The sensible next step is to check the official Open Positions section as recruiting develops.
| Evidence available now | What you can use it for | What it does not establish |
|---|---|---|
| Official recurring internship policy | Decide where to check and understand general hiring context | A guaranteed 2027 opening date or closing date |
| Official full-time quantitative research role | Understand research responsibilities at the firm | Internship degree, experience, salary, or language requirements |
| Two internship accounts published in November 2023 | Prepare for possible project and ML discussion | The number, duration, or order of 2027 rounds |
Planning inference: mid-September is a useful point to revisit the careers page. Do not convert it into a September 15 deadline, an interview date, or a promise that the QR team will recruit. Save the actual internship description when one appears, then work from its stated eligibility and instructions.
What historical intern candidates reported
Historical candidate reports: the Glassdoor quantitative research internship page contains two accounts published in November 2023. One describes an October 2023 conversation with a quant, covering the resume and machine learning, including overfitting and hyperparameter tuning. The other describes discussions of prior projects and relevant skills with two senior quantitative researchers.
Their different experiences are a reason to avoid presenting one fixed sequence. They support rehearsing research explanations; they do not establish a current coding platform, question count, cutoff, or timetable. Neither account provides a selection rule that applicants can reliably apply today.
Preparation recommendation: practice answering a follow-up rather than memorizing a list of definitions. If you mention cross-validation, be ready to explain how you split your own data. If you mention grid search, explain which data selected the parameters and which data remained untouched until final evaluation.
Translate Graham's research context into a project discussion
Official role context, not internship eligibility: Graham's current Quantitative Research Analyst listing describes improving systematic signals, developing complementary signals, and constructing portfolios while controlling risk, drawdowns, and trading costs. It also emphasizes reducing the gap between simulated and actual performance and presenting research findings.
That provides a useful preparation direction: show how a statistical finding survives the decisions required to turn it into a research result. Do not borrow the full-time role's education or experience requirements and treat them as internship entry criteria.
Choose a project with a manageable scope. A comparison of simple forecasts across several liquid futures markets can support discussion of time ordering, correlated exposures, and costs. An academic project outside finance can also work: explain the hypothesis, data limitations, baseline, and decisions you personally made. Do not imply trading experience you do not have.
Prepare a short opening with five elements: question, data, baseline, result, limitation. Then organize your backup material around decisions rather than screenshots. A reviewer should be able to ask why you changed the model and see the evidence that prompted the change.
For Graham's stated interest in complementary signals, one especially useful question is whether your idea adds anything beyond an existing baseline. An attractive standalone result can still duplicate an exposure already present elsewhere. Treat that as a research question to investigate, not a claim about Graham's proprietary portfolios.
Statistics: defend the comparison, not just the score
Recommended preparation: review regression, conditional expectation, covariance, estimation uncertainty, and model selection through the project you plan to discuss. Each concept should explain a decision you made.
For regression, identify the prediction target and the time at which features become available. Explain the intercept, correlated predictors, and what the residuals suggest. A coefficient with a persuasive narrative still needs validation; an association alone does not establish causality or a tradable advantage.
For covariance, consider two signals with similar individual results. If their returns move together, combining them may add less diversification than expected. Explain why covariance estimation can change across market conditions and why a sample estimate is not a permanent property of the strategy.
For uncertainty, separate a small sample from independent evidence. Thousands of overlapping observations can share much of the same information. Before calculating a confidence interval, identify the unit of observation and the dependence assumptions behind your method.
For model selection, explain how repeated experimentation changes the interpretation of your best result. Trying many features and reporting only the winner can produce an optimistic story. Keep an experiment log, preserve an untouched evaluation period, and report meaningful unsuccessful alternatives alongside the chosen model.
The scikit-learn cross-validation documentation explains why fitting and evaluating on the same observations is invalid and discusses evaluation for time-dependent data. For market research, chronological splits are a starting point. Inspect whether training labels extend into a validation period and whether preprocessing uses information from outside the training window.
In an interview rehearsal, have someone challenge the weakest assumption. “What would make you abandon this result?” is more revealing than another request to recite a formula. Answer with an observable failure condition, such as performance disappearing after plausible costs or reversing across reasonable evaluation windows.
A worked example: forecast, exposure, and net result
Original practice exercise, not a Graham question: suppose a simple model predicts a positive 0.10% move for a hypothetical instrument. You estimate annualized volatility at 20% and choose a 10% annualized risk target. Under a simplified single-asset rule, the exposure multiplier is 10% / 20% = 0.5.
The forecast and the exposure answer different questions. The forecast concerns direction or expected return; the multiplier scales the position under an assumed risk rule. A larger forecast does not automatically justify unlimited exposure, and a lower volatility estimate does not remove model risk.
Now suppose the instrument's next-period realized return is 0.40%. Holding exposure of 0.5 throughout that period produces a gross portfolio return of 0.20%. If the position changes from 0.2 to 0.5, absolute turnover is 0.3. At an illustrative cost rate of 0.10% per unit of turnover, the cost is 0.03%, leaving 0.17% net.
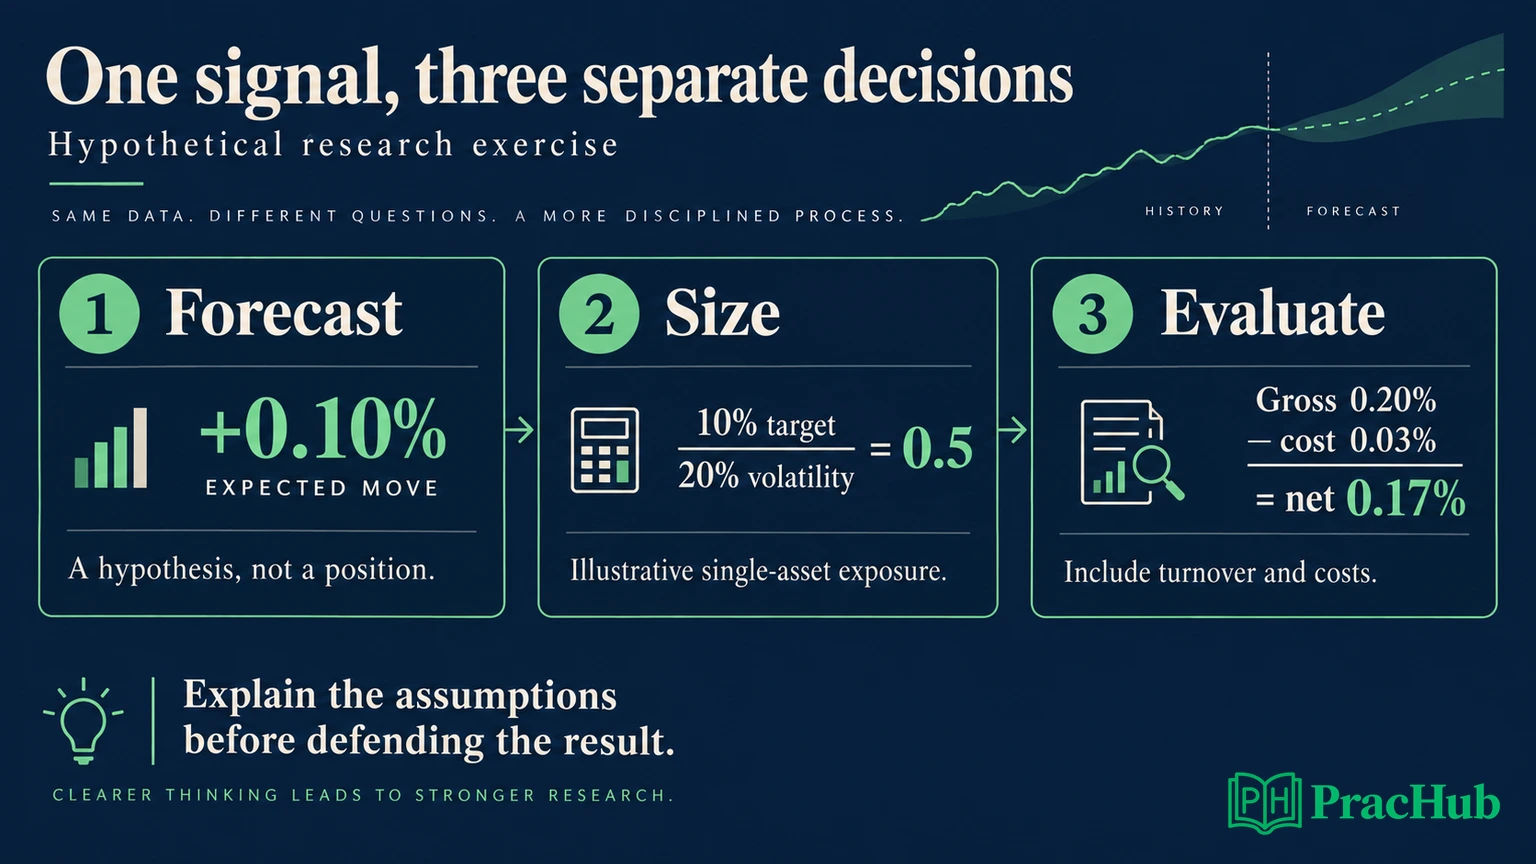
These are invented values for explanation, not a proposed investment strategy. The example assumes fractional notional exposure, a common capital base, a linear cost model, and no financing or contract-rounding effects. It includes the stated rebalance, not every possible future exit cost.
Use the example to rehearse three challenges. What happens if estimated volatility doubles? The same rule halves exposure to 0.25. What if the signal flips sign? Turnover depends on the distance between old and new positions, not merely the new position's magnitude. What if the backtest trades on a price unavailable when the signal was computed? The arithmetic may be correct while the experiment is invalid.
This chain connects Graham's public emphasis on signals, portfolio construction, and implementation gaps to a concrete research explanation. The preparation value lies in stating assumptions and tracing consequences, rather than pretending to reproduce the firm's methods.
Python: make the arithmetic auditable
Recommended preparation, not a confirmed language requirement: use Python to express the research logic clearly, test boundary cases, and reproduce results. The sources reviewed do not establish a required Python assessment for a 2027 Graham internship.
For the preceding exercise, isolate the accounting calculation before building a larger notebook:
def net_return(previous, current, asset_return, cost_rate):
    turnover = abs(current - previous)
    gross = current * asset_return
    return gross - cost_rate * turnover

result = net_return(0.2, 0.5, 0.004, 0.001)
assert abs(result - 0.0017) < 1e-12
The function assumes the rebalance happens before the return accrues. Returns and costs are decimals, so 0.0017 means 0.17%. Explain that convention before presenting the number; mixing percentages and decimals creates errors that a tidy chart can hide.
Add tests that expose the contract. An unchanged position should have zero turnover cost. Moving from +0.5 to −0.5 should generate turnover of 1.0. A zero asset return with a nonzero rebalance should leave a negative net result when costs are positive. Decide how production code should reject missing or nonfinite inputs.
Next connect the function to time-indexed data. State when each position is known, which subsequent return it earns, and how missing prices affect the calculation. Keep signal generation separate from sizing and accounting so you can test each layer independently.
For a larger project, provide a reproducible entry point and a concise record of dependencies, data provenance, and configuration. Run it from a clean process. If your result depends on a notebook cell executed out of order, fix that before practicing your presentation.
Five focused PracHub practice questions
These are cross-company practice records, chosen to support the research discussion above. They are not confirmed Graham questions, and some solution details may require access. Work through one fully before moving to the next.
| PracHub question | Follow-up to rehearse |
|---|---|
| Design cross-validation; explain bias–variance | Explain the split for your project's data |
| Describe overfitting and L1/L2 regularization | Explain what regularization cannot repair |
| Derive Coefficient and Covariance in Regression Analysis | State the assumptions before using an identity |
| Design and backtest a trading strategy | Separate selecting a model from evaluating it |
| Debug ML pipeline and build text parser | Isolate the smallest reproducible failure |
What to do when an application or invitation arrives
Read the particular internship description before deciding whether you qualify. Confirm the team, location, degree stage, availability, and work-authorization requirements from that posting. A general statement that Graham hires undergraduate and graduate interns does not answer every position-specific eligibility question.
If invited, ask about the session format, expected duration, permitted tools, and whether you should prepare a project presentation. If there is a coding exercise, use its instructions to decide what to practice. If there is a take-home task, clarify deliverables and evaluation expectations before spending time on elaborate modeling.
For now, prepare one project explanation that connects a claim to its evidence and limitations. Start with Design and backtest a trading strategy, then explain how the worked example's sizing and costs would fit into your own evaluation. That gives you something useful to improve while the actual 2027 recruiting details remain unconfirmed.
Sources and Further Reading
- Graham Capital: careers and recurring internship policy
- Graham Capital: official current job inventory
- Graham Capital: full-time Quantitative Research Analyst role
- Glassdoor: quantitative research internship accounts published November 2023
- Scikit-learn: cross-validation and time-dependent evaluation
Research checked September 8, 2026. Official general policy, historical accounts, and recommended preparation are labeled separately. No fixed 2027 interview sequence is claimed.
Comments (0)