Linux Troubleshooting Interview Questions for SRE: CPU, Memory, Disk, and Network Scenarios
Quick Overview
A practical Linux troubleshooting interview guide for SRE candidates, with an evidence-first framework and eight realistic CPU, memory, disk, and network scenarios. Learn how to interpret load average, CPU states, memory pressure, OOM kills, disk capacity versus latency, DNS, TCP, and partial network failures, plus what interviewers expect from strong answers.
The interviewer says, "A Linux server is slow. What do you do?" Then they stop talking.
The trap is to open top and start reciting commands. A strong SRE candidate first defines what "slow" means, finds the blast radius, builds a short list of likely causes, and chooses the next command because its output can confirm or reject one of those causes.
Before memorizing flags, practice that reasoning with PracHub's real Site Reliability Engineer interview questions. This guide then gives you a reusable framework plus realistic CPU, memory, disk, and network scenarios to rehearse aloud.
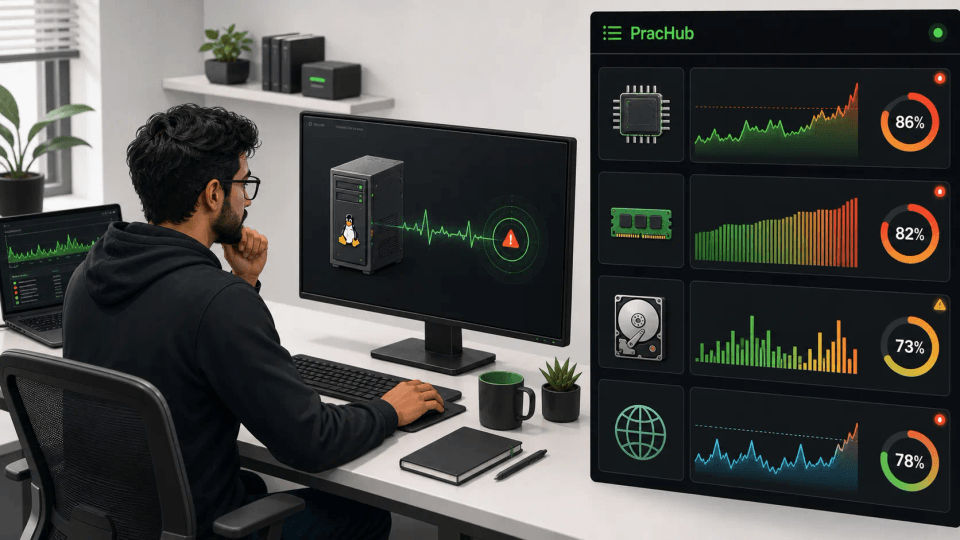
A strong Linux troubleshooting answer connects host signals to a testable hypothesis.
Quick Verdict
Linux troubleshooting interviews test judgment more than command recall. Interviewers want to see whether you can scope an ambiguous symptom, read resource signals correctly, isolate the failing layer, mitigate safely, and verify recovery.
A good answer is not "I would check CPU, memory, disk, and network." It is: "I would first determine whether one host or the whole service is affected, then choose the cheapest signal that separates my leading hypotheses."
This article focuses on host-level diagnosis. For coding, reliability design, SLOs, and incident leadership, use the broader SRE Interview Guide 2026.
What the Interviewer Is Actually Scoring
| Signal | What a strong candidate does | What weak answers do |
|---|---|---|
| Scope | Separates one host, one endpoint, one region, or the full service | Assumes the alert already identifies the cause |
| System model | Traces the request through process, kernel, storage, network, and dependencies | Names tools without explaining how the layers connect |
| Evidence | Says what each observation would prove or rule out | Collects dashboards and logs without updating a hypothesis |
| Operational judgment | Preserves evidence, limits blast radius, and verifies the mitigation | Restarts or kills a process before understanding the risk |
Google's Effective Troubleshooting chapter describes the same core loop: observe the system, form plausible hypotheses, test them against evidence, and correct the problem. In a major incident, restoring acceptable service can be more urgent than proving the final root cause.
A 60-Second Linux Troubleshooting Framework
Use this five-step structure whenever the prompt is vague:
- Scope: Clarify the expected behavior, actual behavior, start time, user impact, and whether the issue affects one host or a broader fleet.
- Observe: Check recent deploys, configuration or traffic changes, service health, logs, and a short sample of CPU, memory, disk, and network signals.
- Narrow: Rank two or three hypotheses. Choose a measurement that can distinguish them instead of gathering every metric available.
- Mitigate: Reduce impact with the lowest-risk reversible action, while preserving useful logs, profiles, and timestamps.
- Verify: Confirm user-facing recovery, watch for recurrence, and explain the durable follow-up.
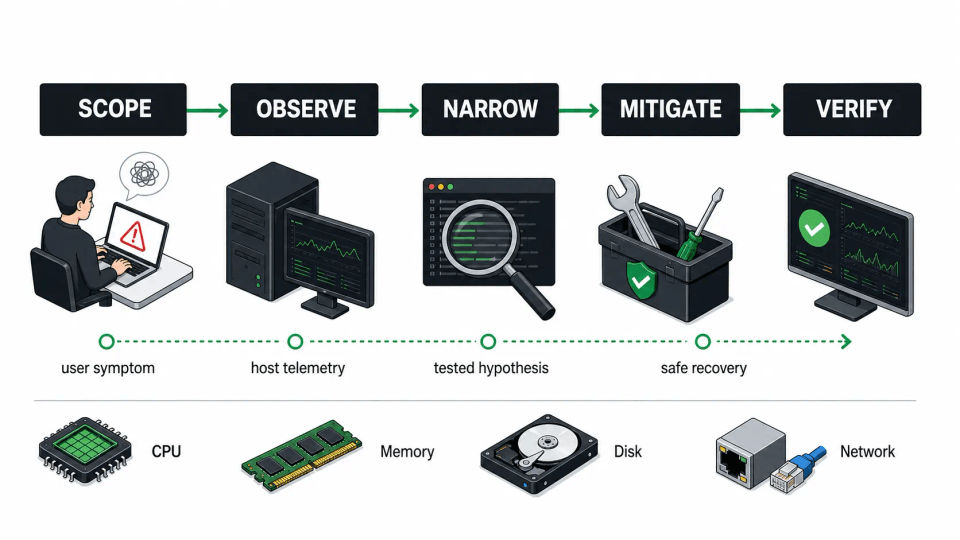
Scope, observe, narrow, mitigate, and verify before declaring the incident resolved.
A concise opening answer could sound like this:
"I would first clarify which user action is slow, when it started, and whether one host or the fleet is affected. I would compare a healthy and unhealthy path, check recent changes, and take a short time-series sample with service metrics plus host-level signals. From that evidence I would rank hypotheses, run the least invasive test that separates them, mitigate user impact, and verify both service recovery and resource pressure."
Linux Resource Signals: The Fast Map
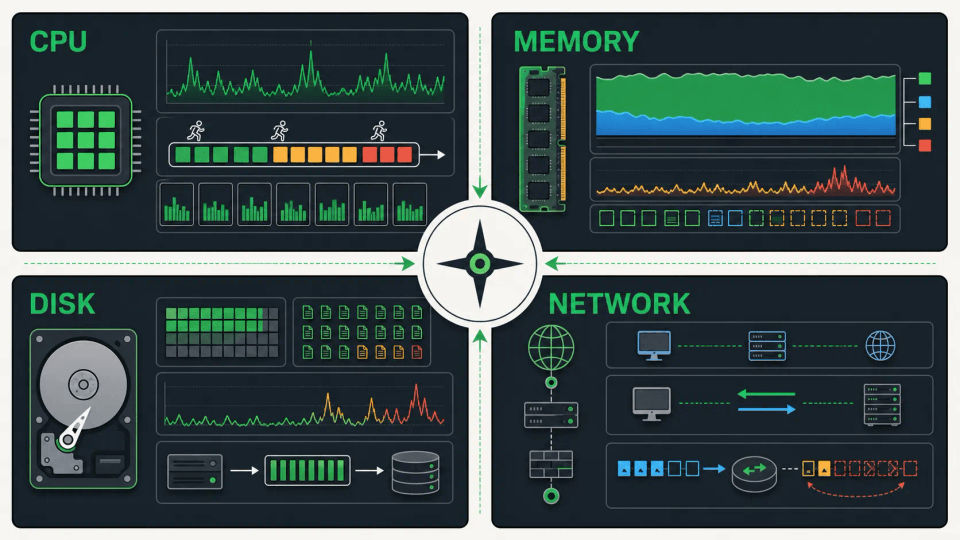
Do not diagnose from one percentage. Distinguish capacity, pressure, latency, and failure at each layer.
| Area | First distinction | Useful first evidence | Common trap |
|---|---|---|---|
| CPU | User, system, steal, or I/O wait | top, vmstat 1, pidstat | Assuming high load always means busy CPUs |
| Memory | Reclaimable cache or real pressure | free -h, vmstat 1, /proc/meminfo | Calling high "used" memory a leak |
| Disk | Capacity, inodes, or I/O latency | df, du, lsof, iostat | Deleting files before finding the consumer |
| Network | DNS, route, TCP/TLS, listener, or application | ip, ss, curl, dig | Using a successful ping as proof the request path works |
Some tools below, including pidstat, iostat, mtr, and tcpdump, may not be installed or permitted. In an interview, say what evidence you need and offer an available alternative. Knowing the decision is more important than recalling one exact flag.
CPU Troubleshooting Interview Questions
Scenario 1: CPU Is at 100%, but Throughput Is Flat
Start by asking whether every core is saturated and whether the increase is in user time, system time, steal time, or I/O wait. Then identify the process and, if needed, the hot thread.
uptime
top -H
vmstat 1
pidstat -u -t -p <PID> 1
vmstat separates runnable work from blocked work and reports CPU categories such as user, system, I/O wait, and steal. If one thread is hot, correlate it with request rate, error rate, a recent deploy, and application profiling. If profiling is allowed, perf top or a language-specific profiler can show where cycles are being spent.
Strong answer: "I would not kill the busiest process just because it is first in top. I would confirm whether it is doing useful work, spinning, handling an interrupt storm, or suffering from lock contention, then choose a reversible mitigation such as shifting traffic or rolling back the correlated change."
Scenario 2: Load Average Is 30, but CPU Looks Mostly Idle
Load average is not CPU utilization. Linux includes tasks that are runnable and tasks waiting in uninterruptible sleep, commonly while blocked on I/O. The official Linux load-average documentation makes that distinction explicit.
vmstat 1
ps -eo state,pid,comm,wchan:32 | awk '$1 ~ /^D/'
iostat -xz 1
Compare the run queue with the machine's CPU count, look for blocked tasks, and inspect storage latency or a stalled network filesystem. The strongest answer explains why high load plus idle CPU points away from simple compute saturation.
Memory Troubleshooting Interview Questions
Scenario 3: The Server Shows 95% Memory Used
Do not call this a leak yet. Linux intentionally uses otherwise idle memory for caches. Focus on MemAvailable, active swap movement, memory pressure, and whether application latency or OOM events are increasing.
free -h
vmstat 1
grep -E 'MemAvailable|Cached|Swap' /proc/meminfo
ps -eo pid,comm,rss,vsz --sort=-rss | head
The proc_meminfo manual documents the kernel's memory fields. A stable cache with healthy MemAvailable and no swap churn is different from rising resident memory, sustained si/so, or growing memory stall time.
Scenario 4: A Service Is Repeatedly OOM-Killed
Confirm the event in kernel logs, identify the process and limit involved, and determine whether the host is exhausted or a container hit its cgroup limit. Then compare usage over time with traffic, deploys, cache growth, and workload mix.
journalctl -k --since "30 min ago"
dmesg -T | grep -i -E 'oom|out of memory|killed process'
cat /proc/pressure/memory
The Linux kernel's Pressure Stall Information reports CPU, memory, and I/O contention through /proc/pressure. It can help distinguish allocated memory from workload time actually lost to resource pressure.
Mitigation is contextual: shift traffic, reduce concurrency, roll back a leak, or temporarily adjust a verified limit. "Add more memory" without identifying the growth pattern is not a complete diagnosis.
Disk Troubleshooting Interview Questions
Scenario 5: The Filesystem Is 100% Full
Separate byte capacity from inode exhaustion, then locate growth without crossing unrelated mounts. If df and du disagree, check for deleted files that are still held open by a process.
df -h
df -i
du -xhd1 /var 2>/dev/null | sort -h
lsof +L1
A deleted log can continue consuming blocks until the process closes its file descriptor. The safe response is not random deletion: identify the owner, preserve necessary evidence, rotate or truncate through the approved procedure, and verify that free space returns.
Scenario 6: The Application Is Slow, but Disk Space Is Fine
Capacity and performance are different questions. Inspect latency, queue depth, throughput, and which process is issuing I/O.
iostat -xz 1
vmstat 1
pidstat -d 1
cat /proc/pressure/io
Interpret %util with latency and queue behavior; by itself it can be misleading on parallel storage. Then ask whether the pattern is reads, writes, fsync pressure, swap activity, log volume, a backup, or a degraded remote volume.
Network Troubleshooting Interview Questions
Scenario 7: The App Works Locally but Remote Users Cannot Connect
Walk the path in order: process, listener, local request, interface and route, firewall or security policy, load balancer, DNS, TCP/TLS, then application behavior.
systemctl status <service>
ss -lntp
curl -v http://127.0.0.1:<port>/health
ip addr
ip route
If the service only listens on 127.0.0.1, remote traffic cannot reach it even though the local check succeeds. If it listens correctly, compare the same request from the affected network and verify the resolved address, route, policy, certificate, and upstream health.
Scenario 8: Only Some Users See Intermittent Timeouts
Intermittent failures demand comparison. Segment by region, resolver, IP family, load-balancer target, host, and request type. Then look for packet drops, retransmissions, connection pressure, or one unhealthy backend.
ss -s
ip -s link
nstat
dig <service-name>
mtr <destination>
Use tcpdump only when permitted and with a narrow filter. A packet capture should answer a question such as "Does the SYN reach this host?" or "Which side retransmits?" rather than become a substitute for a hypothesis.
One Cross-Resource Scenario: The API Slowed Down After a Deploy
This prompt tests whether you can connect layers. First compare the release marker with latency, error rate, throughput, and affected hosts. A rollback may be the fastest safe mitigation, but state what evidence makes the deploy the leading cause and what condition would trigger the rollback.
Then follow the new bottleneck. More CPU might come from a hot loop; more memory might trigger reclaim and disk I/O; longer database calls might grow connection queues; retries might amplify both CPU and network traffic. Resource graphs are symptoms until you connect them to the request path.
Practice this style with PracHub's real prompt, Troubleshoot CPU, latency, and DNS issues. Answer once with no hints, then add one new fact every two minutes and explain how it changes your ranking of hypotheses.
Common Mistakes That Cost Candidates the Round
Starting with commands instead of scope. You may spend ten minutes on one host while the evidence already points to a regional dependency or fleet-wide deploy.
Treating a metric as a root cause. High CPU, low free memory, or high load describes system state. Your job is to explain the workload and mechanism producing it.
Changing the system before preserving evidence. A restart can erase the hot thread, open file, kernel message, or timing correlation that would have explained the failure.
Stopping when the graph improves. Verify the user-facing symptom, watch the resource trend, record the change, and state how you would prevent or detect recurrence.
How to Practice Linux Troubleshooting for an SRE Interview
Pick one scenario and give yourself 15 minutes. Spend the first two minutes only on clarifying questions and a system model. For every command you name, finish the sentence: "If I see X, it supports Y; if not, I will test Z."
Next, reproduce safe failures in a disposable lab: create CPU contention, apply a memory limit, fill a small test filesystem, stop a listener, or break a test DNS record. Capture before-and-after evidence. Never run destructive experiments on a system you do not own or have permission to test.
Finally, map the interview for your target employer with PracHub's company-specific interview prep. A production engineering team may push deeper into Linux internals, while another SRE loop may combine host diagnosis with distributed systems and incident communication.
Linux Troubleshooting Interview FAQ
Which Linux commands should an SRE candidate memorize?
Know a small core well: ps, top, vmstat, free, df, du, lsof, ip, ss, curl, dig, systemctl, and journalctl. Also understand what evidence each command provides and what it cannot prove.
How deep should I know Linux internals?
For most SRE roles, be able to reason about processes and threads, scheduling, virtual memory, page cache and swap, file descriptors and inodes, filesystems, sockets, DNS, TCP, and systemd. More systems-focused roles may probe kernel behavior and networking more deeply.
What is the difference between load average and CPU usage?
CPU usage measures how processor time is spent. Linux load average counts tasks that are runnable or waiting in uninterruptible sleep over one, five, and fifteen minutes. That is why a machine can have high load while CPUs remain relatively idle.
What if my preferred tool is not installed?
State the signal you need, then offer alternatives. For example, if pidstat is unavailable, use repeated ps samples or top; if mtr is unavailable, combine route, DNS, TCP, and targeted reachability checks.
Should I prioritize mitigation or root-cause analysis?
Match the response to impact. During severe user harm, choose a safe, reversible mitigation while preserving evidence. Continue diagnosis after service is stable. For a low-impact interview scenario, you may have time to test more deeply before changing the system.
Final Takeaway
The best Linux troubleshooting answers are disciplined conversations with evidence. Scope the problem, read CPU, memory, disk, and network signals in context, test one useful hypothesis at a time, mitigate without creating a second incident, and verify the user experience.
Start with PracHub's slow-service SRE troubleshooting question, answer it aloud, and use the eight scenarios above as follow-ups. That turns a command cheat sheet into the reasoning interviewers actually need to see.
Comments (0)