Product Analyst SQL Case Interview: Event Data, Funnel Definitions, and Recommendations
Quick Overview
Practice a Product Analyst SQL case with a runnable event dataset, duplicate records, missing steps, and cross-day conversions. Compare three funnel definitions, verify which users qualify, and turn the results into a calibrated product recommendation.
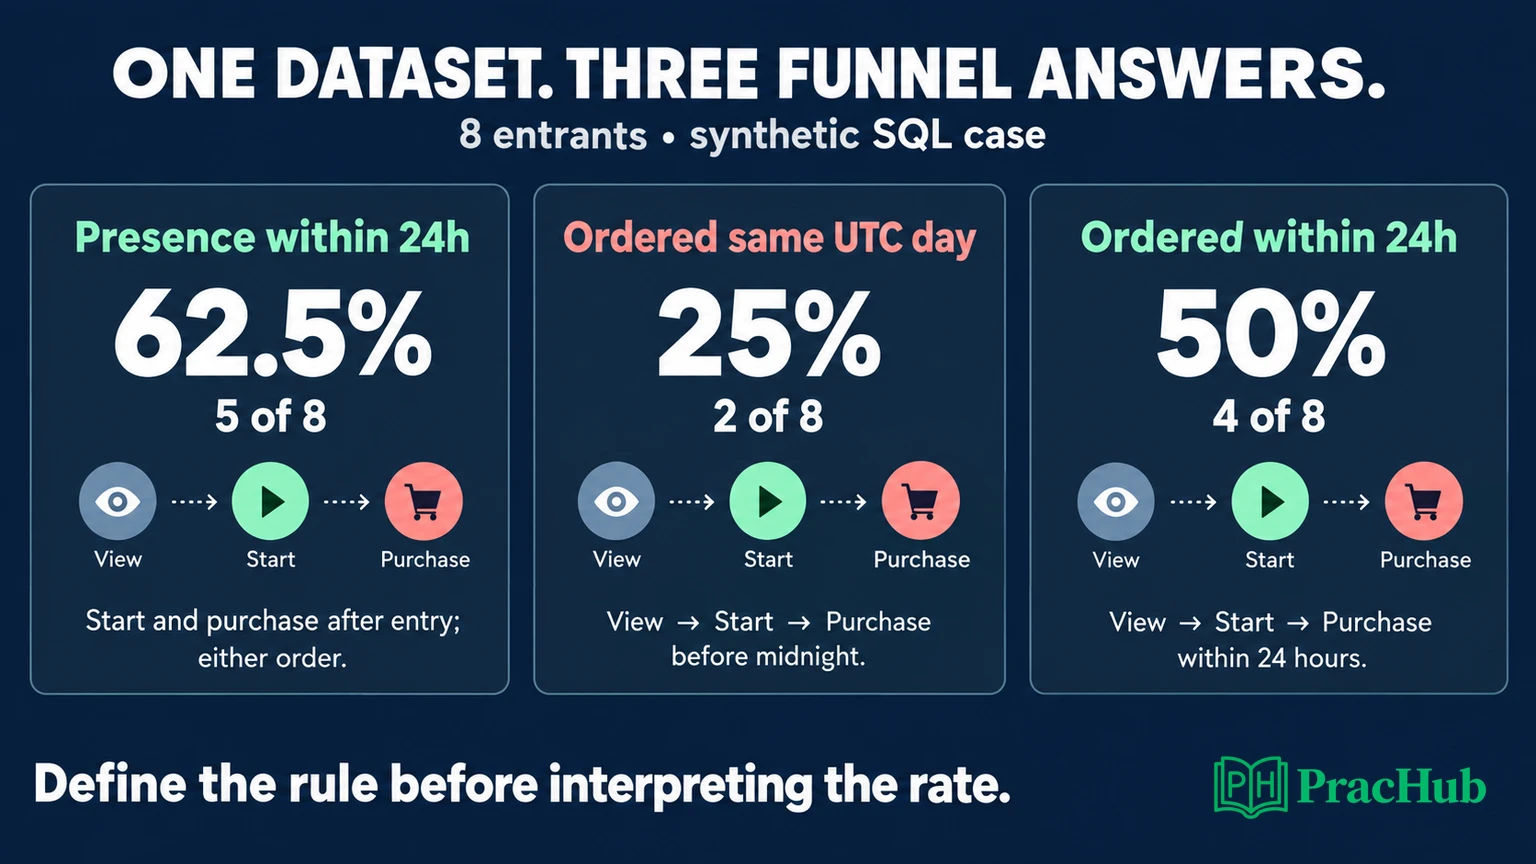
A Product Analyst SQL case interview starts before the first SELECT: define who enters the funnel, what counts as a conversion, and how long users have to finish. On the same event data, 62.5%, 25%, and 50% can all be correct under different rules. Explain which users qualify under each rule and how that changes the decision.
This is an original, runnable practice case, not a reconstruction of a candidate's interview. Official analytics-provider facts are labeled separately from our definitions and recommendations. Use PracHub's Product Analyst questions alongside the case to practice explaining assumptions, SQL, and business implications together.
Define the Product Decision and the Funnel
Original case: A checkout team asks, “What fraction of users who viewed checkout completed a purchase?” Before suggesting a redesign, you need to reconcile three dashboards that report different conversion rates.
Agree on the unit first. This exercise counts distinct users, anchored to each user's earliest observed view in the supplied dataset. The cohort contains users whose anchor falls on January 1, 2026, in UTC. It does not count sessions, orders, repeated attempts, or every visitor to the wider product.
The event sequence is view → start → purchase. A purchase means the event was recorded; the fixture does not establish settled revenue, absence of refunds, or customer satisfaction. A production metric would need those definitions if the decision concerned payment quality rather than recorded checkout completion.
Our three definitions share one denominator:
| Definition | Conversion rule |
|---|---|
| Presence within 24 hours | Both start and purchase occur after entry, within 24 hours; their relative order does not matter. |
| Ordered same UTC day | Start follows entry, purchase follows start, and purchase occurs before the entry day's midnight. |
| Ordered within 24 hours | Start follows entry, purchase follows start, and purchase occurs no later than 24 hours after entry. |
Official provider fact: Amplitude distinguishes any-order, specified-order, and exact-order funnels; specified-order funnels permit intervening events, while exact-order funnels restrict them. That supports asking about ordering, but our three definitions are custom SQL contracts, not replicas of Amplitude's implementation. How Amplitude computes funnels
Inspect a Small Dataset Before Aggregating
Run the following setup in a fresh SQLite database. All timestamps use the same UTC text format with second precision. The fixture includes one exact duplicate purchase, one purchase without a start, and one purchaser without any recorded entry.
CREATE TABLE raw_events (
  event_id TEXT, user_id TEXT,
  event_name TEXT, event_ts TEXT
);
INSERT INTO raw_events VALUES
('1v','u1','view','2026-01-01 10:00:00'),
('1s','u1','start','2026-01-01 10:05:00'),
('1p','u1','purchase','2026-01-01 10:10:00'),
('2v','u2','view','2026-01-01 23:50:00'),
('2s','u2','start','2026-01-01 23:55:00'),
('2p','u2','purchase','2026-01-02 00:10:00'),
('3v','u3','view','2026-01-01 10:00:00'),
('3p','u3','purchase','2026-01-01 10:05:00'),
('3s','u3','start','2026-01-01 10:10:00'),
('4v','u4','view','2026-01-01 10:00:00'),
('4p','u4','purchase','2026-01-01 10:10:00'),
('5v','u5','view','2026-01-01 10:00:00'),
('5s','u5','start','2026-01-01 10:05:00'),
('5p','u5','purchase','2026-01-02 11:00:00'),
('6v','u6','view','2026-01-01 10:00:00'),
('6s','u6','start','2026-01-01 10:05:00'),
('6p','u6','purchase','2026-01-02 10:00:00'),
('7v','u7','view','2026-01-01 10:00:00'),
('7s','u7','start','2026-01-01 10:05:00'),
('8v','u8','view','2026-01-01 10:00:00'),
('8s','u8','start','2026-01-01 10:05:00'),
('8p','u8','purchase','2026-01-01 10:10:00'),
('8p','u8','purchase','2026-01-01 10:10:00'),
('0p','u0','purchase','2026-01-01 10:10:00');
CREATE VIEW events AS
SELECT DISTINCT event_id, user_id, event_name, event_ts
FROM raw_events;
CREATE VIEW entries AS
SELECT user_id, MIN(event_ts) AS entered_at
FROM events
WHERE event_name = 'view'
GROUP BY user_id
HAVING entered_at >= '2026-01-01 00:00:00'
   AND entered_at < '2026-01-02 00:00:00';
The events view removes identical repeated rows. This is safe under our stated contract: a repeated event ID has the same payload. It is not a general method for resolving conflicting versions. If an ID appears with different timestamps or users, investigate the producer's rules instead of assuming DISTINCT selects the correct version.
There are 24 raw rows and 23 distinct events. Eight users enter the cohort; u0 has only a purchase and is excluded. Track that purchase without an entry in a separate quality check. Automatically inventing an entry would change the population and conceal a possible instrumentation gap.
MIN(event_ts) finds the earliest view in the data available to this query. It does not prove that someone is a first-ever customer. Production analysis needs sufficient history or a maintained entry table if the metric requires lifetime first entry.
Compute Three Definitions Without Multiplying Users
This query produces one set of conversion flags per entrant. EXISTS asks whether a qualifying start/purchase pair exists, so multiple matching pairs do not create multiple converted users.
We executed both SQL blocks using SQLite 3.51.0. Official SQL behavior: SQLite's unixepoch() returns seconds for these timestamps, allowing an explicit 86,400-second comparison. Date/time syntax differs across engines; adapt the functions if your interview environment uses another dialect. SQLite date and time functions
WITH flags AS (
  SELECT c.user_id,
    EXISTS (
      SELECT 1 FROM events s JOIN events p
        ON p.user_id = s.user_id
      WHERE s.user_id = c.user_id
        AND s.event_name = 'start'
        AND p.event_name = 'purchase'
        AND s.event_ts > c.entered_at
        AND p.event_ts > c.entered_at
        AND unixepoch(s.event_ts)
            <= unixepoch(c.entered_at) + 86400
        AND unixepoch(p.event_ts)
            <= unixepoch(c.entered_at) + 86400
    ) AS presence_24h,
    EXISTS (
      SELECT 1 FROM events s JOIN events p
        ON p.user_id = s.user_id
      WHERE s.user_id = c.user_id
        AND s.event_name = 'start'
        AND p.event_name = 'purchase'
        AND s.event_ts > c.entered_at
        AND p.event_ts > s.event_ts
        AND date(p.event_ts) = date(c.entered_at)
    ) AS ordered_day,
    EXISTS (
      SELECT 1 FROM events s JOIN events p
        ON p.user_id = s.user_id
      WHERE s.user_id = c.user_id
        AND s.event_name = 'start'
        AND p.event_name = 'purchase'
        AND s.event_ts > c.entered_at
        AND p.event_ts > s.event_ts
        AND unixepoch(p.event_ts)
            <= unixepoch(c.entered_at) + 86400
    ) AS ordered_24h
  FROM entries c
), totals AS (
  SELECT 'Presence within 24h' AS definition,
         COUNT(*) AS entrants, SUM(presence_24h) AS converted
  FROM flags
  UNION ALL
  SELECT 'Ordered same UTC day', COUNT(*), SUM(ordered_day)
  FROM flags
  UNION ALL
  SELECT 'Ordered within 24h', COUNT(*), SUM(ordered_24h)
  FROM flags
)
SELECT definition, entrants, COALESCE(converted, 0) AS converted,
       ROUND(100.0 * converted / NULLIF(entrants, 0), 1) AS pct
FROM totals;
The comparisons are deliberately strict between steps: equal timestamps do not establish sequence. The 24-hour endpoint is inclusive. Other events may occur between the named steps. Say these rules aloud; changing > to >= or <= to < changes the metric.
Official provider caveat: Amplitude documents special handling for simultaneous events, including second-level ordering behavior. A warehouse query with strict comparisons can therefore disagree with a tool even when both are functioning as configured. Compare timestamp resolution and ordering policies before calling either result wrong. Amplitude simultaneous-event handling
The totals CTE keeps the queries comparable. Floating-point multiplication avoids integer percentage truncation, and NULLIF protects the denominator. With no entrants, the query reports zero converted users and a null percentage: no observed population is different from an observed population with zero conversions.
Reconcile the Output User by User
Executed results: Presence within 24 hours returns 5/8, or 62.5%. Ordered same-day conversion returns 2/8, or 25%. Ordered 24-hour conversion returns 4/8, or 50%.
Users u1 and u8 satisfy all three definitions. The repeated 8p row does not add another person. User u2 enters at 23:50 and purchases at 00:10 the following day: only 20 minutes elapsed, but a UTC calendar boundary excludes that purchase from the same-day funnel.
User u3 purchases before starting checkout. Both events are present after entry, so the presence metric counts that user. Neither ordered metric does. This might represent unusual behavior, misnamed events, or logging problems in a real dataset; the synthetic record establishes only its observed sequence.
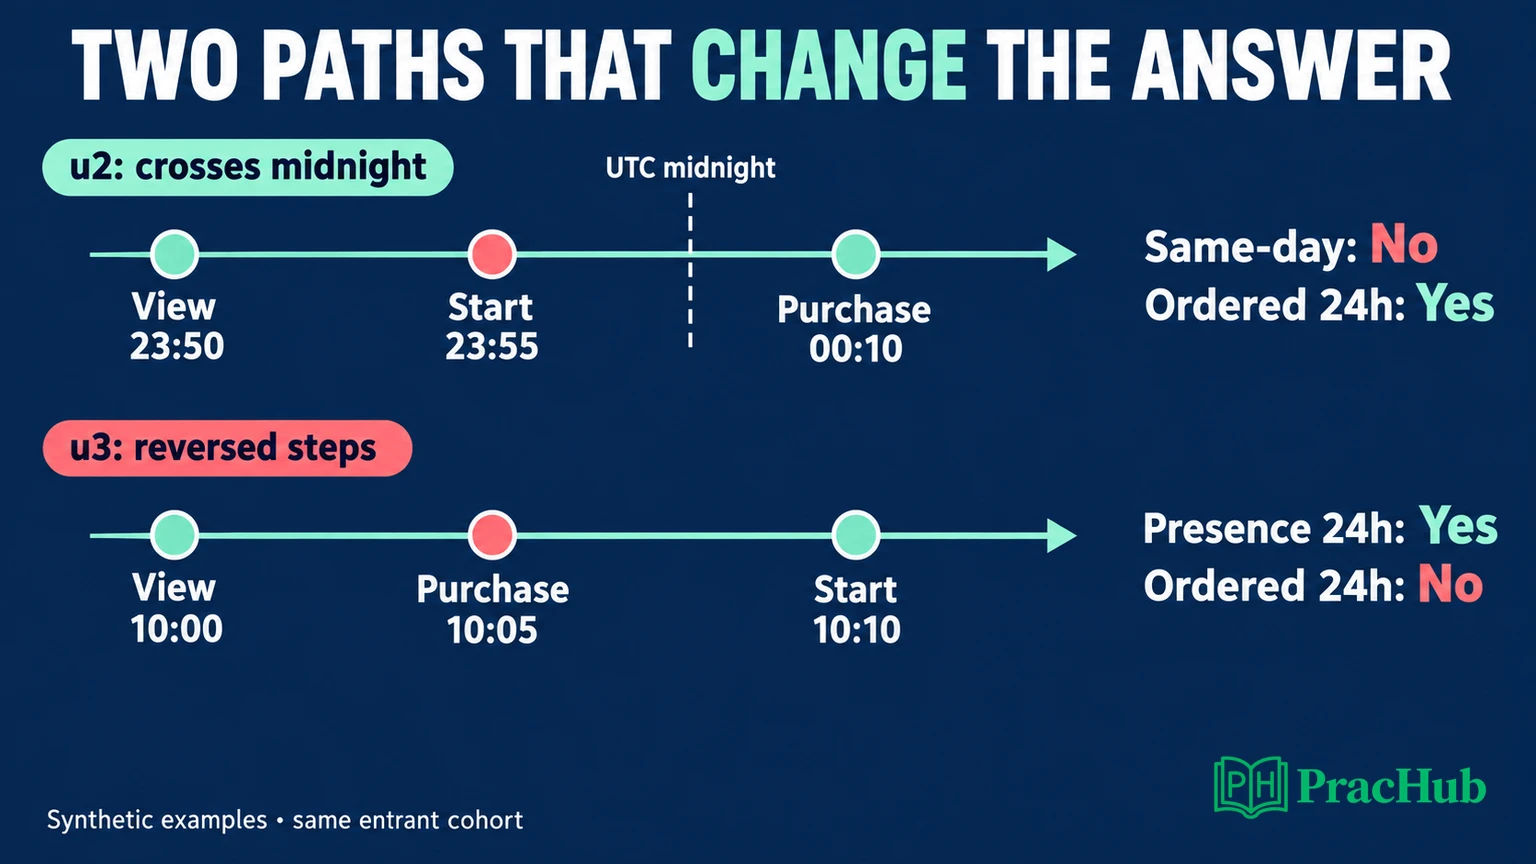
User u6 purchases exactly 24 hours after entry and qualifies under the inclusive rolling window. User u5 purchases after 25 hours and fails all three definitions. User u4 lacks a start, while u7 lacks a purchase; neither completes the three-step funnel.
This explains both gaps. Moving from same-day to ordered 24-hour conversion admits u2 and u6. Removing the start-before-purchase requirement additionally admits u3. No product behavior improved when the reported rate changed; only the counting rules changed.
Test the Boundaries That Could Reverse Your Answer
Original verification: We checked that another identical 8p row leaves every percentage unchanged. Moving u6's purchase one second beyond the 24-hour endpoint lowers ordered conversion to 3/8. Moving u3's start before its purchase raises ordered 24-hour conversion to 5/8.
Also test repeated entry. Adding a later view and a purchase 25 hours after u7's original view does not qualify that user under this first-entry contract. An “any qualifying attempt” funnel could count a later path, but would answer a different question. Do not silently restart the clock because the later path converts.
Before comparing recent cohorts, establish how far the source data is complete. An entrant at 23:50 on January 1 needs data through 23:50 on January 2 for a full 24-hour assessment, plus whatever ingestion allowance the source requires. Filtering every event to January 1 before joining would erase valid next-day conversions.
Official provider fact: Amplitude's conversion-over-time documentation associates conversion with entry-date cohorts and identifies cohorts whose windows have not closed. The practical lesson is to compare equally mature cohorts, rather than treating recently entered users as finished failures. Interpret your funnel analysis
This fixture assumes all relevant events have arrived. Production data needs an explicit observation cutoff and a policy for late arrivals. Preserve the cohort definition when recomputing a historical result, and record whether changes reflect newly received events or revised logic.
Turn the Difference Into a Recommendation
Preparation recommendation: Choose the definition that answers the team's decision, then explain the other two as diagnostic views. If checkout completion allows users to return the next day, the ordered 24-hour measure is a reasonable candidate here. Its 50% result preserves sequence without making midnight a behavioral deadline.
That choice is not universally correct. A same-day operational report may intentionally use a calendar cutoff. A presence measure can help reconcile whether events exist, but it cannot establish the checkout sequence. Choose a window that matches the product question and the time users need to decide.
A concise stakeholder answer would be: “Four of eight entrants complete the recorded steps in order within 24 hours. The same-day dashboard excludes two valid cross-day paths. The presence dashboard adds one reversed path. I would align the primary definition before evaluating a redesign, then investigate that reversed path and the missing-start records.”
Do not call the remaining four users recoverable revenue. This tiny fixture supplies neither a representative baseline nor causal evidence. A missing purchase could reflect abandonment, a delayed purchase, a tracking failure, or an identity mismatch. The query alone does not choose among those explanations.
If the team proposes a checkout change, specify the next evidence needed: reliable exposure assignment, a prespecified conversion window, mature cohorts, and suitable quality guardrails such as payment failures or refunds. A randomized comparison may help estimate impact when feasible. These are original preparation suggestions, not results from the synthetic data.
Explain How the Model Would Grow
The compact schema intentionally omits checkout IDs and identity stitching. In a multi-attempt product, joining only on user ID could combine a start from one checkout with a purchase from another. If the metric requires the same attempt, add a stable attempt key to both events and the matching conditions.
Keep segmentation tied to a defined moment. For an entry-platform comparison, use the platform at entry rather than the platform of whichever event happens to join last. Distinguish authenticated user IDs from anonymous device IDs, and explain how identity merges affect historical counts.
For scale, inspect the query plan and event cardinalities before claiming an optimization. Reusable cohort tables and indexes aligned with user, event name, and time may help, but performance depends on the engine and workload. The fixture proves the stated results; it is not a production benchmark.
Practice the Case's Separate Skills
These verified PracHub records cover related SQL and analytics skills across companies and roles. Treat them as reported practice material, not predictions of your exact Product Analyst interview.
| PracHub question | What to practice |
|---|---|
| Compute Company Suggestion Funnels | Explain the denominator and completions without earlier steps. |
| Deduplicate events and rank products with SQL | Separate duplicate identity from legitimate repeat behavior. |
| Write SQL to compute shop visibility share | Keep the unit and eligible population consistent across rates. |
| Boost App Installs: Analyze and Experiment with Conversion Funnel | Connect a funnel diagnosis to an evaluation plan. |
| Demonstrate rapid analysis and stakeholder debrief | Present a recommendation with the uncertainty that matters. |
Continue with Product Analyst interview questions. For your next practice answer, change one rule in this fixture, predict exactly which users move, and rerun the SQL before writing the recommendation.
Comments (0)