Linear Regression And OLS Inference
Asked of: Data Scientist
Last updated
What's being tested
Interviewers are probing whether you understand ordinary least squares beyond fitting `LinearRegression()` and reading a coefficient table. You need to reason from first principles about identifiability, sampling variance, standard errors, p-values, feature transformations, and what changes when data assumptions are violated. Google cares because Data Scientists often use regression for metric decomposition, experiment analysis, pricing or ads diagnostics, and causal-ish adjustment; wrong inference can turn a duplicated log row or high-dimensional feature set into a false product conclusion. Strong answers separate prediction from inference, effect size from statistical significance, and algebraic invariance from modeling choices like regularization.
Core knowledge
-
OLS objective estimates coefficients by minimizing squared residuals:
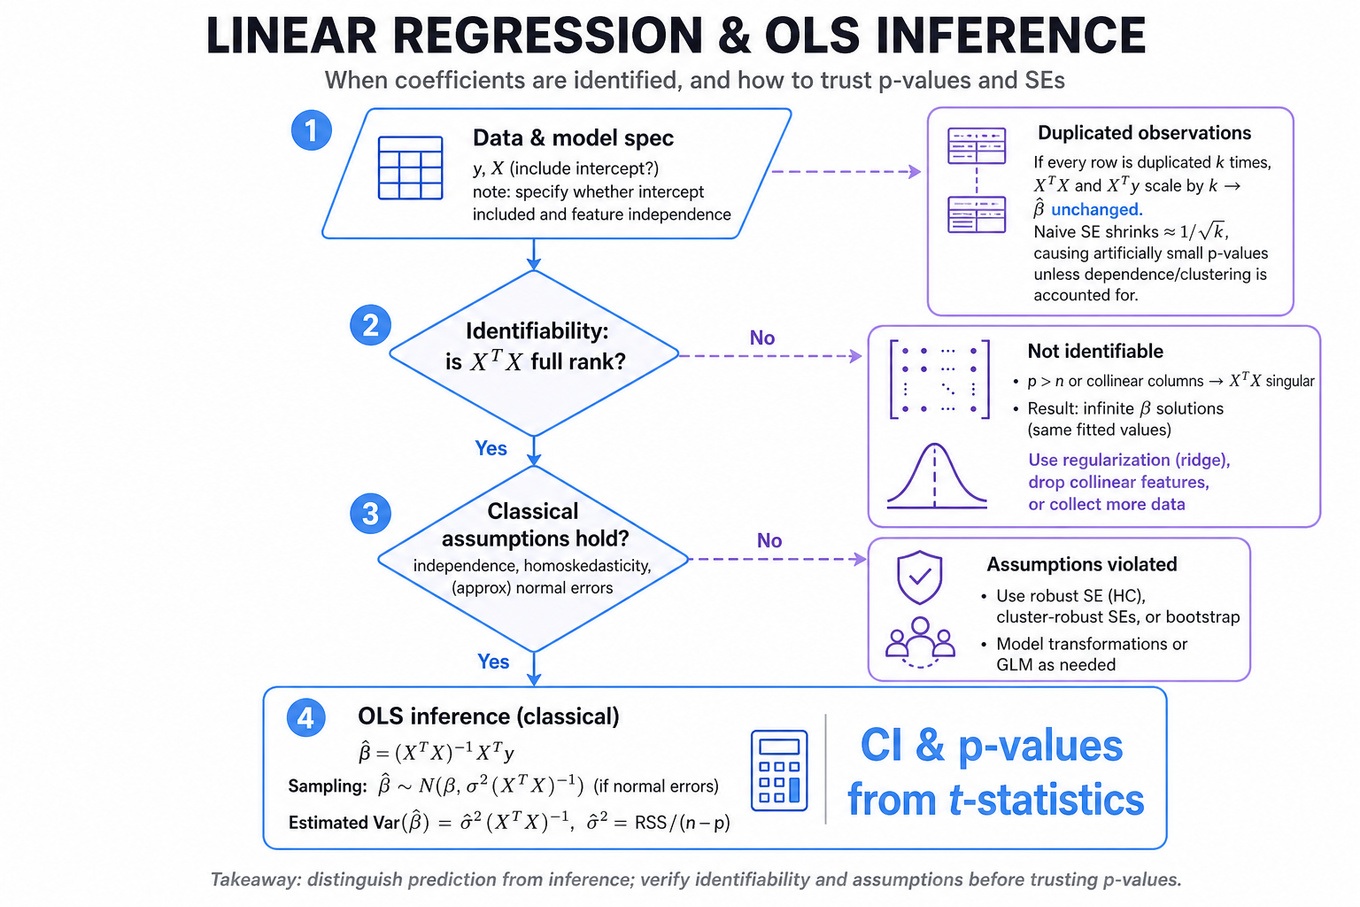
If has full column rank, For DS interviews, always state whether an intercept is included and whether features are linearly independent. -
Identifiability requires enough independent information to estimate parameters. If or columns of are collinear, is singular and infinitely many vectors can produce the same fitted values. You can still predict with constraints, but plain OLS coefficients are not uniquely identified.
-
Sampling distribution under classical assumptions is
if errors are normal, or approximately normal by large-sample arguments. The estimated variance is -
Duplicated observations do not create new independent evidence. If every row is duplicated times, is unchanged because both and are multiplied by . Naive standard errors shrink roughly by , causing artificially smaller p-values unless dependence or clustering is accounted for.
-
P-values measure compatibility with a null effect, not practical importance. With very large , tiny effects can be statistically significant; with small or noisy samples, meaningful effects may be non-significant. In product settings, pair p-values with confidence intervals, business impact, and metrics like lift in
`CTR`, retention, or revenue. -
Effect-size metrics such as , adjusted , RMSE, MAE, and coefficient magnitude answer different questions. can remain unchanged under duplicated rows even as p-values become tiny. For skewed or imbalanced outcomes, MAE, quantile loss, calibration by segment, or weighted metrics may communicate model quality better than aggregate RMSE.
-
Invertible linear transformations of features preserve fitted values for unregularized OLS. If for invertible matrix , then coefficients transform as , and predictions satisfy . Coefficients change coordinate systems; predictions remain the same.
-
Regularization breaks some invariances because penalties depend on the coordinate representation. Ridge regression minimizes and is sensitive to feature scaling, though it is rotationally more stable than lasso. Lasso minimizes and can select different variables under correlated or transformed features.
-
High-dimensional regression needs constraints or assumptions. When , use ridge for stable prediction, lasso or elastic net for sparse signals, dimensionality reduction such as PCA, or domain-driven feature grouping. For inference after variable selection, naive p-values are invalid unless using methods designed for post-selection inference or sample splitting.
-
Robust inference matters when assumptions fail. Heteroskedasticity invalidates classical standard errors even if coefficients remain unbiased under exogeneity; use heteroskedasticity-robust standard errors like Huber-White sandwich estimators. Repeated users, sessions, or geo units often require cluster-robust standard errors at the independent assignment or sampling unit.
-
Communication is part of the skill. To non-technical stakeholders, describe regression as estimating the average relationship between inputs and an outcome while holding included variables fixed. Avoid saying “X causes Y” unless the design supports causality through randomization, quasi-experiment design, or a credible identification strategy.
-
Diagnostics should be tied to the decision. Residual plots, leverage and influence checks, multicollinearity via VIF, train/test error, and segment-level performance reveal different failure modes. For Google-scale product data, the issue is often not computational feasibility but whether billions of rows represent independent units or repeated measurements.
Worked example
For Analyze Linear Regression Changes with Duplicated Observations, a strong candidate would first clarify whether rows are duplicated exactly, whether all rows or only a subset are duplicated, and whether the duplicated rows represent true repeated measurements or an ETL/logging artifact. They would state an assumption: “If every observation is duplicated identically and treated as independent by the model, the point estimate stays the same, but naive inference changes.”
The answer skeleton should have four pillars. First, show the algebra: duplicating all data times multiplies and by , so is unchanged. Second, explain that RSS also multiplies by , but the apparent sample size increases, so standard errors usually shrink and t-statistics inflate. Third, distinguish valid repeated evidence from artificial duplication: if these are not independent draws, smaller p-values are misleading. Fourth, discuss practical implications: and fitted values may stay the same while p-values and confidence intervals become overconfident.
A good tradeoff to flag is whether to deduplicate the data or use weights/cluster-robust standard errors. If duplication is a logging artifact, deduplication is the cleanest analysis choice; if rows reflect repeated observations from the same user or item, the right unit of independence may be user-level clustering or aggregation. The close could be: “If I had more time, I would inspect duplication patterns by user, timestamp, and feature vector, then rerun the model with deduplicated data and cluster-robust inference to quantify how much the conclusion depends on independence assumptions.”
A second angle
For Estimate b when features exceed samples, the same core idea shifts from duplicated information to insufficient independent information. Instead of becoming artificially large through repeated rows, it becomes non-invertible because there are more parameters than independent constraints. The candidate should say that OLS coefficients are not uniquely estimable, even though many coefficient vectors may fit the training data perfectly. The practical response is to introduce structure: ridge for stable prediction, lasso if sparsity is plausible, PCA if signal lies in a lower-dimensional subspace, or collect more data if interpretability of individual coefficients is required. The interviewer may then push on inference, where the key point is that standard OLS p-values do not automatically apply after regularization or feature selection.
Common pitfalls
Pitfall: Saying duplicated observations “improve accuracy because sample size increases.”
This is the classic analytical mistake. Exact duplicates do not add independent information; they only make software believe the evidence is stronger. A better answer separates point estimates, standard errors, p-values, and effect sizes.
Pitfall: Explaining regression only as “drawing the best-fit line.”
That communication may work for one feature, but it hides the “holding other variables fixed” interpretation and fails for high-dimensional product data. For non-technical stakeholders, say regression estimates an average relationship between inputs and an outcome, then immediately caveat that association is not causation unless the data design supports it.
Pitfall: Treating regularization as a minor implementation detail.
Ridge and lasso change the estimator, the interpretation, and the inference story. In high-dimensional settings, they are not just ways to “make inverse work”; they encode assumptions about coefficient size or sparsity and can change which features appear important.
Connections
Interviewers can pivot from here to causal inference, especially omitted-variable bias, randomized experiments, and regression adjustment. They may also move into model evaluation for regression, including RMSE versus MAE, calibration, segment-level residual analysis, and robustness under skewed outcomes. Adjacent statistics topics include multicollinearity, heteroskedasticity-robust inference, bootstrap confidence intervals, and multiple hypothesis testing.
Further reading
-
Hastie, Tibshirani, and Friedman, The Elements of Statistical Learning — strong treatment of OLS, ridge, lasso, and high-dimensional prediction.
-
Angrist and Pischke, Mostly Harmless Econometrics — practical framing for regression inference, standard errors, and causal interpretation.
-
Wasserman, All of Statistics — concise reference for sampling distributions, confidence intervals, and hypothesis testing.
Featured in interview prep guides
Practice questions
- Prove OLS invariance to linear transformsGoogle · Data Scientist · Technical Screen · medium
- Test a coefficient and explain t-distributionGoogle · Data Scientist · Technical Screen · medium
- Estimate b when features exceed samplesGoogle · Data Scientist · Technical Screen · medium
- Analyze data duplication effects in linear regressionGoogle · Data Scientist · Technical Screen · medium
- Explain Linear Regression to Non-Technical StakeholdersGoogle · Data Scientist · Technical Screen · medium
- Analyze Linear Regression Changes with Duplicated ObservationsGoogle · Data Scientist · Technical Screen · medium
Related concepts
- Linear Regression, OLS Diagnostics And Assumptions
- Logistic Regression And Linear ModelsMachine Learning
- Statistical Inference, Regression, And ProbabilityStatistics & Math
- Logistic Regression, Regularization, And Imbalanced ClassificationMachine Learning
- Supervised ML Fundamentals, Evaluation And Feature EngineeringMachine Learning
- Causal Inference And IdentificationStatistics & Math