CodeSignal Data Analytics Assessment: CSV Tasks, Coding, and Practice
Quick Overview
A practical guide to the standard CodeSignal Data Analytics Assessment, separating official format and tool rules from original CSV, aggregation, and SQL exercises.
The CodeSignal Data Analytics Assessment (DAA) combines data analysis with a coding task. Preparing only with algorithm puzzles misses the CSV workflow; preparing only in a spreadsheet misses the requirement to produce and submit work inside the assessment.
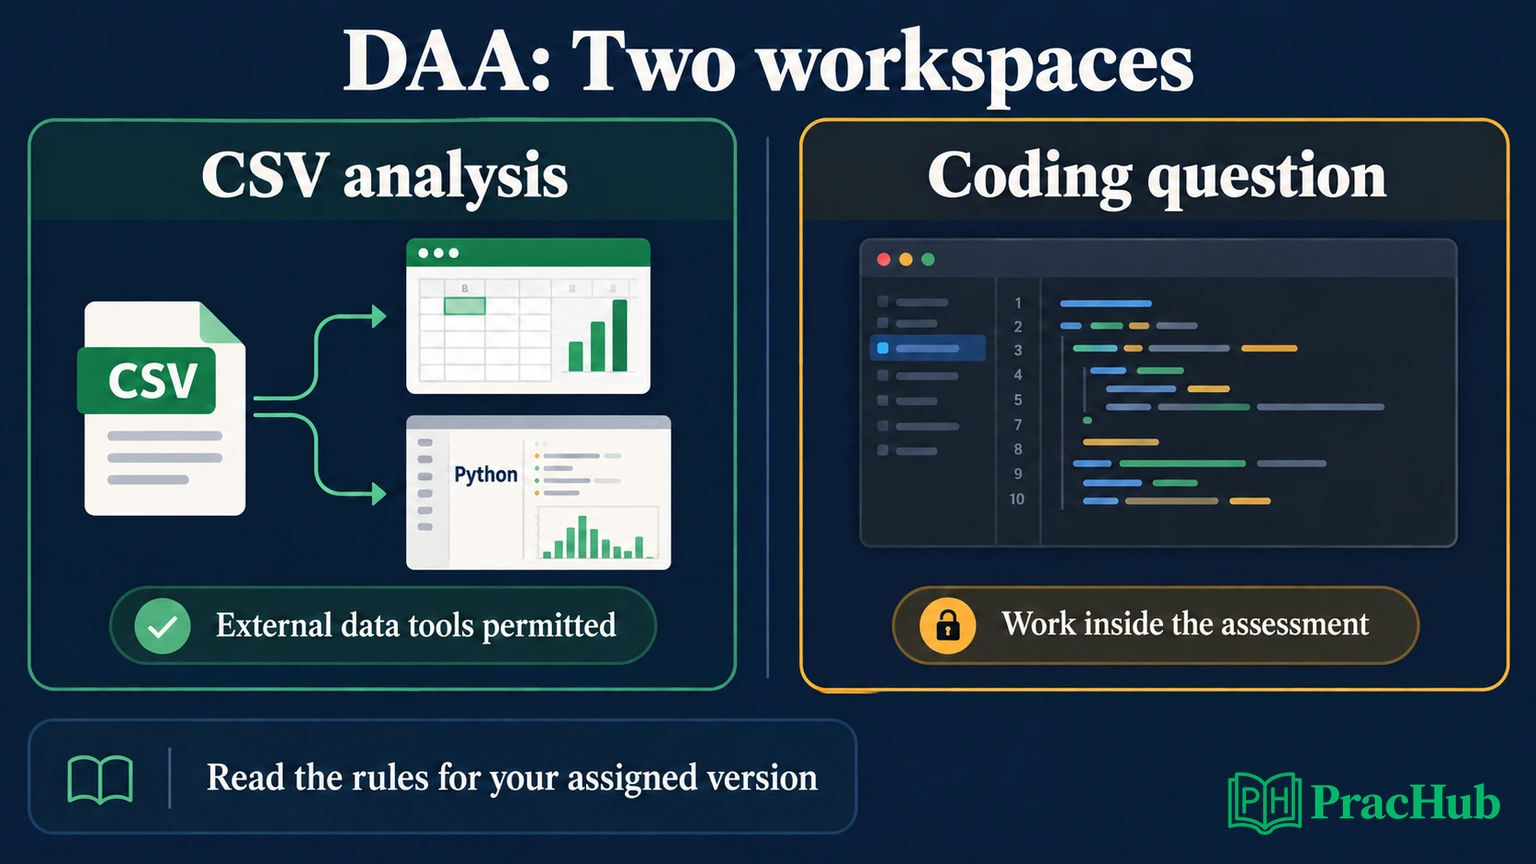
Official format, checked September 8, 2026: CodeSignal describes the standard DAA as 1 coding question and 14 quiz questions in 70 minutes. All questions are available when the timer begins. You can analyze supplied CSV files with external data tools, but the coding question must be completed in the assessment itself, without an outside IDE. Official DAA structure
This guide separates those rules from original practice exercises. For complementary SQL and analysis practice, use PracHub's Data Analyst questions. The worked data below is invented for preparation and is not a CodeSignal test dataset.
First, confirm which CodeSignal assessment you have
A CodeSignal invitation is not automatically a General Coding Assessment. The DAA has its own structure, task mix, and tool rules. Instructions from an employer's custom assessment may describe something different again.
There is also a naming distinction worth checking: CodeSignal's current product catalog separately lists an AI-Assisted Data Analytics Assessment. This article addresses the standard DAA described in the candidate help pages. Do not transfer its timing or assistance rules to another named assessment, or assume that an AI-assisted product listing grants permission to use AI in your assigned test. CodeSignal assessment catalog
Before preparing a detailed schedule, read the assessment name and instructions in your invitation. Identify the listed question types, allowed tools, and submission requirements. This prevents an avoidable mismatch between your practice setup and the environment you will actually use.
Keep CSV analysis and platform coding separate
Official rule: CodeSignal permits external applications to view and manipulate the supplied CSV files, naming Excel, Google Sheets, R, and Python as examples. Its DAA setup page also requires proctoring and says to arrange access to suitable data tools before starting. Rules and setup
That permission has a specific purpose: working with the data files. The structure page's restriction on outside IDEs applies to the coding question. Treat these as two workspaces with different rules rather than a contradiction.
Original preparation advice: Rehearse downloading an ordinary CSV, locating it, opening it with your chosen tool, and calculating a small summary. Separately, practice writing a database query in a browser editor. Becoming fluent in those transitions can save more time than learning another analysis library the night before.
Choose the tool you can inspect and debug confidently. A spreadsheet is suitable when you can control import types, filters, and aggregations. Python or R can make repeated transformations easier to reproduce. Familiarity matters more than choosing the tool that looks most technical.
Inspect the data contract before calculating
A data contract is your working understanding of what each row, column, and value means. Start with the unit of observation: one row might represent an order, an order item, a customer, or an event. Those are different denominators even when the files share an order_id column.
Check the header, row count, missing values, and candidate key. Preserve identifiers as text when their spelling matters; converting 001 into 1 may break a later match. Inspect date formats and time zones before applying a period filter. A timestamp close to midnight can belong to a different reporting day after conversion.
Do not split arbitrary CSV text on commas. Quoted fields can contain delimiters or line breaks. Python's official csv documentation provides reader and DictReader for parsing these records and recommends newline='' when opening a file. That is a parsing choice, not a substitute for validating the data's meaning. Python CSV documentation
Then translate the question into an explicit metric. “Average order value” needs an eligible order population and a rule for missing amounts. “Top region” needs a measure and a tie rule. A correct transformation can still answer the wrong question if you skip those definitions.
Original CSV exercise: reconcile the rows first
Copy this small dataset into a CSV file for practice. Assume one record should represent one order. The repeated 002 row is an exact duplicate and should count once. An empty amount is unknown; a numeric zero is a valid amount.
order_id,customer_id,region,status,amount
001,u01,East,paid,100.00
002,u02,West,paid,50.00
002,u02,West,paid,50.00
003,u01,East,refunded,40.00
004,u03,East,paid,
005,u04,West,paid,0.00
006,u05,East,paid,150.00
007,u06,West,pending,200.00
Task: After removing the exact duplicate, calculate the total recorded amount and average amount for paid orders with known amounts. Also report how many paid orders have unknown amounts. Exclude refunded and pending orders from this exercise; do not invent a net-revenue interpretation.
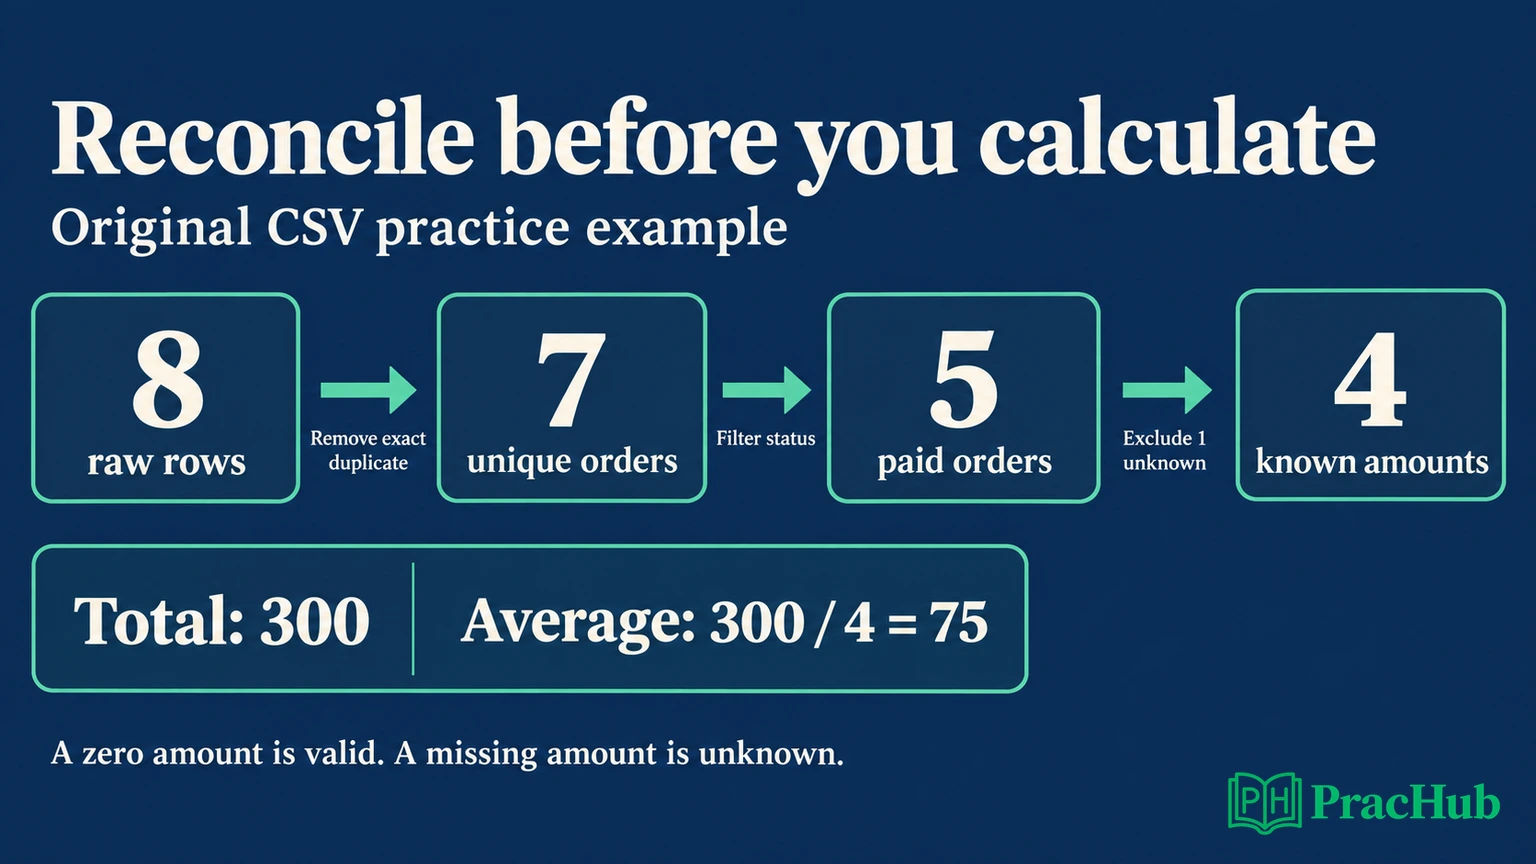
The file contains 8 data rows but 7 unique orders. Five unique orders have status paid. Of those, four have known amounts and one has a missing amount. Your reconciliation should therefore read:
8 raw rows → 7 unique orders → 5 paid orders → 4 known amounts.
The known paid amounts are 100, 50, 0, and 150. Their total is 300, and their average is 300 / 4 = 75. The unknown-amount count is 1. Keep that count alongside the answer so the limitation remains visible.
These checks distinguish three common mistakes. Keeping the duplicate produces a known-amount total of 350. Filling the missing amount with zero preserves the total but changes the average to 60. Removing the legitimate zero leaves three amounts and incorrectly raises the average to 100.
Make missing values and duplicates explicit decisions
The exercise defines exact duplicates, so removing one copy is justified. In a different file, two rows with the same order ID might represent separate items, a status update, or a correction. Automatically keeping the first row could discard valid information.
Check the fields that differ before choosing a deduplication rule. If a task supplies a version or update timestamp, use its specified precedence. If it defines a compound key, preserve that grain. Do not quietly invent a “latest record wins” rule because it is convenient to implement.
Missing values need the same care. Unknown revenue is not zero revenue. Excluding an unknown amount from an average can be correct for a question explicitly asking about observed values, while still leaving incomplete coverage. State the population you measured rather than implying it represents every paid order.
In a spreadsheet, inspect the aggregation's included range and filter behavior. In code, inspect the number of records before and after each transformation. A compact check of row counts, unique keys, and totals often catches more mistakes than immediately drawing a polished chart.
Translate the same contract into SQL
Official environment information: CodeSignal lists MySQL, PostgreSQL, and Microsoft SQL for DAA database questions. This supports practicing SQL; it does not establish that the general assessment's entire programming-language list is available in your DAA. Confirm the environment shown for your question. Certified assessment environments
For an original SQL version of the exercise, assume the CSV has already been loaded into orders_clean: exact duplicates removed, amount stored as a numeric column, and the blank imported as NULL. Return each region's known paid-order count, total, and average, ordered by total descending and region ascending for ties.
SELECT
    region,
    COUNT(*) AS known_paid_orders,
    SUM(amount) AS total_amount,
    AVG(amount) AS average_amount
FROM orders_clean
WHERE status = 'paid'
  AND amount IS NOT NULL
GROUP BY region
ORDER BY total_amount DESC, region ASC;
The result is East with 2 known paid orders, total 250, average 125; then West with 2, total 50, average 25. The zero-amount West order belongs in the count. The explicit null filter makes COUNT(*) count the same population used for the amount calculations.
The query intentionally does not clean an arbitrary CSV or resolve conflicting duplicates. Those are stated prerequisites. Keeping the preparation stages separate makes it easier to locate a wrong answer: import, cleaning, eligibility filtering, aggregation, or output formatting.
Check joins before trusting an aggregate
A second original variation moves the region into a customer lookup table. You join on customer_id before grouping. If customer u02 appears twice in that lookup, its 50-unit paid order can appear twice in the joined result. The total becomes 350 even though the cleaned order table still totals 300.
Before joining, verify the expected relationship. A many-to-one lookup requires at most one matching lookup row per order's customer key. After joining, compare row counts and amount totals with the input. An unexplained increase is a reason to inspect matching keys, not immediately add DISTINCT to the final answer.
Also decide what should happen to unmatched customers. An inner join can drop their orders; a left join preserves them with missing lookup values. Neither is universally correct. Follow the requested population and make the missing category visible when appropriate.
The general habit is to reconcile at every point where the population can change. A query that executes successfully proves that the syntax was accepted. It does not prove that the join preserved the intended business meaning.
Turn calculations into answers you can verify
Read the requested output before selecting an option or submitting a query. Check whether the question asks for a count, a proportion, a percentage-point difference, or a relative change. A change from 10% to 12% is 2 percentage points and a 20% relative increase; those are different answers.
For a rate, identify the numerator and denominator separately. Do not average subgroup percentages unless that is the specified metric. If one group converts 1 of 10 users and another converts 18 of 90, the combined rate is 19 of 100, or 19%. Averaging their 10% and 20% rates would incorrectly give 15%. The denominator tells you how much each group contributes.
Keep intermediate precision and round the final result as instructed. When explaining a business insight, attach the scope: “Recorded paid-order amounts total 300 across four orders with known amounts; one paid order is missing an amount.” That is more defensible than claiming the file proves total paid revenue is exactly 300.
Rehearse finishing, not just solving
Official submission behavior: CodeSignal says to submit work before leaving a question so the code saves. It permits repeated submissions and grades the final submitted solution when you finish, or the last submitted solution if time expires. DAA submission rules
For preparation, rehearse a complete cycle: inspect an unfamiliar file, calculate an answer, verify it independently, and record the final result. Then solve one SQL question and check column names, ordering, null handling, and the submitted state. A successful local calculation is only one part of that cycle.
Use the documented 70-minute structure for a full practice session if you want a timed rehearsal, but do not infer equal weighting from the number of questions. Allocate time based on the tasks you see and your own accuracy. Leave room to revisit uncertain answers without turning every difficult item into an unlimited investigation.
Five questions for targeted DAA preparation
These are PracHub practice records across companies, not CodeSignal DAA questions or predictions. Attempt the relevant part before reading the solution; focus on the same data-quality and output checks used in the original exercise.
| PracHub question | Practice focus |
|---|---|
| Explain pandas and SQL basics | Filtering, aggregation, and checking duplicate values. |
| Illustrate SQL Join Results with Duplicate Keys | Predict result cardinality before trusting a joined total. |
| Calculate Regional Revenue and Identify Top Customers | Group revenue at the requested grain and handle ranking. |
| Compute Ride Metrics in SQL | Check null-aware averages and the population being counted. |
| Explain Joins and Write Coupon SQL | Define conversion denominators and preserve the intended cohort. |
Start with the CSV reconciliation until you can explain all four row counts. Then choose one Data Analyst practice question, solve it in your intended tool, and verify the result from the original records. Aim for a calculation you can trace and a final answer you have actually submitted.
Sources and Further Reading
- CodeSignal DAA structure — official question mix, timing, and workspace distinction; updated September 1, 2026.
- CodeSignal DAA rules and setup — external CSV tools, proctoring setup, and submission behavior; updated August 29, 2026.
- Certified assessment environments — official database environments; updated April 15, 2026.
- CodeSignal technical assessments — catalog includes a separately named AI-Assisted Data Analytics Assessment; checked September 8, 2026.
- Python CSV documentation — CSV parsing and file-opening behavior.
Comments (0)