Playwright Interview Questions for SDETs: Debugging Flaky Tests with Traces
Quick Overview
Prepare for Playwright SDET interviews with a reproducible debugging lab tested on Playwright 1.63.0. Use real trace observations to distinguish ambiguous locators, premature assertions, and shared server data. Compare targeted fixes, trace recording options, retry semantics, and the limits of browser isolation.
A useful answer to Playwright interview questions for SDETs starts with evidence: which action failed, what the browser showed, and which assumption the test had not verified. “Add a retry” is not a diagnosis. A trace should help you choose between a locator repair, a meaningful wait, a data-isolation change, and a product bug that the test correctly exposed.
This article uses official Playwright behaviour and original lab observations, labelled separately from preparation advice. It does not claim these exercises were asked by a particular employer, and no candidate report is used to establish API behaviour.
For the broader test-boundary discussion, see PracHub's frontend testing interview questions. Here, we will reproduce failures and inspect the evidence behind a specific repair.
What did the debugging lab actually prove?
Original experiment: we ran Playwright Test 1.63.0 with its installed Chromium 153.0.8010.12, one worker, zero retries, and tracing enabled. A local checkout page had two Save buttons in different named sections. Saving returned an HTTP success response before a delayed UI update changed the status from Saving to Saved.
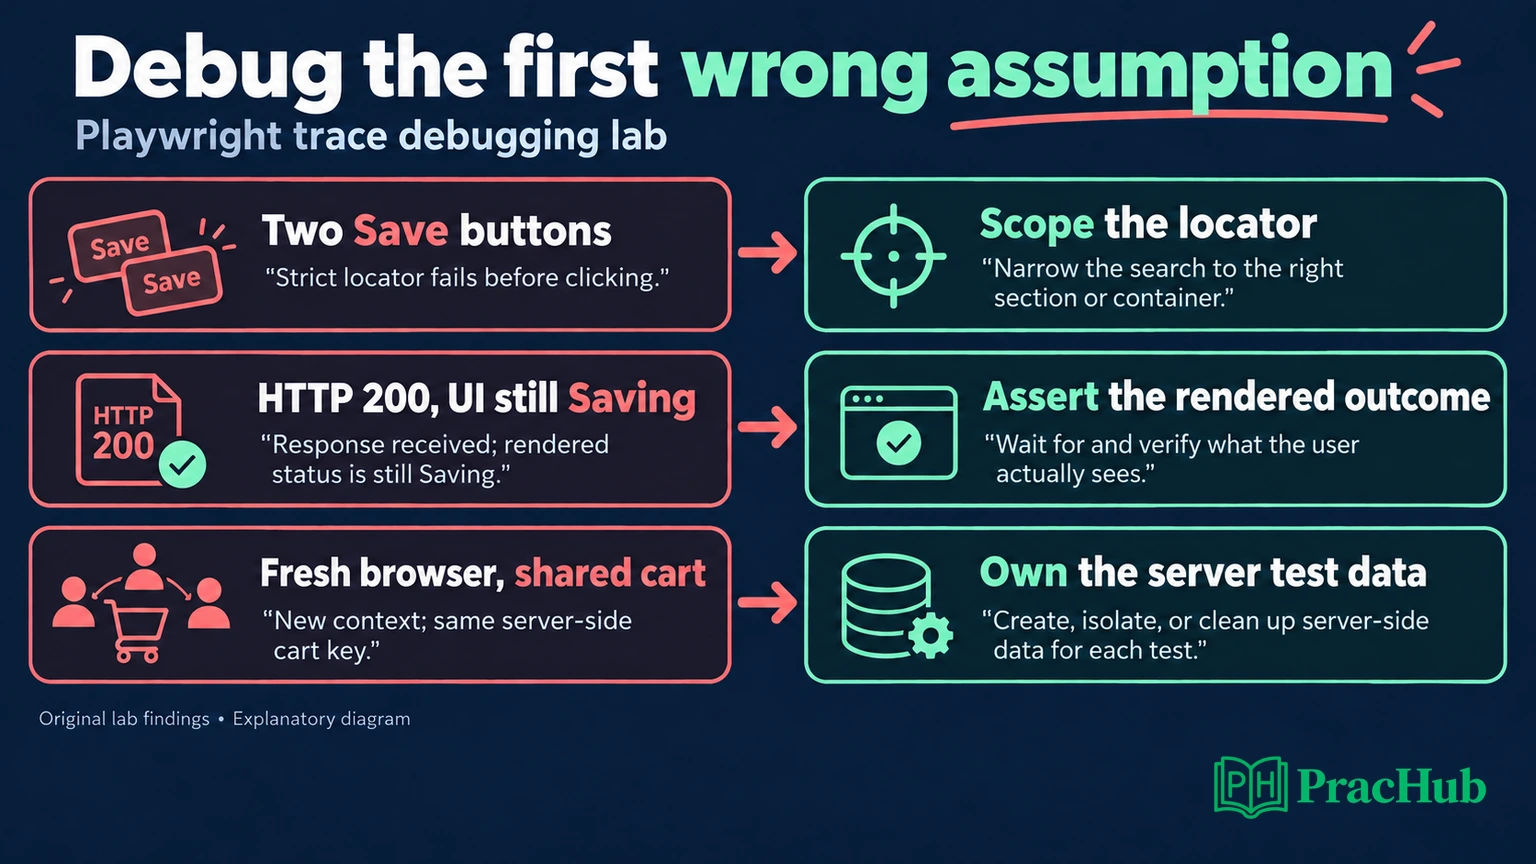
The main lab produced two deliberate failures and four passes. An unscoped locator failed because it matched both buttons. A scoped test failed because it compared a one-time text value before the UI update. The repaired assertion passed with 50, 600, and 1,200 millisecond rendering delays. A separate isolation check passed while demonstrating that two browser contexts could still address the same server cart.
These are controlled reproductions of failure mechanisms, not a measured production flake rate. The runner reported zero flaky tests because retries were disabled and the broken cases failed consistently. A timing-sensitive mistake can be made deterministic by choosing a slow condition that exposes it.
Can you reproduce the failure in one test file?
Create an empty directory with Node.js and npm available, install the pinned test package, and install its matching Chromium browser:
npm init -y
npm install --save-dev --save-exact @playwright/test@1.63.0
npx playwright install chromium
Save the following as repro.spec.js. It serves a synthetic page and API through request interception, so it needs no real checkout service. The 600-millisecond timer belongs to the simulated application; it deliberately separates response receipt from UI completion.
const { test, expect } = require('@playwright/test');

test('save reaches its visible result', async ({ page }) => {
  await page.route('http://lab.test/api/save', route =>
    route.fulfill({ json: { ok: true } }));
  await page.route('http://lab.test/', route => route.fulfill({
    contentType: 'text/html',
    body: `<section aria-label="Checkout">
      <button>Save</button><p role="status">Idle</p>
    </section><section aria-label="Newsletter">
      <button>Save</button></section>`
  }));
  await page.goto('http://lab.test/');
  await page.evaluate(() => {
    const box = document.querySelector('[aria-label="Checkout"]');
    box.querySelector('button').onclick = async () => {
      box.querySelector('p').textContent = 'Saving';
      await fetch('/api/save', { method: 'POST' });
      setTimeout(() => {
        box.querySelector('p').textContent = 'Saved';
      }, 600);
    };
  });
  const checkout = page.getByRole('region', { name: 'Checkout' });
  const response = page.waitForResponse(r =>
    r.url().endsWith('/api/save') && r.request().method() === 'POST');
  await checkout.getByRole('button', { name: 'Save', exact: true }).click();
  expect((await response).status()).toBe(200);
  expect(await checkout.getByRole('status').textContent()).toBe('Saved');
});
Run npx playwright test repro.spec.js --workers=1 --retries=0 --trace=on. The final assertion is intentionally broken: expect Saved, receive Saving. We also executed this self-contained version and verified the same failure, then verified that replacing its final assertion with the repair below passes.
The example checks a mocked UI contract. It does not establish that a real payment API persists data correctly. State that boundary when explaining what your test covers.
Why did auto-waiting not prevent the failure?
Official behaviour: before clicking, Playwright checks applicable actionability conditions, including visibility, stability, whether the element receives events, and whether it is enabled. Those checks concern the action target; they do not assert that a later business operation has completed. Playwright auto-waiting.
In this lab, the button was clickable and the click worked. The unsupported assumption was that an HTTP response meant the rendered status was already final. The response arrived before the DOM update.
The expression await status.textContent() reads a value. Passing that resulting string to expect(...).toBe(...) does not keep reading the page. Replace the final line with:
await expect(checkout.getByRole('status')).toHaveText('Saved');
Official behaviour: Playwright's asynchronous locator assertions retry their checks until the expected condition is met or the assertion timeout expires. They must be awaited. Playwright assertions.
Our diagnosis: use an assertion on the user-visible outcome because that is the contract this test intends to verify. Waiting longer for an unrelated event would leave the contract implicit.
An arbitrary sleep is a poor substitute. A short sleep can remain unreliable under slower conditions; a long sleep wastes time when the UI finishes quickly. Increasing a timeout is justified only when the allowed completion budget is wrong and you have evidence for changing it. It cannot repair an assertion that examines a stale string once.
How should you read the failing trace?
Open the generated trace.zip with npx playwright show-trace path/to/trace.zip. Start at the failed assertion and work backward toward the earliest mismatch between the test's assumptions and the observed state.
Official capabilities: Trace Viewer exposes recorded actions, snapshots, source locations, errors, console messages, and network activity. Timeline filtering can limit the events currently shown, so widen the selection when relevant evidence appears absent. Playwright Trace Viewer.
Observed in our local-server trace: the error expected Saved but received Saving. The selected snapshot showed the Checkout status as Saving. Console events included save:start and save:response. The network record contained a POST to /api/save with status 200. The text-read result was also Saving.
Together, these observations support a precise conclusion: the request reached a successful HTTP response, but the test read the intermediate UI state. They do not prove that the application's update would never run. The failed attempt ended before the delayed completion; the repaired runs establish that the lab page can reach Saved under the tested delays.
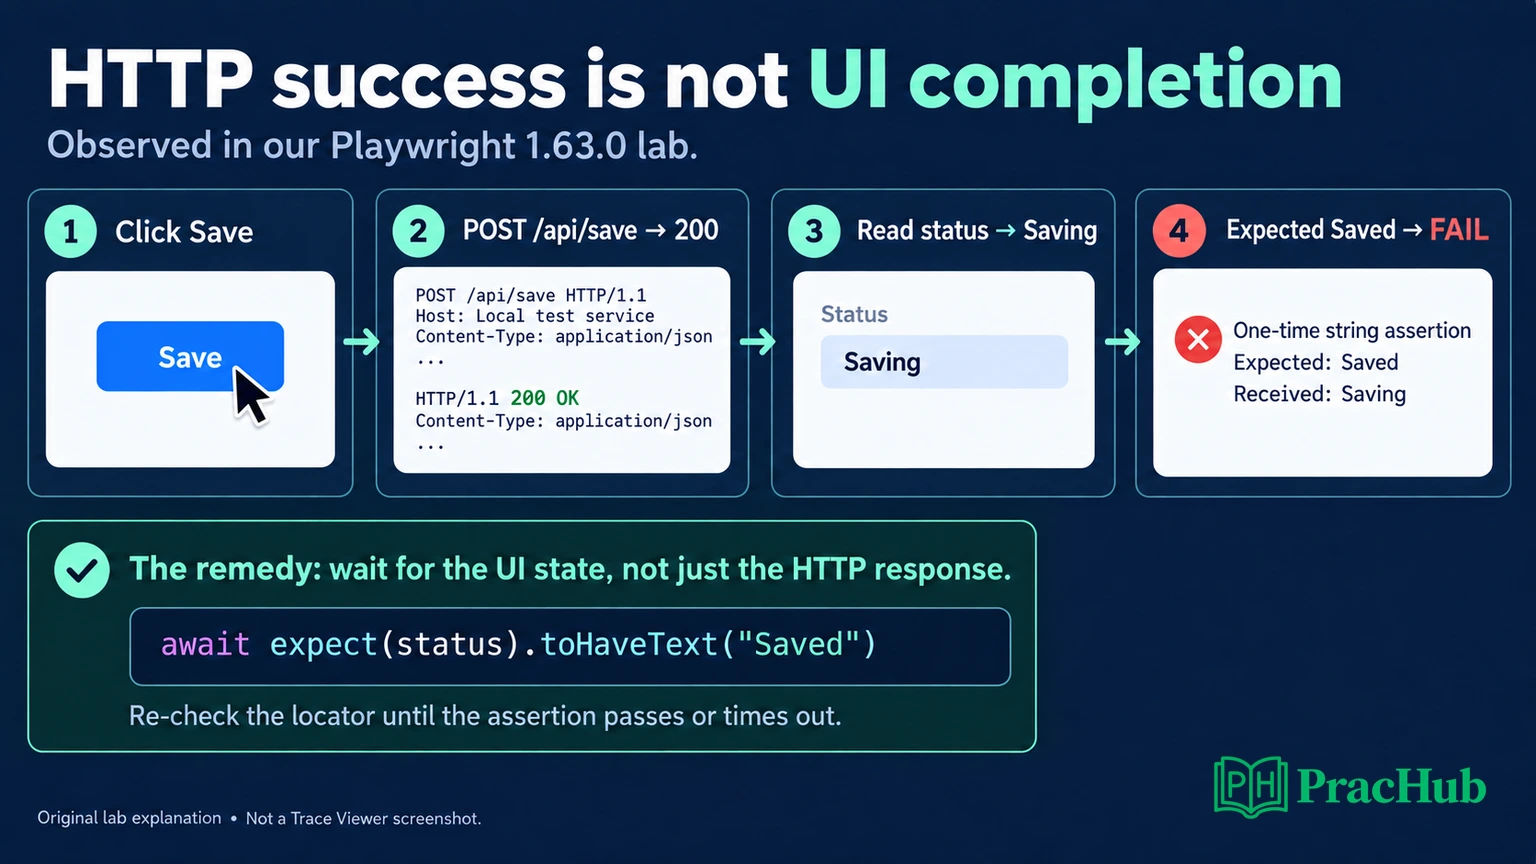
A strong spoken answer would be: “The click succeeded. I can see the 200 response and the intermediate status. The assertion uses a captured string, so it does not wait for the required display state. I'll assert against the locator and verify the repair under controlled rendering delays.”
Avoid narrating the trace as if it were a complete recording of every system component. A browser trace cannot, by itself, explain a database lock, an upstream queue, or a shared fixture created by another worker. Correlate the browser evidence with server request IDs and test-data ownership when the suspected cause crosses that boundary.
When is the locator itself the problem?
The lab's second Save button belongs to a Newsletter section. This locator is ambiguous:
await page.getByRole('button', { name: 'Save', exact: true }).click();
Original observation: it failed with a strict-mode violation identifying two matches. It did not click the wrong button. That distinction changes the diagnosis: the test lacked enough information to choose a target.
Scope the locator through the named Checkout region, as the reproduction does. The test then expresses which user task it is exercising rather than relying on the first element in DOM order.
Official behaviour: locators are strict for operations requiring one target. Methods such as first() can bypass the multiple-match error, but they can also select a different element when the page changes. Playwright locator guidance.
Our recommendation: explain why your selector is stable under a plausible refactor. A role and accessible name can express user-facing intent; a dedicated test ID can be appropriate where the interface lacks a useful semantic target. Neither is automatically correct without a clear ownership contract.
Do not use force: true to solve ambiguity or to make an obstructed control appear usable. First determine whether the target is wrong, an overlay is legitimate, or the application has an interaction defect. Forcing an action changes which checks protect the test; it does not establish the desired user behaviour.
Why can isolated contexts still share a failing cart?
Official behaviour: Playwright Test gives tests isolated browser contexts, separating browser state such as cookies and local storage. Playwright browser-context isolation.
Original observation: we set local storage in context A and read no corresponding value in context B. But after A incremented a server cart under the key shared, B read a count of one using that same key. Reading a different key returned zero.
The contexts were isolated correctly. The server-side identifier deliberately selected shared data. Recreating the browser cannot reset that resource.
For a real suite, propose a fixture that creates test-owned data, yields its identifier, and cleans it up afterward. Include a run identifier and a test-specific component so parallel workers and retried attempts do not accidentally claim the same resource. Do not rely on a short timestamp alone to avoid collisions.
Cleanup also needs failure handling: a test might crash before teardown completes. Explain whether the environment has expiring test data, a cleanup job, or an API that safely deletes only the resources owned by that run. Broadly resetting a shared database can disrupt other workers and create the very nondeterminism you are investigating.
| Evidence | Targeted repair | What still needs verification |
|---|---|---|
| Two matching Save buttons | Scope the intended region | Refactors preserve the semantic target |
| HTTP 200 while status is Saving | Retry the locator assertion | Completion meets the agreed time budget |
| Fresh context reads a shared cart | Allocate test-owned server data | Parallel runs and cleanup cannot collide |
Should traces run only on retries?
Official options: on-first-retry records the first retry, not the initial attempt. retain-on-failure records attempts and keeps failed-run traces. For a local investigation, --trace=on records every run. Trace recording options.
Choose according to the evidence you need. A first-retry trace can be useful for routine CI triage, but if the retry passes, it may not contain the failure you wanted to explain. With retries disabled, first-retry tracing has no retry attempt to record. Keep the original failure's evidence when diagnosing a transient issue.
Official retry semantics: Playwright distinguishes tests that pass initially, tests that fail then pass on retry, and tests that continue failing. A failed worker is discarded, so later attempts can run in a new worker and rerun setup. Playwright retries.
A passing retry is therefore another observation, not proof that the defect disappeared. Compare its setup, state, timing, and service responses with the failed attempt.
Also distinguish runner tracing from calling context.tracing.start() yourself. Official API limitation: browser-context tracing records browser operations and network activity but does not record test assertions; Playwright recommends configuration-based tracing for fuller test traces. Tracing API.
Practise explaining a repair, not reciting APIs
These verified PracHub questions exercise adjacent debugging and test-design skills. They are not presented as Playwright-specific or SDET-specific reported questions; their original company and role labels remain on the linked pages.
| PracHub question | Apply the trace-lab habit |
|---|---|
| Contrast UI vs backend testing; design UI-change test cases | Separate visible outcomes from persistence and service contracts. |
| Debug and Harden a Ticketing Backend API | Trace a failing invariant across the browser/server boundary. |
| Build a Jenkins CI for graphics tests | Preserve failure artifacts and explain retry policy. |
| Debug the Last-Element Random Allocation Case | Turn a nondeterministic symptom into a controlled counterexample. |
| Clarify and Implement Search Filters for a Library Table | Agree on loading, empty, and error states before asserting them. |
Rehearse one explanation with four parts: observed failure, unsupported assumption, targeted change, and evidence after the change. Then use PracHub's QA and SDET interview guide to connect that debugging result to test strategy and release confidence.
Comments (0)