Sample Ratio Mismatch Interview Questions: Diagnose Assignment, Logging, and Filtering Errors
Quick Overview
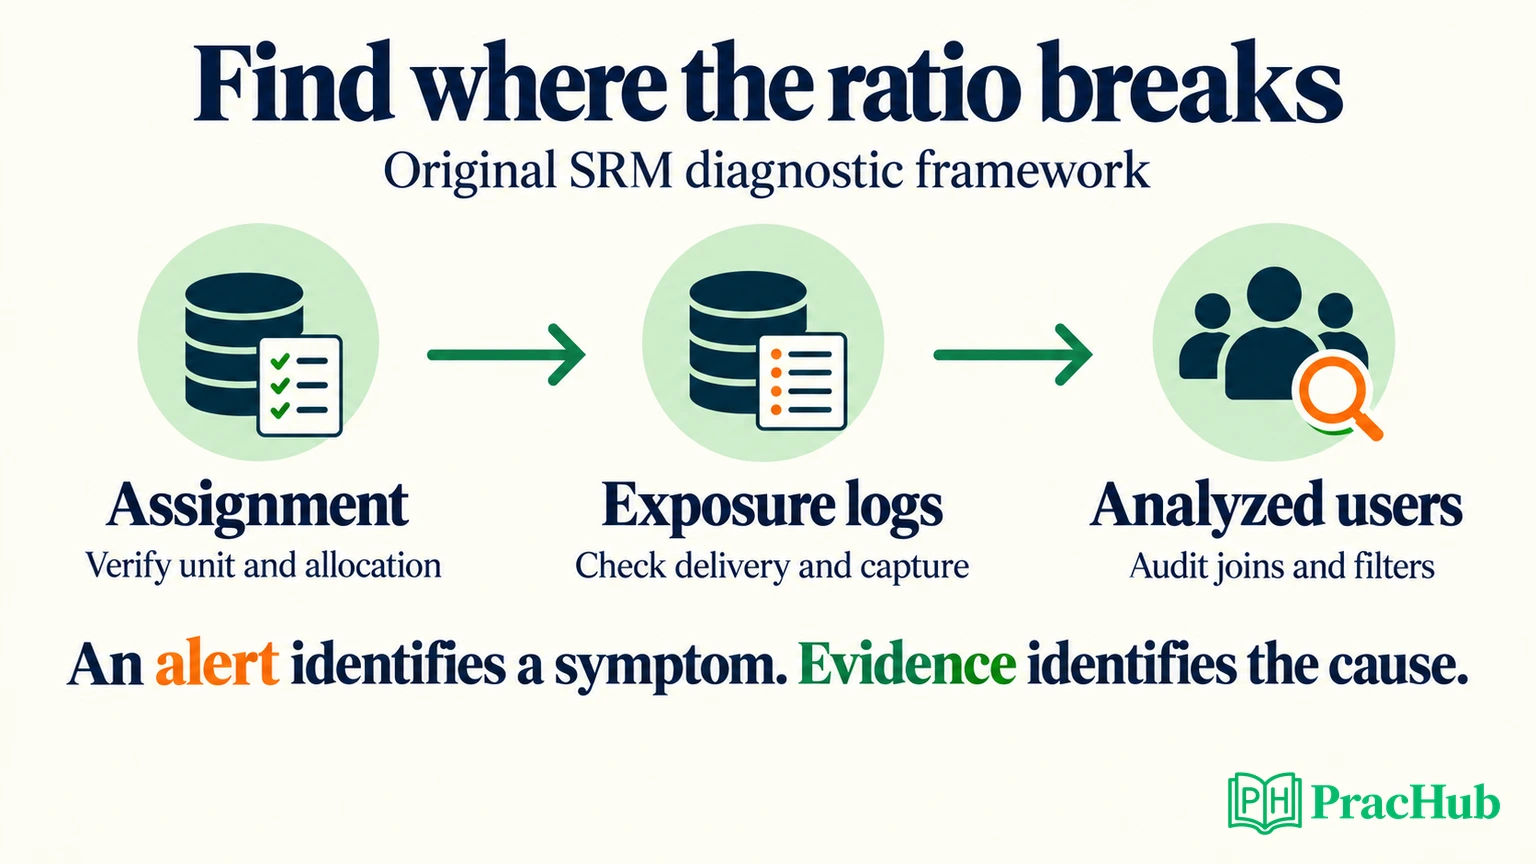
Diagnose sample ratio mismatch by tracing assignment, exposure logs, and analyzed users. Practice original chi-square, SQL join, filtering, and allocation-ramp cases before deciding whether to trust lift.
A sample ratio mismatch interview question asks you to decide whether the experiment's observed allocation is compatible with its intended allocation—and, if it is not, explain where the discrepancy entered the data. A useful answer connects counts to a mechanism. “Run a chi-square test” detects a symptom; it does not distinguish faulty assignment from missing logs or a biased analysis filter.
Start by naming the randomization unit, intended split, population, and time window. Then trace those units through assignment, exposure records, and the final analysis. PracHub's A/B testing platform design question provides practice connecting those stages before you investigate a particular failure.
Evidence boundary: Microsoft Research supplies the published diagnostic framework; SciPy supplies technical test documentation. Every numerical case and SQL example below is original practice material. The linked PracHub questions are preparation records, not predictions of any company's interview.
What does an SRM alert establish?
Published research: Microsoft describes SRM as a signal of possible experiment-quality problems and distinguishes causes across assignment, execution, log processing, and analysis. Its guidance separates detection from diagnosis. That distinction matters: an alert alone does not identify the defective component. Microsoft SRM diagnosis
In an interview, translate the alert into a precise statement: “These unit counts are unexpectedly far from the configured proportions under the stated randomization model. I would investigate before using this affected analysis for a launch decision.”
Avoid saying that every unequal count is SRM. Random allocation normally produces some imbalance. An intended 80/20 experiment should also produce unequal groups. Nor does a passing SRM check prove that outcomes are measured correctly: equal losses from both arms could leave the proportions unchanged.
Question 1: Which numbers belong in the test?
Suppose an experiment independently assigns eligible users 50/50. In this original calculation, the analysis contains 10,200 control users and 9,800 treatment users. The total is 20,000, so the expected count is 10,000 in each arm.
The Pearson statistic is the sum of (observed − expected)² / expected across arms. Here it is 200² / 10,000 + (−200)² / 10,000 = 8. With two categories and specified probabilities, the reference distribution has one degree of freedom; the approximate p-value is 0.00468.
At an illustrative, preselected alert threshold of 0.001, this example would not trigger. At 0.01, it would. Neither threshold is a universal interview rule. State the monitoring policy instead of choosing a cutoff after seeing the answer.
Technical documentation: SciPy's chisquare function compares observed frequencies with expected frequencies. Its documentation notes the matching-total requirement, small-count limitations, and degrees-of-freedom assumptions. SciPy chi-square documentation
If the intended split were 80/20, a total of 20,000 would imply expected counts of 16,000 and 4,000. Do not estimate the expected proportions from the same observed counts: doing so would erase the discrepancy you are testing. For sparse two-arm counts, an exact binomial test may be more appropriate than the large-sample approximation.
Confirm that the independent units really are users. Repeated events from one user are not additional independent assignments. Cluster allocation and changing probabilities require a test that respects that design, rather than blindly applying this fixed-probability example.
Question 2: Where did the ratio first diverge?
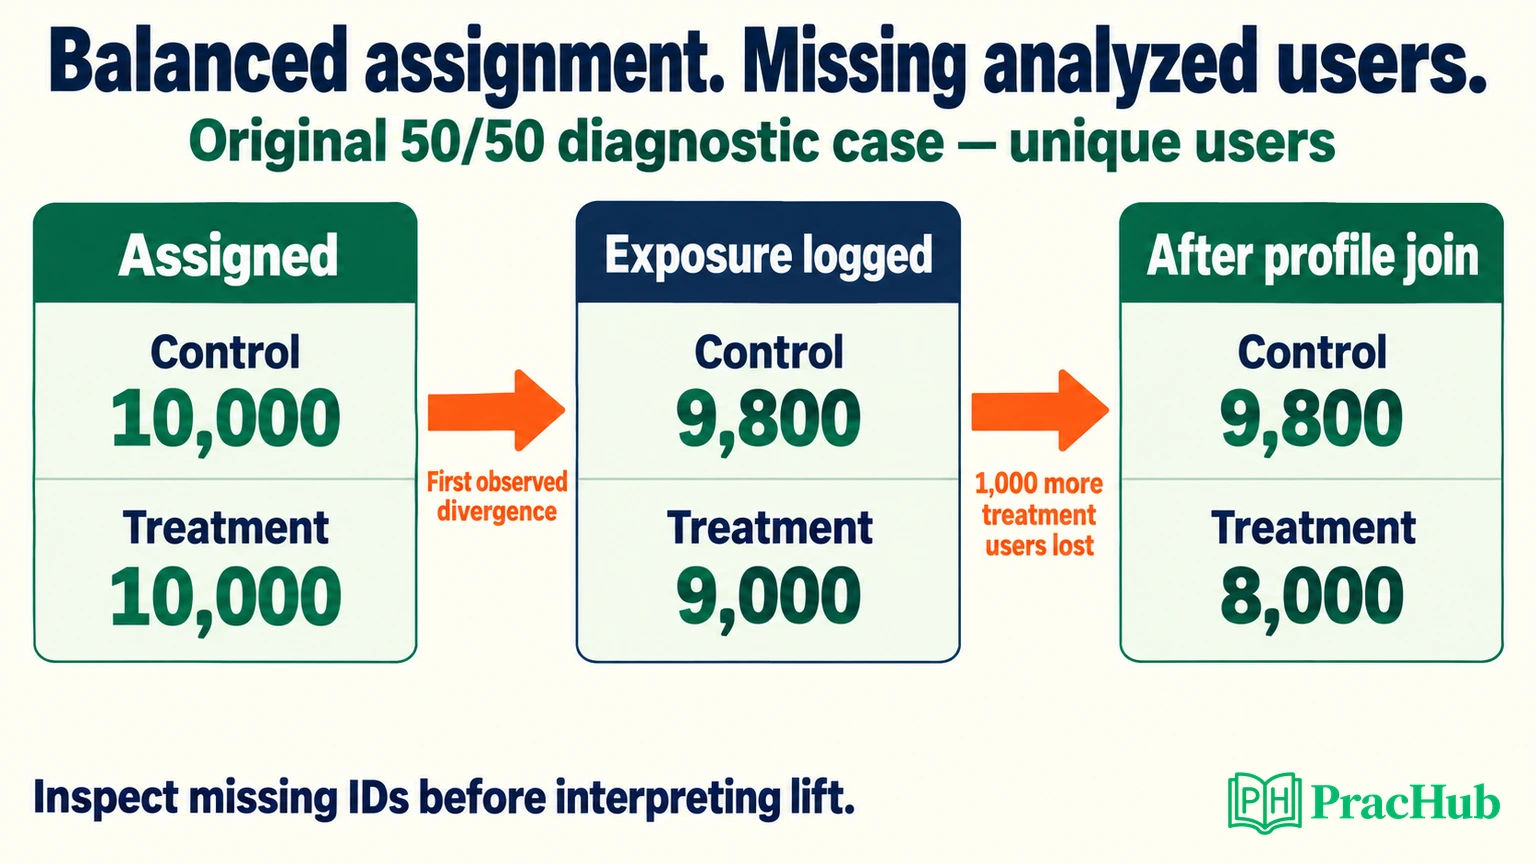
Consider this original diagnostic case. Allocation was fixed at 50/50, each user has one assignment, and the three rows refer to the same enrollment cohort after the same data-maturity cutoff. Exposure means reaching a common entry point defined identically in both arms.
| Data boundary | Unique users: control / treatment |
|---|---|
| Assignment ledger | 10,000 / 10,000 |
| Exposure event captured | 9,800 / 9,000 |
| After joining a profile table | 9,800 / 8,000 |
The assignment ledger is balanced, but the exposure records are not. That makes the transition into recorded exposure the first observed divergence. It does not prove telemetry loss: fewer treatment users might reach the entry point, events might fail to arrive, or the two implementations might record different conditions.
Calculate retention across each boundary. Control retains 98% of assigned users in exposure logs; treatment retains 90%. The profile join then retains all 9,800 logged control users but only 8,000 of 9,000 treatment users, approximately 88.9%. There are two transitions to explain, not one generic “logging issue.”
Ask for the missing user IDs at each transition. Compare their assignment timestamps, client versions, eligibility flags, and ingestion status. A server record confirming delivery with no matching client event supports a different hypothesis from a server record showing that delivery never occurred.
Validate the balanced ledger too. Confirm that it covers failed requests and uses the authoritative assignment service rather than a downstream copy. Two tables generated by the same broken pipeline are not independent corroboration.
Question 3: How would you separate assignment bugs from logging loss?
For assignment, inspect the configured allocation, configuration versions, bucketing input, and identity lifecycle. A user ID that changes after login can violate a supposedly stable assignment. A cached response might serve one variant while the assignment record says another. Check cross-arm membership rather than trusting a total that happens to look balanced.
For logging, follow a known assignment through delivery, event creation, ingestion, deduplication, and aggregation. Compare event timestamps with arrival timestamps. A recent treatment client might batch events longer, producing a temporary discrepancy in an immature window. A completed watermark and a later recomputation help distinguish delay from persistent loss.
For an original follow-up, suppose only Android version 42 shows exposure loss, beginning at its release hour. That observation prioritizes a client-specific investigation. It does not prove causation. Inspect the event schema change, reproduce the path, and compare server delivery with client capture for that version.
Use segments to localize a mechanism, not to search until one p-value looks alarming. Repeated time checks and many segment tests create additional false-alert opportunities. Follow the platform's monitoring policy, record how the segment was selected, and corroborate the hypothesis with operational evidence.
Question 4: Can a LEFT JOIN still discard users?
Yes. This original SQL trap starts from assigned users but puts a condition on the right-hand table in WHERE:
SELECT a.arm, COUNT(*) AS users
FROM assignments AS a
LEFT JOIN profiles AS p
  ON a.user_id = p.user_id
WHERE p.is_eligible = 1
GROUP BY a.arm;
An unmatched profile has a null eligibility value, so the predicate removes that row. The query no longer preserves every assigned user. If profile availability differs by arm, the apparent population changes asymmetrically.
For a diagnostic view, retain the assignment population and expose missingness:
SELECT
  a.arm,
  COUNT(*) AS assigned,
  SUM(CASE
    WHEN p.user_id IS NULL
    THEN 1 ELSE 0
  END) AS missing_profile,
  SUM(CASE
    WHEN p.is_eligible = 1
    THEN 1 ELSE 0
  END) AS eligible_profile
FROM assignments AS a
LEFT JOIN profiles AS p
  ON a.user_id = p.user_id
GROUP BY a.arm;
These queries assume one row per user in both tables. In a tiny fixture with four assigned users per arm, four eligible control profiles, and two eligible treatment profiles, the first query returns 4 versus 2. The diagnostic query retains 4 versus 4 and reports missing-profile counts of 0 versus 2.
This is a query-semantics demonstration, not enough data for a large-sample SRM conclusion. Before using the query on production data, check key uniqueness. A one-to-many join can inflate counts; COUNT(DISTINCT user_id) may conceal duplication while outcome sums remain inflated. Establish the correct grain before joining.
Do not repair the analysis merely by removing a legitimate eligibility requirement. Recover eligibility as defined at the appropriate pre-treatment time, inspect missing values, and distinguish a corrected diagnostic query from a valid causal analysis population.
Question 5: What if treatment genuinely changes who qualifies?
Suppose a new recommendation interface increases clicks. Restricting analysis to “users who clicked” can admit different kinds of users in treatment and control because clicking occurs after treatment. The resulting imbalance is not necessarily a randomizer defect; the filter itself depends on an outcome the experiment can change.
Event counts pose a related trap. If 10,000 users are assigned to each arm but treatment generates more sessions, unequal session totals may be the treatment effect. Do not test session counts against a user-allocation ratio and call that an assignment failure.
Published guidance: Microsoft's discussion of triggered analysis calls for a condition that captures users affected, or who would have been affected, by the change. It recommends checking both the triggered population for SRM and the complement for unexpected treatment effects. These are diagnostic safeguards, not permission to condition on arbitrary post-treatment behavior. Microsoft triggered-analysis guidance
For interview practice, propose a common opportunity-to-expose condition recorded symmetrically in both arms, and explain why treatment cannot selectively suppress it. If that argument fails, return to an assignment-based analysis where outcomes are observed reliably. Simply renaming a click filter “exposure” does not solve selection bias.
Question 6: Can a healthy ramp look like SRM?
Yes, if you test against the wrong allocation history. Imagine two disjoint cohorts of newly assigned users: 10,000 enrolled under a 90/10 control/treatment split, followed by 10,000 under 50/50. Expected combined counts are 14,000 control and 6,000 treatment, not 10,000 each.
This original example assumes sticky assignments and no users counted twice across cohorts. Retrieve the actual configuration history and test within the appropriate allocation epochs. Do not average percentages without weighting by enrollment, or ignore the changed variance structure when combining different assignment probabilities.
A second trap is cancellation: opposite skews in two time periods can produce a balanced total. Inspect meaningful time boundaries and pre-treatment segments even when the aggregate check passes. Use those checks to understand the design and incident, with appropriate monitoring controls, rather than declaring every segment discrepancy a confirmed bug.
Question 7: Would you trust the reported lift?
Withhold the launch conclusion from the affected analysis while diagnosing an unresolved mismatch. That does not automatically mean every experiment must stop immediately. Operational harm, telemetry risk, and the ability to preserve evidence determine whether to pause exposure, roll back, or continue controlled investigation.
If assignment was correct and complete raw records can reconstruct a flawed join, rerun the corrected pipeline and verify the repaired population and outcomes. If treatment selectively prevented outcome capture and the missing outcomes cannot be recovered, a fresh experiment after the fix may be necessary.
Do not downsample the larger arm until the counts match. Equalizing counts does not recover systematically missing users or remove selection bias. Reweighting likewise needs defensible assumptions about inclusion and missingness; a balanced-looking table is not sufficient evidence.
A concise answer to the count-lineage case is: “Assignment is balanced, but exposure capture and the profile join both lose more treatment users. I would audit missing IDs at each boundary, validate the common exposure condition, and reconstruct the intended population where possible. I would not interpret the current lift until those mechanisms and outcome completeness are resolved.”
Five PracHub questions to practice the diagnosis
Use these records to rehearse the checks, calculations, and decision explanation. Their company labels do not establish a shared interview format.
| PracHub question | Practice focus |
|---|---|
| Interpret A/B results for video-pin increase | Evaluate allocation validity before a launch recommendation. |
| Analyze an A/B test over last 7 days | Compare overall and time-specific diagnostics. |
| Design A/B testing platform | Connect assignment, exposure logging, and monitoring. |
| Investigate Traffic Distribution Impact on Retention Decrease | Separate composition and instrumentation hypotheses. |
| Walk Through an Experiment From Design to Decision | Explain the validity gate before discussing effect size. |
Start with the video-pin experiment question. State the unit and expected allocation, calculate the discrepancy, then name the next evidence you would request before trusting the treatment effect.
Sources and Further Reading
- Microsoft Research: Diagnosing Sample Ratio Mismatch in A/B Testing — published diagnostic taxonomy and investigation framework.
- SciPy: scipy.stats.chisquare — goodness-of-fit API, expected counts, and test assumptions.
- Microsoft Research: Patterns of Trustworthy Experimentation, Post-Experiment Stage — triggered analysis and complement checks.
Sources checked September 8, 2026. Monitoring thresholds, allocation designs, and platform implementations vary; confirm the assumptions provided in your interview prompt.
Comments (0)