The Data Science Case Study Interview: A 4-Step Framework With Worked Examples
Quick Overview
The data science case study interview tests structured decomposition, metric judgment, and business quantification rather than trivia. This guide gives a 4-step answer framework (clarify the goal, define the metric and guardrails, design the analysis, decide and quantify), then walks three real cases from Yahoo, Capital One, and PayPal end to end, closing with the scoring rubric and the failure modes that reject candidates.
Somewhere in the middle of a data scientist onsite, the interviewer puts the SQL questions away and says: "Our checkout team wants to launch a cashback program. Should we?" No dataset, no starter code, no single right answer. That is the data science case study interview, and it is where technically strong candidates most often stall, because it grades something practice problems never taught you: turning a vague business situation into a decision with a number attached. This guide gives you a 4-step framework, then walks three real cases end to end — a metric-drop diagnosis, a profitability decision, and an experiment design — using questions actually asked at Yahoo, Capital One, and PayPal.
Key Takeaways
- Case studies test structured decomposition under ambiguity, metric judgment, and business quantification. They do not test trivia, and reciting definitions scores zero.
- Use the same 4-step skeleton every time: clarify the goal, define the primary metric and guardrails, design the analysis or experiment, then decide and quantify the trade-off.
- The single strongest pass signal is ending with a recommendation that has a number behind it ("at forecast volume, this launch clears its fixed costs only while cannibalization stays under 67%"), not a survey of considerations.
- Three failure modes cause most rejections: jumping to a model before defining the problem, proposing metrics that can't disprove your hypothesis, and ignoring guardrails until the interviewer forces them.
- Percentage margins and dollar profits diverge constantly in profitability cases. Interviewers plant that trap deliberately; walk through the unit economics in dollars first.
What the case round actually screens for
Asked at Capital One — Explain App Growth Strategy and Key Performance Metrics In an onsite analytics round, you pick a consumer app you like, explain it to a manager who has never used it, and lay out how you would grow it: how it makes money, which metrics you would move, what you would build next, and how you would weigh the ROI of each idea against the others.
Notice what this question does not ask for. There is not a formula anywhere in it. The interviewer already knows you can compute things; the phone screen established that. What they cannot yet tell is whether you can operate when nobody hands you the problem statement.
Every case, whatever its surface, is scoring four things:
Structured decomposition. Can you break "grow the app" into monetization, acquisition, engagement, and retention, and then say which one you would attack first and why? Candidates who fail this round mostly fail here, in the first ninety seconds, by starting to answer before they have structured anything.
Metric judgment. Given a goal, can you pick the one metric that measures it, defend that choice against alternatives, and name what the metric misses? "We'd track engagement" is a non-answer. "Weekly transacting users, because monthly hides churn and daily overweights power users" is an answer.
Analysis and experiment design. Once the metric exists, how would you actually learn something? This is where your training matters, but as a tool you reach for at step three, not a script you launch into at step zero.
Business quantification. Interviewers at Capital One, PayPal, and OneMain in particular push toward dollars. A candidate who can say "that's roughly a $2,000-a-month decision, which doesn't justify a quarter of engineering time" reads as someone who can be put in front of a product team.
The rest of this article is one skeleton applied to three very different-looking cases. That's deliberate. The framework's value is that it survives contact with any prompt.
The 4-step framework
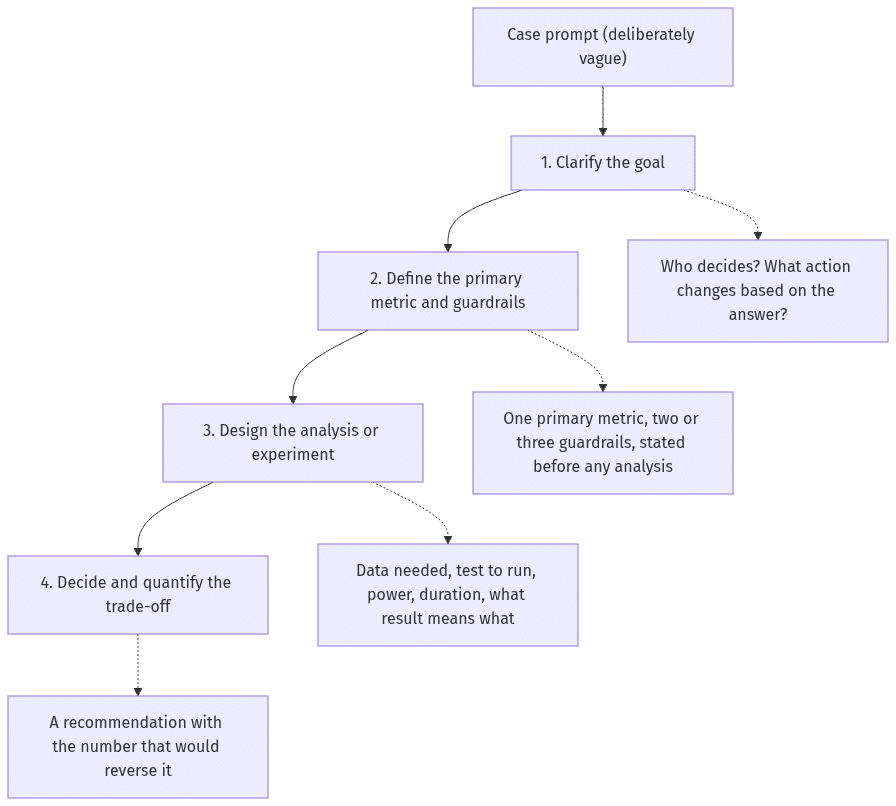
Step 1 — Clarify the goal. Spend two or three minutes here, out loud. Who is asking, and what will they do differently depending on your answer? "Should we launch cashback" means something different to a growth PM (acquisition) than to a finance partner (margin). Ask two or three sharp questions, state your assumptions explicitly, and get the interviewer's nod before moving on. This is also where you scope: "I'll focus on the US checkout flow and treat fraud as a guardrail rather than a primary concern — fair?"
Step 2 — Define the metric and guardrails. Commit to one primary metric and defend it. Then name two or three guardrails: things that must not degrade even if the primary metric improves. Doing this before any analysis is what separates a data scientist from an analyst with opinions, because it makes your eventual recommendation falsifiable. If you find yourself unable to state what result would make you say "don't launch," your metric is decoration.
Step 3 — Design the analysis or experiment. Only now do you reach for technique. Sometimes the right tool is an A/B test; sometimes it's a break-even calculation on a napkin; sometimes it's segmenting a dashboard. The senior move is matching the tool's cost to the decision's size, not deploying the fanciest tool you know.
Step 4 — Decide and quantify. End with a recommendation and the number that supports it, plus the number that would flip it. "Launch: at forecast volume it nets roughly $2K a month, and I'd kill it if measured cannibalization comes in above two-thirds." Interviewers remember candidates who land the plane. Most candidates circle the airport listing considerations until time runs out.
Now let's run it three times.
Worked case 1: diagnosing a sudden metric drop
Asked at Yahoo — Diagnose a 10% DAU drop Yahoo Mail's daily active users fell 10% against the prior week's baseline. The drop lands on a Monday that happens to be a US holiday, which may or may not matter. You're asked for an end-to-end plan: confirm the drop is real, isolate where it's coming from, and recommend what to do about it.
This is the most common case archetype in data science interviews, and it has a canonical shape: verify, then segment, then attribute, then decide. The trap is skipping verification. A meaningful fraction of "10% DAU drops" in real companies turn out to be a broken logging pipeline or a bot-filter change, and interviewers know it. A candidate who immediately hypothesizes about user behavior, before asking whether the number is real, has told the interviewer they've never been paged for one of these.
Step 1, clarify: What exactly counts as a DAU here — any app open, or an authenticated action? Did the definition, the bot filtering, or the identity resolution change recently? Is the 10% against a 7-day baseline or the same day last week? The Yahoo prompt hands you a specific gift: the drop day is a US holiday. Don't spend it yet; log it as a hypothesis.
Step 2, metric and guardrails: The primary metric is given (DAU), so your job is to interrogate it. State the comparison you trust: same weekday, prior weeks, and same holiday last year. A Labor Day Monday compared to ordinary Mondays should look different; the year-over-year holiday comparison is the one that tells you whether this drop is abnormal.
Step 3, the diagnosis tree. Segment before you theorize, because the shape of the drop tells you the cause category:
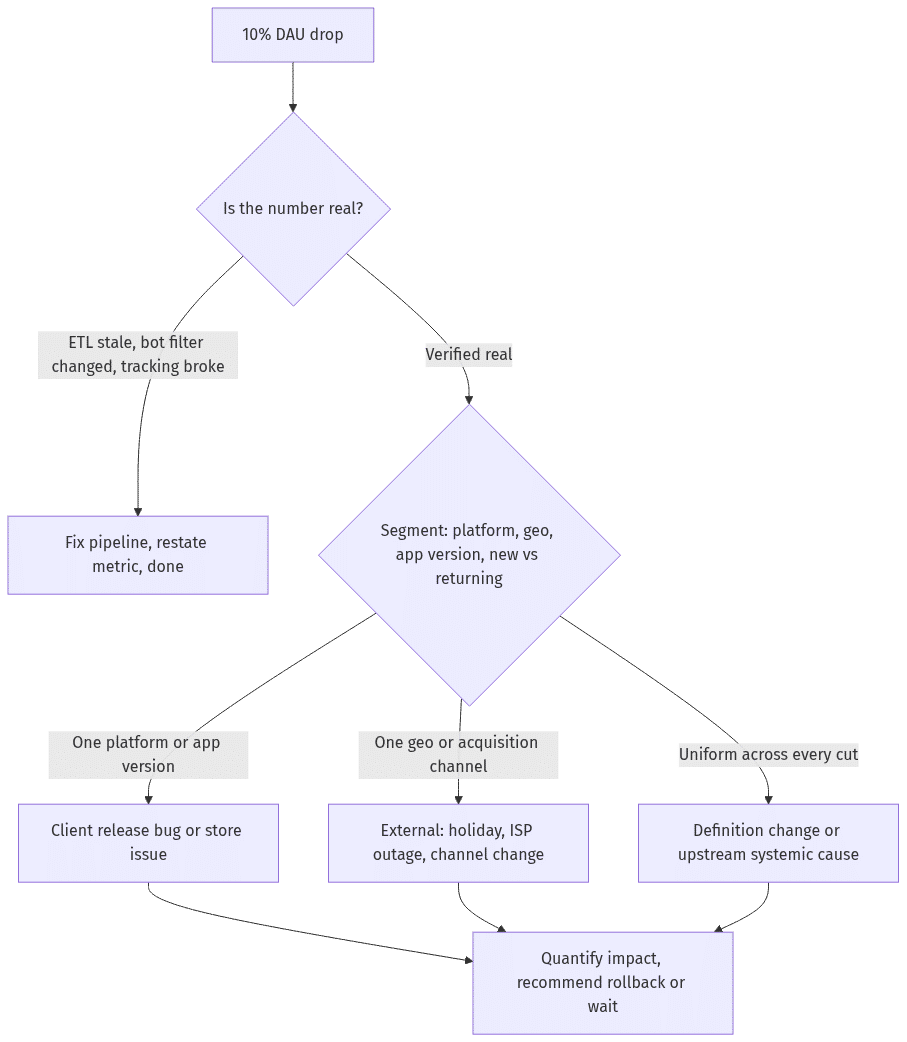
A drop concentrated in one app version released two days ago is a rollback conversation. A drop concentrated in US geos on Labor Day, matching last year's holiday dip, is a "do nothing, add a holiday annotation" conversation. A perfectly uniform drop across every segment is almost never organic user behavior; real behavioral changes are lumpy. Uniform almost always means measurement — or something upstream of every user at once, like an auth outage.
Step 4, decide: Quantify before recommending. If US traffic is 60% of DAU and the year-over-year Labor Day dip was around 15% domestically, that alone explains roughly a 9-point global drop — which would make this a non-incident. Say that arithmetic out loud. Then give the residual-risk plan: "I'd expect recovery Tuesday; if we're still down more than 3% Wednesday, we escalate and I start on the release-bug branch."
The follow-up probe you should expect: "Your segmentation shows nothing. Now what?" The strong answer goes to slower-moving causes: a competitor launch, an OS-level notification permission change, seasonality in a cohort mix. The weak answer repeats the segmentation with more dimensions.
Worked case 2: the profitability decision
Asked at Capital One — Should Company Launch Vegan Burger Based on Profit Analysis? A restaurant brand sells a standard burger and is deciding whether to add a vegan one. You get revenue and cost figures, and you're asked to work the unit economics, figure out how much the vegan burger needs to sell to justify itself, and end with a defensible go or no-go. The interviewer is explicitly watching whether you keep unit margin and realized margin straight.
Capital One's Power Day is famous for exactly this genre — a mini consulting case with real arithmetic — and their Power Day interview guide covers the full loop structure. Here, let's model the strong answer with illustrative numbers. (In the real interview, the numbers are given; the reasoning below is what transfers.)
Step 1, clarify: The decision-maker is presumably the product owner, and the action is a launch. Key clarifying question, and the one that reframes the whole case: does a vegan burger sale replace a beef burger sale, or add a new customer? That's cannibalization, and it's the hinge everything else turns on. Also ask about fixed costs of adding the line: a second ingredient stream, menu complexity, waste.
Step 2, metric: Primary metric is incremental contribution dollars per month, not margin percentage. Guardrails: total kitchen throughput (a slow-to-make item can tax the whole line) and beef-burger customer satisfaction. Flag the percentage-margin trap now, before the math, so the interviewer sees you saw it coming.
Step 3, the model. Suppose:
| Item | Price | Variable cost | Contribution / unit | Margin % |
|---|---|---|---|---|
| Beef burger | $10 | $4 | $6 | 60% |
| Vegan burger | $12 | $7 | $5 | 41.7% |
Here is the trap in action: the vegan burger has a lower percentage margin but still contributes $5 of real money per unit. A candidate who says "don't launch, the margin is worse" just failed. Whether launch is profitable depends entirely on where the vegan sales come from.
Let c be the cannibalization rate: the fraction of vegan sales that would otherwise have been beef sales. Each vegan unit sold changes monthly contribution by:
- incremental sale, probability (1 − c): +$5
- cannibalized sale, probability c: +$5 vegan gained − $6 beef lost = −$1
Expected contribution change per vegan unit = 5(1 − c) − 1·c = 5 − 6c.
Set it to zero: break-even at c = 5/6 ≈ 83% — at the unit level, before fixed costs. That is a genuinely useful number, and it's the kind interviewers hope you produce: each vegan unit adds contribution unless more than about 83% of vegan buyers are converted beef buyers. Intuition check — because the two contributions are close ($5 vs $6), a swap costs only $1 while a new sale gains $5, so cannibalization has to be extreme before the per-unit math turns negative.
Now layer in fixed costs, which move the real bar. Say adding the line costs $2,000/month (extra prep station, waste on a second protein). The launch makes money only while units × (5 − 6c) > 2,000, and at a forecast of 2,000 vegan units/month that tightens the break-even from 83% to c < 2/3 ≈ 66.7%. Check a middle scenario: at c = 50%, contribution change = 2,000 × (5 − 3) − 2,000 = 4,000 − 2,000 = +$2,000/month. Positive, but thin — which is itself information.
Step 4, decide: "Launch, conditionally. The unit economics survive anything up to 83% cannibalization, but with fixed costs in, the forecast volume only clears break-even while cannibalization stays under two-thirds — and a same-menu substitute could plausibly run that high. So I'd validate the two load-bearing assumptions cheaply first: run the item in a handful of stores for a month and measure cannibalization directly (compare beef volume in test vs control stores), and pressure-test the $2,000 fixed-cost estimate. Roll out only if the measured pair clears units × (5 − 6c) > 2,000 with room to spare; at forecast volume that means cannibalization well below 66.7% — at a measured 60%, for instance, the launch nets just $800 a month." A recommendation, a validation plan, and the exact condition that would reverse the call. Notice the answer keeps two numbers separate — the 83% unit-level break-even and the 66.7% fixed-cost-adjusted one at forecast volume — because collapsing them is exactly the unit-versus-realized confusion the question says the interviewer is watching for.
Worked case 3: designing the experiment
Asked at PayPal — Design and Analyze A/B Test for Cashback Program PayPal is considering checkout cashback in the 1–5% range and wants to know whether it improves business outcomes at acceptable cost. You're asked for the full experimental loop: hypothesis and success criteria, population and randomization, sample size and duration, and how you'd analyze and act on the results.
Experiment-design cases reward the same skeleton, but step 3 expands. If A/B testing methodology itself is your gap, work through the complete A/B testing framework for data scientists first; here I'll focus on what's case-specific.
Step 1, clarify: What does "improves business outcomes" mean to the sponsor? Cashback is a paid incentive, so the honest goal is incremental profit, not incremental usage. Also scope the arms: 1–5% is a range, so is this one treatment or a dose-response test? Proposing a control plus 1% and 3% arms (skipping 5% initially to cap cost exposure) is a reasonable scoping move to say out loud.
Step 2, metric and guardrails. The naive primary metric is checkout conversion. The better one is net incremental revenue per assigned user: transaction margin gained minus cashback paid. A cashback program can lift conversion and still lose money on every marginal transaction. Guardrails: refund rate (cashback invites buy-refund-keep-the-cashback abuse), fraud flags, and average margin per transaction. Name a long-term concern too: cashback attracts deal-seekers, so short-window results may overstate durable impact — worth a small long-running holdout.
Step 3, design. Randomize at the user level, not the session, or the same person sees inconsistent offers and you contaminate both arms. Assign at login or first checkout eligibility, and pre-register the analysis population.
That assignment choice creates a dilution problem: many assigned users never reach checkout, so intent-to-treat effects shrink toward zero and your sample-size math must account for it — dilution and its effect on power covers the mechanics. Rough power math you can do at the whiteboard, as deliberate shorthand: for a per-checkout conversion baseline p = 60% and a minimum detectable effect of 1 percentage point, the rule of thumb n ≈ 16·p(1−p)/δ² gives 16 × 0.24 / 0.0001 = 38,400 users per arm at 80% power. Then say the two caveats out loud. On the diluted per-assigned-user baseline — the population you actually randomized — that n grows several-fold. And the shorthand is a proportion test, while the primary metric you just declared, net incremental revenue per user, is continuous and needs a variance estimate in place of p(1−p). Run at least two full weeks to cover weekly cycles, longer if payment behavior has payday periodicity.
Analysis plan, stated up front: primary test on net incremental revenue per user, guardrail metrics checked at pre-set thresholds, and no peeking-driven early stops — repeatedly testing as data accrues and stopping on the first significant result is p-hacking, and interviewers increasingly probe for whether you'll name it unprompted.
Step 4, decide. Give the decision rule before seeing data: "Ship 1% if net incremental revenue per user is positive and refund-rate guardrail holds; escalate to the 3% arm's economics only if 1% is positive but conversion lift looks dose-responsive." Then name the trade-off you'd own: conversion up, margin per transaction down is the expected shape here, and the metric trade-off framework is how you argue which side wins.
When the case is a modeling decision, not an experiment
Asked at Amazon — Choose Between Fine-Tuning and RAG for Client Chatbot You're building a chatbot that must answer from a client's proprietary documents. The case: choose between fine-tuning a model and retrieval-augmented generation, comparing cost, data requirements, latency, maintainability, and risk — then go a level deeper into which fine-tuning approach you'd use if you had to.
Modeling-scoping cases look technical, but they're graded on the same rubric. The failure mode is answering like it's a knowledge question ("RAG retrieves documents at inference time, fine-tuning updates weights...") instead of a decision. Run the skeleton:
Clarify the goal: how often do the client's documents change? That single question usually decides the case — weekly-changing content makes fine-tuning a treadmill, since every content update means retraining, while RAG picks up new documents at index time. Define the metric: answer accuracy on a held-out set of client questions, with hallucination rate and per-query cost as guardrails. Design the analysis: build the RAG baseline first because it's cheap, measure, and only reach for fine-tuning if the measured failures are style/format failures (which tuning fixes) rather than knowledge-retrieval failures (which it doesn't). Decide: RAG as default for freshness and auditability, LoRA-style adapter tuning added only if the eval shows tone or format gaps, with the cost delta stated.
The point isn't the specific answer. It's that "which technique" questions become case studies the moment you attach a client, a budget, and a maintenance burden — and interviewers who ask them want the decision process, not the glossary.
The widest version of this genre is the full business-strategy case. In Optimize Credit-Card Strategy: Pricing, Limits, and Target Segments, asked at OneMain Financial, you're handed per-segment cost, revenue, and risk inputs and asked for a go-to-market strategy across pricing, credit limits, and segments — with the explicit instruction to optimize risk-adjusted profit, not gross revenue, under regulatory and fairness constraints. It's the vegan-burger case with four more dimensions, and the same discipline wins: define the objective function out loud, name the constraints as guardrails, and end with a portfolio recommendation plus the sensitivity ("this flips if segment-B default rates run 2 points above estimate").
How interviewers score you — and what fails you
Most companies grade case rounds on a rubric that looks remarkably similar across employers. Here's the archetype-by-archetype version, distilled from the cases above:
| Case archetype | What it primarily tests | Pass signal | Instant-fail signal |
|---|---|---|---|
| Metric-drop diagnosis (Yahoo DAU) | Systematic isolation under time pressure | Verifies data before theorizing; segments before attributing | Jumps straight to a favorite hypothesis |
| Profitability / pricing (vegan burger, OneMain) | Unit economics and quantified judgment | Break-even number plus what would flip the call | Confuses margin % with contribution $ |
| Experiment design (PayPal, Capital One) | Metric selection, power, guardrails | Decision rule stated before data; names dilution and peeking | Primary metric that can't lose money and still "win" |
| Modeling scoping (Amazon RAG) | Matching technique to constraints | Cheapest-first plan with an eval to justify escalation | Recites technique definitions with no decision |
Two things generalize across every row. First, interviewers score the shape of the answer heavily in the opening minutes — clarifying questions and an announced structure buy you more points than any individual insight later. Second, follow-up probes are where offers are decided. The initial answer gets you to "competent"; handling "your segmentation shows nothing, now what?" or "what if cannibalization is 90%?" without scrambling is what gets you to "hire."
One data-quality theme recurs in probes across all archetypes: whether your analysis population actually represents the decision population. If your cashback test only measures users who reached checkout, or your DAU diagnosis only examines users who kept logging in, you've conditioned on the outcome — the same selection bias family of errors, with survivorship bias as its most interview-popular member. Naming the bias and the fix (intent-to-treat analysis, cohort-based denominators) is a reliable senior signal.
Rejections in this round cluster tightly around five failure modes:
Jumping to a model. The candidate hears "should we launch cashback" and starts describing an uplift model. Technique-first answers signal a person who will burn two sprints building something nobody asked for. The fix is mechanical: do not say any method name until step 3.
Unfalsifiable metrics. "We'd look at engagement and see if it improves" — improves by how much, measured how, and what result kills the idea? If no outcome would change your recommendation, you haven't proposed a metric, you've proposed a vibe.
Ignoring guardrails. Every incentive program has an abuse vector, every conversion win has a margin cost, every growth push has a retention shadow. Candidates who present only the upside metric get one prompt ("anything you'd watch?"), and if the answer is still thin, the debrief note writes itself.
Never landing the plane. Some candidates treat "it depends" as a destination. It's a starting point: say what it depends on, pick the most likely branch, and commit. Interviewers can coach a wrong-but-reasoned decision; they can't coach indecision.
Fake precision. The mirror-image failure: inventing exact numbers with no stated assumptions. The convention that scores well is announcing estimates as estimates ("call it 2,000 units a month at 50% cannibalization; the call survives volume falling to 1,000 or cannibalization rising to two-thirds, but not both moving together") so the interviewer can challenge the assumption instead of the arithmetic.
Practice these on PracHub
Work these in roughly this order — each drills one layer of the framework:
- Calculate Profit and Analyze Vegan Burger Market Trends (Capital One) — the contribution-margin and break-even mechanics every profitability case assumes.
- Should Company Launch Vegan Burger Based on Profit Analysis? (Capital One) — the full go/no-go decision on top of those mechanics, including the unit-vs-realized-margin trap.
- Calculate Profit-Maximizing Price and Validate with Additional Data (OneMain Financial) — the pricing cousin: derive the optimum, then name what data you'd want before recommending the change.
- Diagnose a 10% DAU drop (Yahoo) — the verify → segment → attribute → decide loop under a deadline.
- Design and Analyze A/B Test for Cashback Program (PayPal) — end-to-end experiment design where the treatment costs real money.
- Design A/B Test for Marketing Campaign Impact Evaluation (Capital One) — experiment design with long-horizon metrics and cross-channel randomization.
- Optimize Credit-Card Strategy: Pricing, Limits, and Target Segments (OneMain Financial) — the multi-dimensional strategy case, for when the single-product versions feel comfortable.
For hundreds more company-tagged analytics and case questions, browse the full bank at prachub.com/questions.
Comments (0)