Kubernetes Interview Questions for SRE and Platform Engineers: Production Scenarios, Not Trivia
Quick Overview
A scenario-based Kubernetes interview guide for SRE and platform engineers. Work through nine production incidents involving Pending pods, CrashLoopBackOff, readiness failures, OOM kills, Services and DNS, stalled rollouts, HPA behavior, unhealthy nodes, and persistent storage. Each scenario shows the evidence to collect, the safest mitigation, and the follow-up controls interviewers expect.
The deployment is green. Every Pod says Running. Customers are still getting 503s.
That is the kind of prompt that separates a production-minded engineer from someone who memorized Kubernetes objects. In an SRE or platform engineering interview, the interviewer is listening for how you scope impact, follow the control loops, choose evidence, reduce risk, and prevent the same incident from returning.
Start by practicing that reasoning with PracHub's real Site Reliability Engineer interview questions. Then use the nine Kubernetes production scenarios below to rehearse concise, evidence-first answers instead of reciting kubectl commands.

Strong Kubernetes interview answers connect user impact to the control loop, workload, node, and traffic path.
Quick Verdict
Kubernetes interview questions for SRE and platform engineers are usually tests of production judgment, not trivia. A strong candidate identifies the blast radius, compares desired state with observed state, isolates the failing layer, chooses a reversible mitigation, and verifies recovery with user-facing signals.
A useful answer pattern is: "First I would protect users and scope the incident. Then I would follow the request or scheduling path until the first broken contract, mitigate there, and verify both service health and Kubernetes state."
This guide stays focused on Kubernetes. For Linux host diagnosis, use the Linux troubleshooting interview guide; for coding, SLOs, reliability design, and incident leadership, use the broader SRE Interview Guide 2026.
What the Interviewer Is Actually Scoring
| Signal | What a strong candidate does | What weak answers do |
|---|---|---|
| Scope | Separates one Pod, one node, one namespace, one zone, or the whole cluster | Assumes the alert already identifies the cause |
| System model | Connects controllers, scheduling, kubelet, networking, storage, and the application | Lists Kubernetes objects without tracing the failure path |
| Evidence | Explains what each event, status, log, or metric would prove | Runs commands without updating a hypothesis |
| Operational judgment | Preserves evidence, limits blast radius, and chooses reversible actions | Deletes Pods or restarts CoreDNS as the first move |
| Prevention | Closes with alerts, safer rollout controls, capacity, or policy changes | Stops when the immediate symptom disappears |
A 60-Second Kubernetes Production Framework
- Protect users. Ask about severity, error rate, affected traffic, recent changes, and whether a rollback or traffic shift is available.
- Scope the failure. Compare healthy and unhealthy Pods, nodes, namespaces, zones, versions, and request paths.
- Read desired versus observed state. Inspect the workload, Pod conditions, controller status, and recent events before changing anything.
- Follow the dependency path. Move from Deployment to Pod, node, Service and EndpointSlice, DNS or network policy, storage, and external dependencies.
- Mitigate, verify, and prevent. Prefer a reversible action, confirm user-facing recovery, and name the guardrail that would catch or prevent recurrence.
The official Kubernetes Pod debugging guide begins with the same principle: triage the failing object first, then inspect its current state and recent events with kubectl describe. The command matters less than why you chose it.
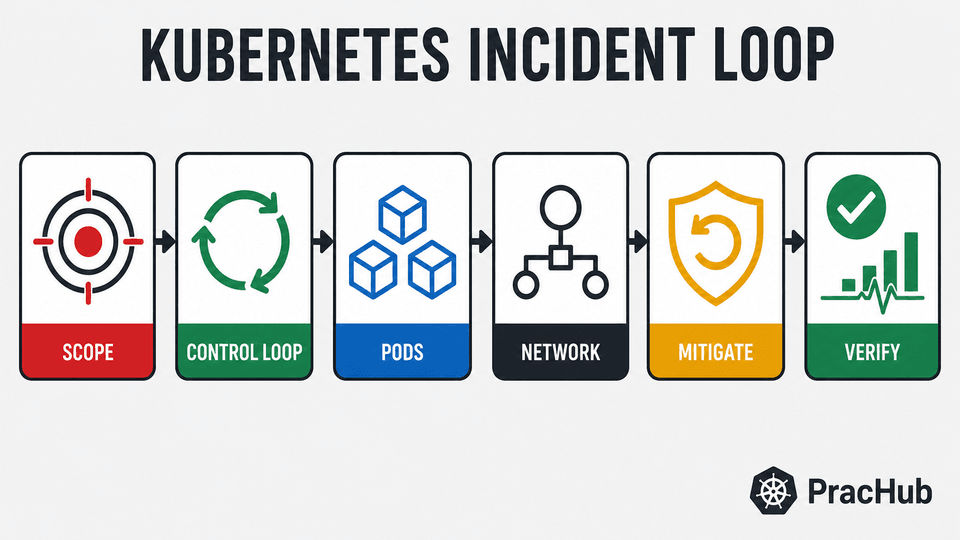
Use one reasoning loop across Pod, network, rollout, node, and storage incidents.
The Fast Evidence Map
| Symptom | First evidence | Likely branches |
|---|---|---|
| Pod is Pending | Pod events and scheduler message | Requests, taints, affinity, quota, PVC |
| CrashLoopBackOff | Termination reason, previous logs, events | App exit, config, Secret, probe, OOM |
| Running but not Ready | Conditions, probe failures, EndpointSlices | Startup, dependency, port, selector |
| Intermittent 503s | Ready endpoints by version, node, and zone | Bad subset, rollout, probe, network path |
| Evictions or restarts | Container reason plus node conditions | Container limit, node pressure, disk, PID |
| HPA is not scaling | HPA conditions, metrics, requests, max replicas | Missing metric, wrong signal, capacity |
| PVC or mount failure | PVC, PV, Pod, and CSI events | Class, access mode, topology, attachment |
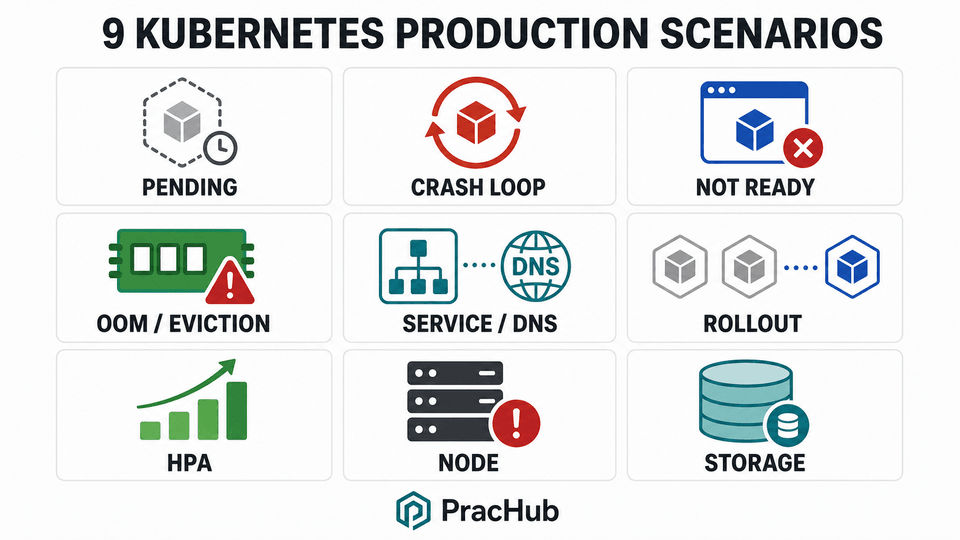
Do not treat a status label as a diagnosis; use it to choose the next layer to inspect.
Pod Lifecycle Scenarios
Scenario 1: A Pod Has Been Pending for 20 Minutes
Start with the scheduler's explanation. Use kubectl describe pod and recent events to see whether the Pod is unschedulable, waiting for storage, blocked by quota, or already assigned to a node but unable to start.
If it is unschedulable, compare requests with allocatable capacity, then inspect taints and tolerations, node selectors, affinity, topology constraints, and any unbound PVC. The official Kubernetes debugging guide notes that insufficient CPU or memory is a common cause, but a strong answer keeps the other constraints open until the event message narrows them.
Safe mitigation: reduce an incorrect request, fix the scheduling constraint, restore the provisioner, or add capacity. Do not delete the Pod repeatedly; the same controller will recreate the same unschedulable specification.
Scenario 2: A Pod Is in CrashLoopBackOff
CrashLoopBackOff describes repeated container failures with restart backoff; it is not the root cause. Check the current and previous container logs, the last termination reason and exit code, restart count, Pod events, mounted configuration, Secrets, and probe failures.
Correlate the first restart with a deployment, configuration change, dependency outage, or resource spike. If the new version is harming users, a rollback can be the right mitigation while you preserve the failing Pod's logs and specification for analysis.
Strong distinction: an application exit, failed startup probe, failed liveness probe, and OOMKilled can all produce restarts, but each requires a different fix.
Scenario 3: Pods Are Running, but None Are Ready
Running is process state; Ready is traffic eligibility. Inspect Pod conditions and probe events, then test the readiness endpoint from the Pod's network context. A readiness failure removes the Pod from matching Service EndpointSlices, so the application can be alive while receiving no regular traffic.
Ask whether startup became slower, a dependency is unavailable, the probe uses the wrong port or path, or the probe is too expensive. A startup probe can protect slow-starting containers from premature liveness failures, while a readiness probe should represent whether the Pod can serve traffic now.
Resource and Traffic Scenarios
Scenario 4: Pods Restart During Traffic Spikes
Separate container OOM, node-pressure eviction, and CPU throttling. For a container OOM, inspect the last termination reason, memory working set, limits, recent deploys, and application allocation behavior. Memory limits are enforced through OOM termination, while CPU limits are enforced through throttling rather than killing the container.
For an eviction, inspect the node's MemoryPressure, DiskPressure, and PIDPressure conditions and compare Pod usage with requests. Raising a limit blindly may move the incident from one container to the whole node; the answer should include right-sizing, leak investigation, capacity, and load-shedding.
Scenario 5: One Service Returns Intermittent 503s
First split results by Pod, version, node, and zone. Then walk the traffic path: Service definition and ports, selector, EndpointSlices, readiness, direct Pod connectivity, DNS, network policy, and the cluster's service implementation.
The official Kubernetes Service debugging guide recommends confirming that EndpointSlices contain the expected Pod IPs. An empty slice often points to a selector mismatch or no Ready Pods; a populated slice with one failing endpoint points toward a bad Pod, node, or application instance.
For DNS, follow the official DNS debugging sequence: test from the same namespace and workload context using a known name such as kubernetes.default, then inspect /etc/resolv.conf, the DNS Service, CoreDNS Pods, and logs. This is stronger than immediately restarting the DNS deployment.
Change and Capacity Scenarios
Scenario 6: A Deployment Rollout Is Stuck
Use kubectl rollout status, compare the old and new ReplicaSets, and inspect events for the new Pods. Common branches include image pull errors, readiness failures, quota, permissions, limit ranges, and runtime configuration.
If availability is falling, pause or roll back based on impact and confidence. Then review maxSurge, maxUnavailable, readiness behavior, progress deadlines, canary signals, and automated rollback criteria.
Senior-level nuance: PodDisruptionBudgets limit certain voluntary evictions, such as node drains, but they do not protect every deletion and do not govern a Deployment's own rolling-update strategy.
Scenario 7: Traffic Doubled, but the HPA Did Not Scale
Inspect HPA conditions, current and target metrics, metric availability, replica limits, Ready Pods, and the target workload. CPU utilization is calculated relative to container CPU requests; if the relevant request is missing, utilization for that Pod is undefined and that metric cannot drive normal scaling.
Next ask whether CPU is the right demand signal. A queue depth, concurrency, request rate, or latency-based external metric may lead traffic more directly. Also confirm that new Pods can schedule and start quickly enough; an HPA decision does not create node capacity or eliminate slow initialization.
Node and Storage Scenarios
Scenario 8: A Node Becomes NotReady and Pods Are Disappearing
Scope whether the issue is one node, one zone, or control-plane connectivity. Inspect Node conditions, taints, leases and events, then check kubelet, container runtime, CNI, host networking, disk, memory, PID capacity, and the underlying VM or machine.
As documented in Kubernetes Node management, the node controller marks an unreachable node's Ready condition as Unknown and may later begin evicting its Pods. During the incident, protect service capacity and avoid draining more nodes; afterward, address topology spread, disruption budgets, system reservations, node alerts, and repair automation.
Scenario 9: A Stateful Pod Cannot Mount Its Volume
Read events from the Pod, PVC, PV, StorageClass, and CSI components. Check whether the claim is bound, the requested class and access mode match, topology or zone constraints are satisfiable, and the volume is attached elsewhere.
Do not delete claims or volumes casually. Confirm reclaim policy, data ownership, snapshots, and whether the workload can safely fail over. The prevention discussion should cover storage monitoring, tested restore procedures, topology-aware provisioning, and a runbook for attachment conflicts.
How Senior Candidates Turn Diagnosis Into Prevention
After the immediate fix, connect the failure to a control. A probe issue becomes a staged rollout and probe test. A capacity incident becomes request right-sizing, autoscaling validation, and load testing. A node failure becomes topology spread and an exercised disruption plan.
Interviewers also want to hear how you verify the change. Check the user-facing SLI first, then workload availability, restart or eviction rates, latency and saturation, rollout state, and whether the original alert has recovered without hiding a new failure.
For deeper incident leadership practice, pair these technical scenarios with PracHub's incident response interview questions and use company-specific interview prep to see how the surrounding loop changes by employer.
Common Mistakes That Cost Candidates the Round
- Starting with a destructive action. Restarting, deleting, or draining before preserving evidence can erase the clue and increase impact.
- Treating status as root cause.
Pending,CrashLoopBackOff, andNotReadyare branch points, not explanations. - Ignoring the application. Kubernetes can route to a healthy-looking process that is returning errors, deadlocked, or waiting on a dependency.
- Forgetting mitigation. Diagnosis matters, but an SRE answer must also protect users while investigation continues.
- Stopping after recovery. Close with verification, prevention, ownership, and a measurable follow-up.
A 7-Day Kubernetes Interview Practice Plan
| Day | Practice focus | Output |
|---|---|---|
| 1 | Pending, image pull, and CrashLoopBackOff | Three two-minute diagnosis answers |
| 2 | Readiness, Services, EndpointSlices, and DNS | One end-to-end traffic-path explanation |
| 3 | Requests, limits, OOM, throttling, and eviction | A comparison without mixing failure modes |
| 4 | Rollouts, rollback, and disruption | A mitigation-first deployment incident answer |
| 5 | HPA, metrics, and cluster capacity | An autoscaling diagnosis with one prevention change |
| 6 | Node and persistent storage failures | Two safe operational run-throughs |
| 7 | Mixed mock incident | A 30-minute interview with follow-up questions |
Kubernetes Interview FAQ
What Kubernetes topics are most important for an SRE interview?
Prioritize Pod lifecycle, scheduling, requests and limits, probes, Services and EndpointSlices, DNS and network policy, rollouts, autoscaling, node health, storage, observability, and incident mitigation. Learn how these pieces interact under failure instead of studying each API object in isolation.
Should I memorize kubectl commands?
Memorize a small evidence toolkit such as get, describe, logs --previous, events, rollout status, and targeted exec checks. More importantly, explain what you expect each command to show and how the result changes your next hypothesis.
How do SRE and platform engineering Kubernetes interviews differ?
SRE interviews often emphasize user impact, SLOs, incident response, observability, and safe mitigation. Platform engineering interviews add multi-tenancy, paved roads, policy, upgrades, developer experience, and fleet operations. Both expect production troubleshooting and clear trade-off reasoning.
How should I practice scenario-based Kubernetes questions?
Answer aloud with a timer. Begin with impact and scope, name two or three hypotheses, choose evidence that separates them, propose a reversible mitigation, and finish with verification and prevention. Vary one constraint each time, such as multi-zone failure, no shell access, or a stateful workload.
Final Takeaway
The strongest Kubernetes interview answer is not the longest command list. It is a controlled investigation that moves from customer impact to desired and observed state, finds the first broken contract, restores service safely, and improves the system afterward.
Use PracHub's real SRE interview questions and written solutions to identify the scenarios your target companies actually ask. Practice the framework until your answer sounds like an engineer operating production, not a candidate recalling a cheat sheet.
Sources and Further Reading
- Kubernetes: Debug Pods
- Kubernetes: Pod Lifecycle
- Kubernetes: Debug Services
- Kubernetes: Resource Management for Pods and Containers
- Kubernetes: Liveness, Readiness, and Startup Probes
- Kubernetes: Horizontal Pod Autoscaling
- Kubernetes: Node-pressure Eviction
- Kubernetes: Persistent Volumes
- Kubernetes: Deployments
- Kubernetes: Disruptions and PodDisruptionBudgets
- Kubernetes: Nodes
- Kubernetes: Debugging DNS Resolution
Comments (0)