Monitoring and Observability Interview Questions: Metrics, Logs, Traces, SLOs, and Alerting
Quick Overview
A production-scenario guide to monitoring and observability interview questions for SRE and backend engineers. Practice eight incidents involving misleading dashboards, alert storms, high-cardinality metrics, missing log context, broken distributed traces, hidden p99 latency, rapid SLO burn, and regional blind spots. Each answer connects user impact to evidence, mitigation, verification, and a stronger reliability control.
The checkout dashboard is green, but customers cannot pay. Average latency looks normal, the logs are noisy, the failed traces were sampled out, and no alert fired.
That is the real test behind monitoring and observability interview questions. Interviewers want more than definitions of metrics, logs, and traces. They want to know whether you can identify the user-visible failure, choose the right evidence, restore service, and fix the blind spot that let the incident hide.
Start with PracHub's real Site Reliability Engineer interview questions or Backend Engineer interview questions. Then practice the eight production scenarios below aloud, using the same evidence-first structure each time.
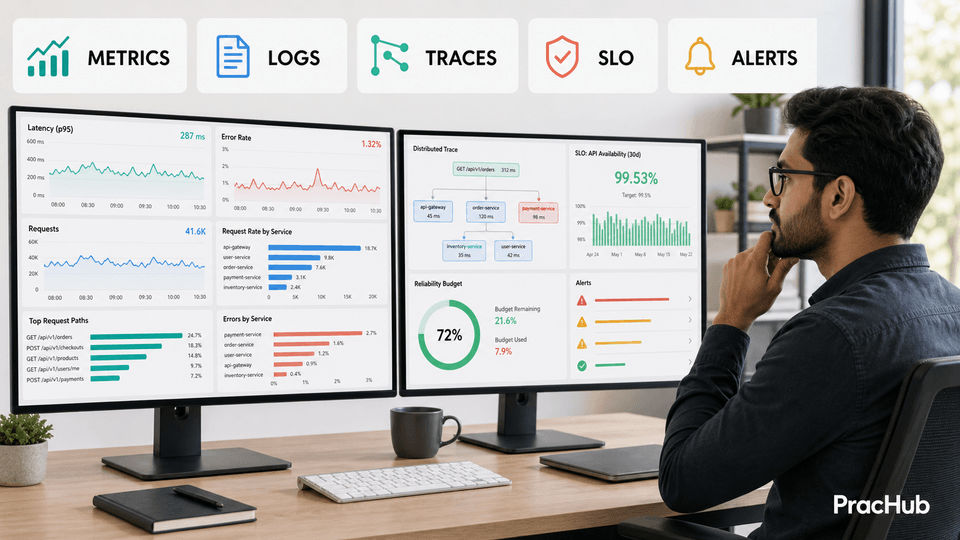
Strong observability answers connect user impact to the signal that can prove what failed.
Quick Verdict
A strong answer does not open five dashboards and hope a pattern appears. It defines the affected user journey, chooses a meaningful service-level indicator, uses metrics to localize the change, follows the request with traces, confirms the mechanism in logs, and verifies recovery from the user's side.
Use this answer spine: "I would define the user impact, compare a failing slice with a healthy control, find the first divergent signal, apply the smallest reversible mitigation, and verify both recovery and SLO burn."
This guide focuses on telemetry and reliability decisions. For the response process around an outage, use the Incident Response Interview Guide. For the broader loop, see the SRE Interview Guide 2026.
What the Interviewer Is Actually Scoring
| Signal | Strong evidence | Weak answer |
|---|---|---|
| User focus | Defines the failed journey, population, and time window | Starts with host CPU because it is easy to graph |
| Signal choice | Explains why a metric, log, or trace answers the next question | Lists tools without a hypothesis |
| Correlation | Connects one request, release, region, and dependency across signals | Treats every dashboard as a separate truth |
| Operational judgment | Preserves evidence and chooses a reversible mitigation | Restarts everything before scoping impact |
| Reliability control | Improves the SLI, alert, instrumentation, or runbook | Stops when the graph turns green |
A 90-Second Observability Incident Framework
- Define impact. Name the user journey, symptom, affected segment, start time, and business risk.
- Choose the SLI. Measure the user outcome: successful requests, latency under a threshold, freshness, correctness, or another valid event ratio.
- Use metrics to localize. Compare rate, errors, latency distribution, and saturation by region, endpoint, version, and dependency.
- Follow the path with traces. Find the slow or failed span and verify that context survives every service and queue boundary.
- Confirm detail in logs. Query structured events using the trace ID, request ID, release, tenant, and error classification.
- Mitigate and close the gap. Roll back, shift traffic, or shed load; verify recovery, then repair the missing telemetry or alert.
Google's SRE guidance separates symptoms from causes and recommends paging on problems that are already creating real user-visible symptoms. Its four golden signals are latency, traffic, errors, and saturation. Those are a starting point, not a substitute for a service-specific SLI.
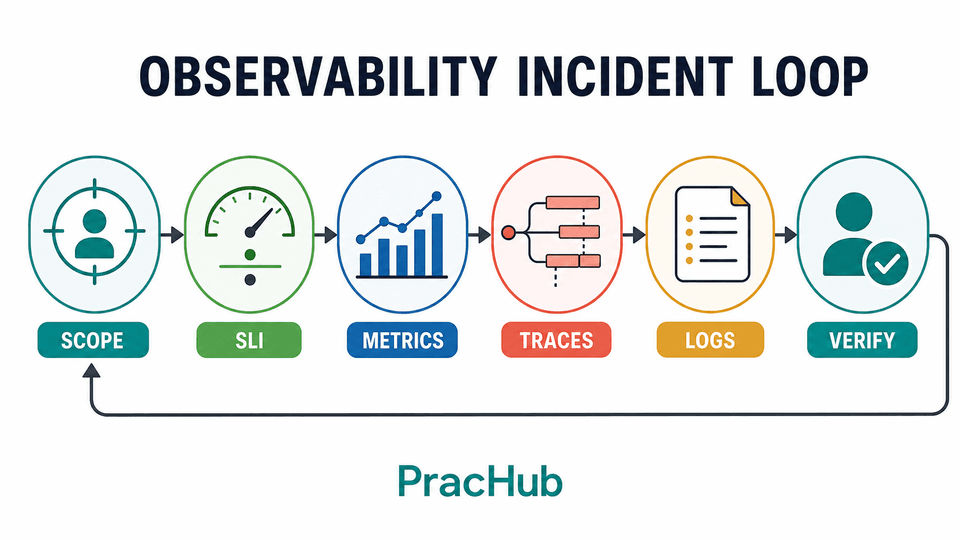
Move from the user's failed outcome toward the responsible component, then back to the user to verify recovery.
Choose the Right Signal for the Question
| Signal | Best question it answers | Common misuse |
|---|---|---|
| Metrics | When, where, and how broadly did behavior change? | Adding unbounded labels or trusting one average |
| Logs | What exact event, state, or error occurred? | Free-text messages without stable fields or correlation IDs |
| Traces | Where did one request spend time or cross a failure? | Missing context at async boundaries or sampling away rare errors |
| SLOs | Is reliability acceptable for the user journey over time? | Defining the objective around an infrastructure metric |
| Alerts | Does a human need to act now, and what should they do? | Paging on every cause-shaped threshold |
OpenTelemetry describes telemetry signals as different views of underlying system activity. Metrics summarize behavior, logs record events, and traces connect operations across a request path. Mature answers explain how the signals reinforce one another rather than declaring one signal universally best.
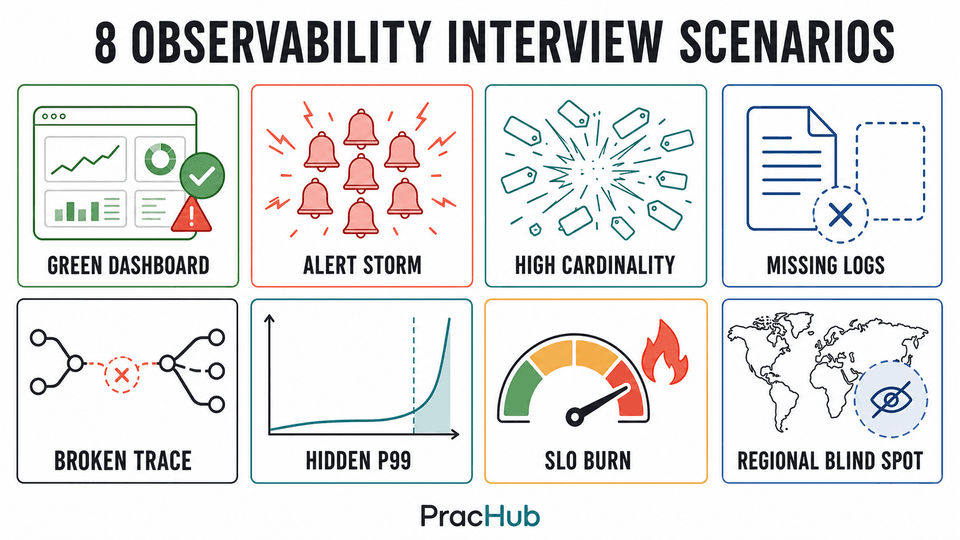
Each scenario tests a different failure in measurement, correlation, or actionability.
Metrics and Dashboard Interview Scenarios
Scenario 1: Dashboards Are Green, but Checkout Is Failing
First challenge what "green" measures. Compare successful checkout completions with valid checkout attempts, segmented by region, client, payment method, endpoint, and release. A service-wide request average can hide a small but valuable cohort, while server-side success can miss a broken browser or mobile flow.
Use black-box or client-side evidence to confirm the symptom, then follow one failed request into service metrics, traces, and logs. Mitigate the bad release or dependency path, and replace the misleading dashboard with an SLI closer to the user's completed outcome.
Scenario 2: Average Latency Is Healthy, but Users Report Timeouts
Ask for the latency distribution and split it by endpoint, region, status, dependency, and version. A healthy average can coexist with a severe tail, and fast failures can even make the average look better. Inspect p95 or p99 alongside timeout rate and the count of valid requests.
Do not average precomputed p99 values across instances. Prometheus documents why averaging quantiles is statistically invalid and shows how aggregatable histograms support service-level quantiles. A strong answer also checks bucket design, clock consistency, and whether client and server latency measure the same boundary.
Scenario 3: The Metrics Backend Becomes Slow and Expensive
Inspect time-series growth by metric and label. Labels such as user_id, raw URL, request ID, or unbounded error text create a new series for many values. Prometheus warns that every label set adds resource cost, while OpenTelemetry explains that high-cardinality attributes require separate aggregation state.
Keep low-cardinality dimensions needed for alerting and aggregation, such as service, region, status class, and normalized route. Move request-level detail to logs or traces, remove the offending label, and verify that ingestion lag and query latency recover before restoring normal retention.
Logs and Traces Interview Scenarios
Scenario 4: Logs Exist, but Nobody Can Explain One Failed Request
Check whether the logs are structured, timestamped consistently, and enriched with service, environment, normalized error type, request or trace ID, and release version. JSON alone is not enough; OpenTelemetry defines structured logs by a stable schema and typed fields.
Also inspect collection lag, dropped records, retention, access controls, and redaction. During the incident, correlate the smallest useful set of events around one failed request. Afterward, standardize semantic fields and add a query or runbook that another responder can use without knowing the original code.
Scenario 5: A Distributed Trace Stops at an Async Queue
Verify that the producer injects trace context into message metadata and the consumer extracts it before creating spans. The W3C Trace Context standard defines the vendor-neutral traceparent header; message systems may use an equivalent carrier. For asynchronous fan-out or delayed work, span links can preserve causal relationships even when a simple parent-child chain is misleading.
Then check sampling, collector drops, clock skew, and service naming. Head sampling can discard a trace before its later error is known; tail sampling can retain traces based on errors, latency, or attributes, although it adds state and operational cost.
SLO and Alerting Interview Scenarios
Scenario 6: An Alert Storm Pages Five Teams for One Incident
Identify the user-facing symptom and the service that owns mitigation. Group duplicate notifications by incident, inhibit downstream cause alerts when a higher-level symptom alert is active, and route pages only where a responder has an immediate action. Capacity forecasts and weak anomalies may belong in tickets rather than pages.
For every page, ask: What user impact does this represent? What first action should the owner take? What condition resolves it? After mitigation, use the alert history to remove noisy rules, add ownership and runbook links, and test the routing path.
Scenario 7: A Deployment Rapidly Burns the Error Budget
State the SLI as good events divided by valid events, confirm the evaluation window, and compare burn by version, region, and request class. A 99.9% objective leaves 0.1% of valid events as the error budget; the operational question is how quickly the release is consuming it.
If the new version is the clear change and rollback is safe, protect the budget first. Google's SRE Workbook recommends multiwindow, multi-burn-rate alerting so fast failures trigger urgent action while slower sustained loss can create a lower-urgency notification. Verify recovery with the SLI, not only deployment health.
Coverage and Blind-Spot Interview Scenarios
Scenario 8: One Region Fails, but No Alert Fires
Compare regional traffic, success, latency, and synthetic probes with global aggregates. Determine whether the alert lacked a regional dimension, the probe ran from the same healthy network as the service, low traffic diluted the signal, or missing data was interpreted as success.
Shift traffic or disable the unhealthy path, then validate from an affected client location. Prevention may require external probes, minimum-traffic handling, missing-data alerts, and explicit coverage tests. No alert is evidence about the monitoring system, not proof that users were healthy.
How the Bar Changes by Role
SRE candidates should go deeper on SLIs, SLOs, error budgets, paging policy, telemetry pipelines, incident mitigation, and operational ownership. Backend candidates should emphasize instrumentation boundaries, stable log fields, trace propagation, dependency spans, latency histograms, and how code changes remain observable in production.
At senior levels, expect follow-ups about cost, privacy, sampling, retention, multi-tenancy, and failure of the observability stack itself. The best answer chooses enough telemetry to make a decision without pretending that unlimited data is free.
Common Mistakes That Cost Candidates the Round
- Starting with a vendor. Name the question and signal before the dashboard or product.
- Using infrastructure health as the SLO. CPU can be healthy while a user journey fails.
- Adding request IDs as metric labels. Correlate request-level detail in logs and traces.
- Paging on every threshold. A page needs urgency, ownership, and a concrete action.
- Stopping after mitigation. Verify from the user side and repair the missing control.
A 5-Day Observability Interview Practice Plan
| Day | Focus | Practice output |
|---|---|---|
| 1 | Metrics, distributions, and dashboard traps | Diagnose green averages hiding a bad cohort |
| 2 | Structured logs and trace correlation | Follow one request across three services |
| 3 | Context propagation and sampling | Repair a trace broken by an async queue |
| 4 | SLIs, SLOs, error budgets, and alerts | Explain rollback using burn, not intuition |
| 5 | Mixed production mock | Impact, evidence, mitigation, verification, prevention |
Use PracHub's Kubernetes production scenarios when you want to apply this framework to pods, rollouts, services, and cluster dependencies.
Monitoring and Observability Interview FAQ
What is the difference between monitoring and observability?
Monitoring collects and evaluates known signals about system behavior. Observability is the practical ability to infer internal system state from available outputs, including questions you did not predict in advance. In interviews, the distinction matters less than showing how you turn telemetry into a testable hypothesis and action.
Should I start with metrics, logs, or traces?
Start with the question. Metrics usually scope when and where behavior changed, traces reveal the path and slow or failed operation, and logs provide detailed event context. A strong investigation moves between them using shared dimensions such as time, service, release, region, and trace ID.
What makes a good SLO interview answer?
Define a user-relevant SLI, specify valid and good events, choose a window and objective, explain the resulting error budget, and connect budget consumption to an operational decision. Also discuss limitations: low traffic, missing telemetry, client-side failures, and segments hidden by global aggregation.
How should I answer an alerting design question?
Begin with user impact and urgency. Choose a signal that identifies a condition requiring human action, define ownership and a first response, control duplicates, and explain resolution. Use separate severities or channels for urgent pages, actionable tickets, and informational dashboard signals.
Final Takeaway
The strongest monitoring and observability interview answers are decision systems, not telemetry inventories. They connect a failed user outcome to the right SLI, use metrics to scope it, traces and logs to explain it, alerts to mobilize the right owner, and an SLO to judge urgency.
Practice that reasoning with PracHub's real SRE interview questions and written solutions, explore Backend Engineer interview questions, and use company-specific interview prep to match the depth of your target loop.
Comments (0)