SHL Numerical Reasoning Test: Interactive Charts, Ratios, and Worked Examples
Quick Overview
Identify the SHL numerical reasoning format and practice chart allocations, changing shares, percentages, and weighted rates with worked examples.
An SHL numerical reasoning question can go wrong twice: when you calculate the answer, and when you place that answer into a chart. Prepare by identifying the test version, translating each condition into a relationship, choosing the correct denominator, and checking the final displayed values before submitting.
SHL's published Verify Interactive Numerical Reasoning fact sheet lists 18 minutes and a maximum of 10 questions. That is a product specification, not a promise about every assessment carrying the SHL name. Your invitation and launch instructions identify the test you actually have. Official fact sheet
The examples below are original practice exercises, not copied SHL questions. Official product facts are labeled; calculation methods and pacing suggestions are preparation advice. No candidate anecdotes are used to infer an employer's format or passing score. For further quantitative practice, browse PracHub's Statistics & Math questions.
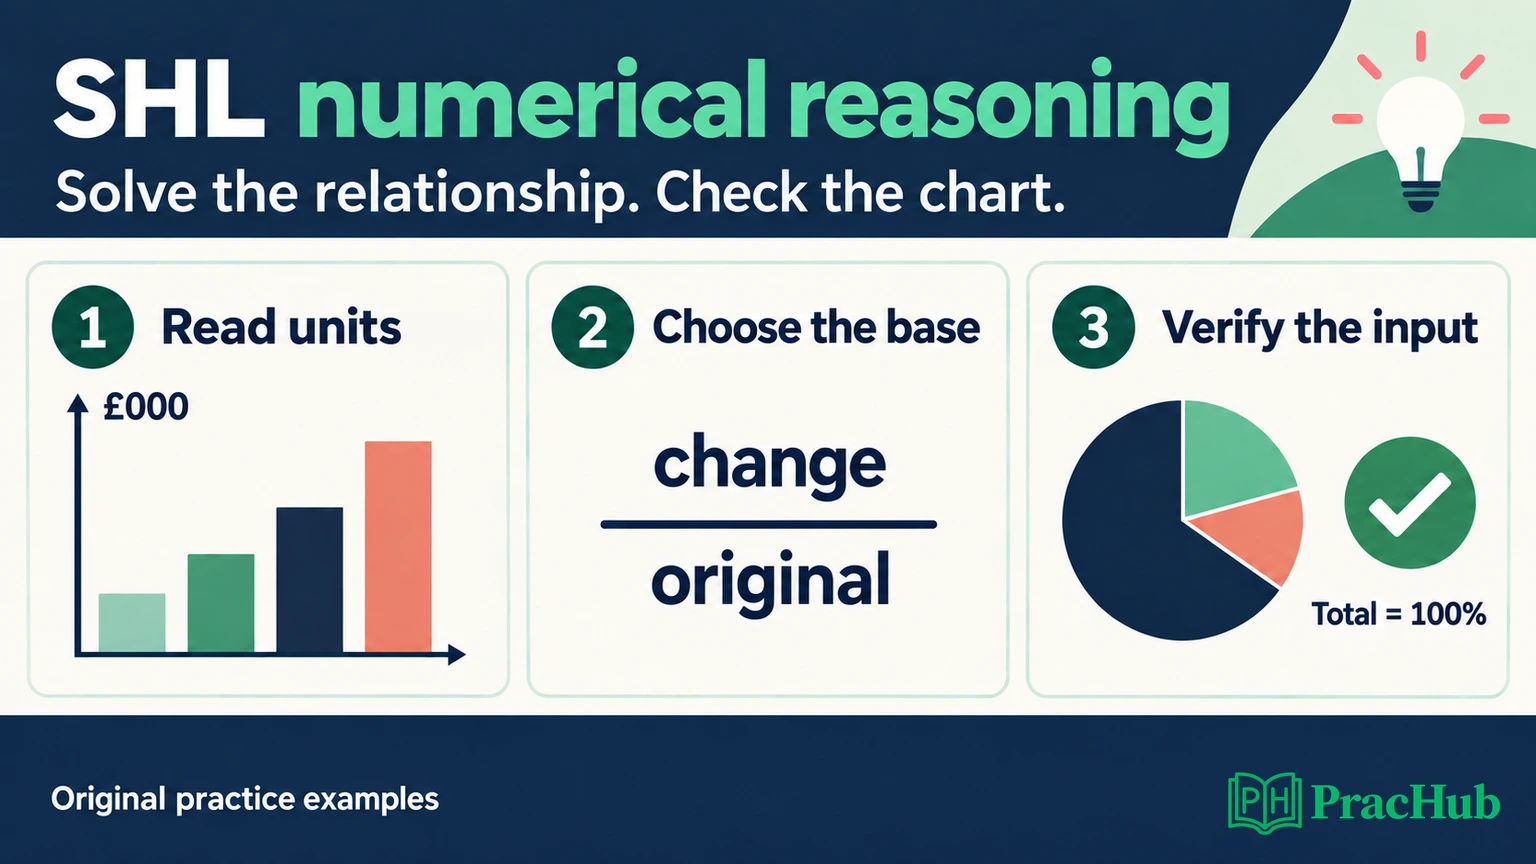
Identify the numerical test before choosing a pace
Official product information: Verify Interactive Numerical Reasoning uses an adaptive, activity-based format. SHL describes numerical tasks involving workplace data and representations such as charts, graphs, and spreadsheets. The product's name matters: Numerical Reasoning, Numerical Calculation, and a combined ability assessment are not interchangeable labels.
SHL's retirement notice lists legacy Verify Numerical Reasoning among products retired during 2024, with replacement options including Verify Interactive Numerical Reasoning and Verify Numerical Ability. A preparation page describing an old multiple-choice format may therefore be the wrong pacing reference for your invitation. Legacy product notice
Record the exact assessment name, time limit, response controls, calculator instructions, and navigation rules before starting. Do not infer numerical reasoning from an employer's use of SHL elsewhere. Likewise, a pattern-sequence exercise belongs to a different preparation problem; our SHL inductive reasoning guide covers that separate intent.
Read the chart requirements before touching a control
First identify what your chart must represent: units, total, categories, time period, and required precision. A stacked bar might need both its overall height and its internal proportions changed. Getting one correct does not guarantee the other.
Start with the requested output. Is it a count, a percentage, a percentage-point difference, or a ratio? Then inspect axis units and labels. A revenue axis marked £000 means a displayed value of 240 represents £240,000. Converting that to individual pounds when the input expects thousands creates a thousandfold error.
Use an estimate before exact arithmetic. A category described as half the total should occupy about half the chart; a 12% increase should produce a multiplier near 1.12. Estimation catches misplaced decimals and reversed relationships without replacing the calculation.
Finally, treat interaction as a separate step. Calculate on permitted working materials, translate the result into the required representation, and read the resulting labels. Do not assume that dragging a handle to a visually plausible position entered the exact value. The interface supplied with your test determines how precision is controlled.
Worked example 1: turn ratio clues into an allocation
Original exercise: A team has a £1,200 budget across Research, Operations, and Support. Operations receives twice Research's allocation. Support receives £200 more than Research. Find each allocation and its share of the budget.
Let Research equal x. Operations is 2x, and Support is x + 200. The total equation is x + 2x + x + 200 = 1,200. Therefore 4x = 1,000, so Research receives £250, Operations £500, and Support £450.
| Category | Allocation | Share of £1,200 | Pie angle |
|---|---|---|---|
| Research | £250 | 20.833…% | 75° |
| Operations | £500 | 41.666…% | 150° |
| Support | £450 | 37.5% | 135° |
Check the original conditions before formatting: 500 is twice 250; 450 exceeds 250 by 200; the allocations sum to 1,200. The angles sum to 360 degrees. These checks are independent of whether the chart looks balanced.
A tempting wrong solution treats the categories as a 1:2:1 ratio and ignores the extra £200. Another subtracts £200 from every category before allocating the remainder. The equation prevents both mistakes because it attaches the extra amount to Support alone.
If the input asks for currency, enter the allocations. If it asks for percentages or angles, convert using the whole budget as the denominator. Retain the exact fractions during working and round only to the requested precision. This practice example intentionally has repeating percentage decimals; it does not imply an SHL control will accept arbitrary precision.
Worked example 2: a smaller share can mean a larger count
Original exercise: January has 500 support tickets, 60% received by email. February has 600 tickets, 55% by email. How many email tickets arrive in each month, and how does email volume change?
January email tickets equal 500 × 0.60 = 300. February email tickets equal 600 × 0.55 = 330. Email volume rises by 30 tickets, or 30 ÷ 300 = 10%, even though its share of all tickets falls.
The share changes from 60% to 55%, a decrease of 5 percentage points. Its relative decrease is 5 ÷ 60 = 8.333…%. Neither number is the percentage change in email ticket count. All three descriptions concern different quantities.
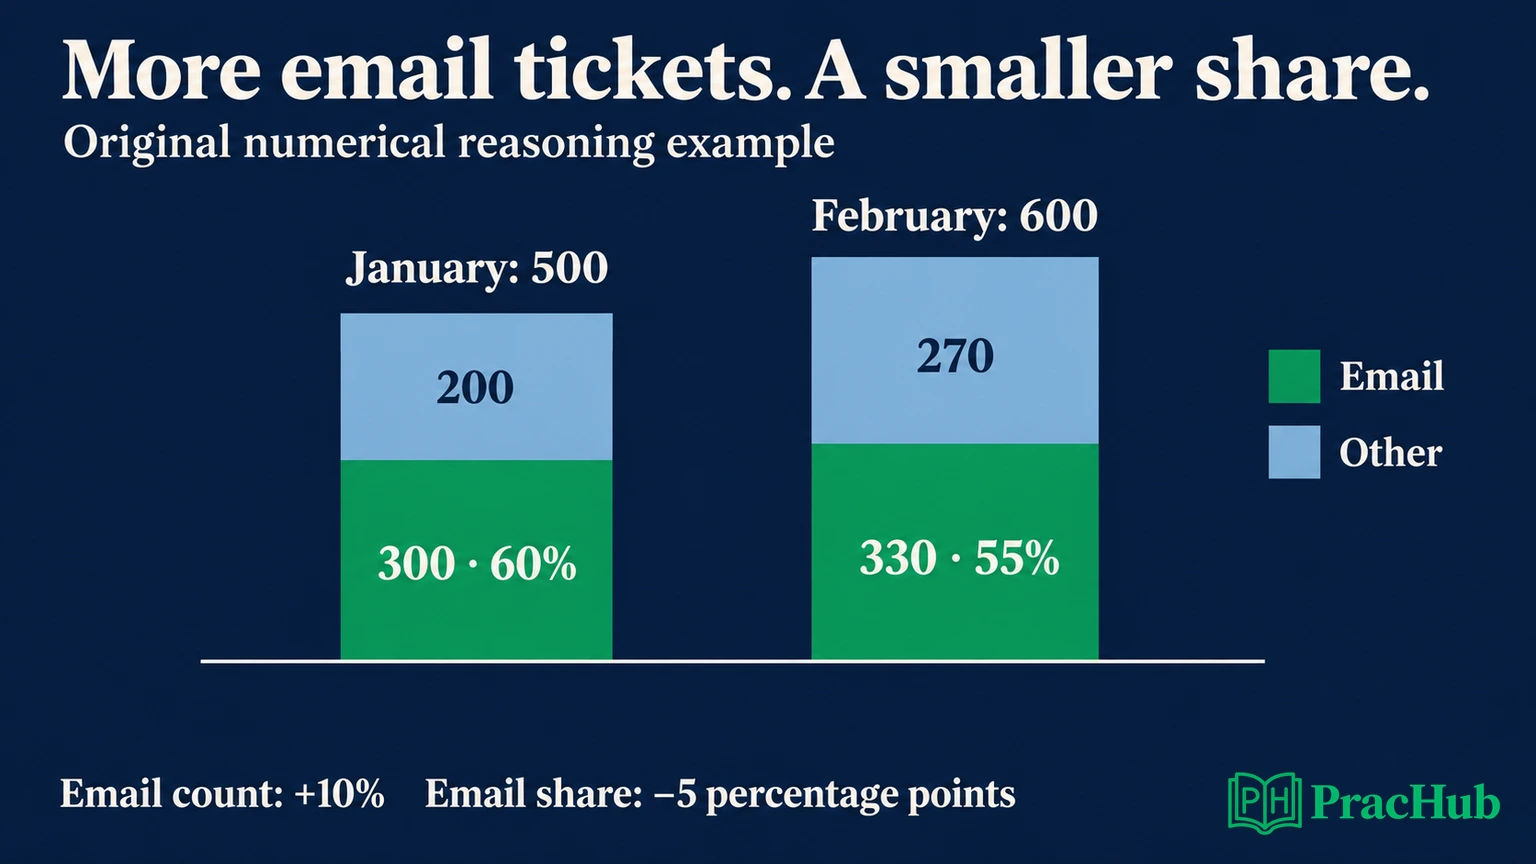
To construct a stacked count chart, January's bar totals 500 with 300 email and 200 other tickets. February's totals 600 with 330 email and 270 other tickets. The second total bar is taller, while email occupies a smaller fraction of it.
A 100% stacked chart would show equal total bar heights and only the 60/40 and 55/45 proportions. That display is useful for comparing shares, but cannot show the larger February total by height. Read the requested chart type instead of carrying assumptions from a previous question.
This is the central interpretation habit: say the noun after the number. “Email count rose 10%” and “email share fell 5 percentage points” are both true. “Email fell 5%” is ambiguous and, under the count interpretation, wrong.
Worked example 3: choose the base for a percentage
Original exercise: A product costs £120 and sells for £150. Profit is £30. What are its profit margin and markup on cost?
Margin divides profit by revenue: 30 ÷ 150 = 20%. Markup divides profit by cost: 30 ÷ 120 = 25%. The numerator is identical; the denominator changes the meaning. Label the base before entering a calculator expression.
For a reverse-percentage question, work with a multiplier. If a service's new price is £230 after a 15% increase, the original price is 230 ÷ 1.15 = £200. Subtracting 15% of £230 gives £195.50, which uses the final price as the base and fails the forward check.
Verify by reversing your answer: 200 × 1.15 = 230. The same approach applies to decreases. A final value after a 20% reduction represents 80% of the original, so divide by 0.80 to recover the original rather than adding 20% of the smaller value.
Treat phrases such as “of sales,” “on cost,” “compared with last year,” and “remaining budget” as mathematical instructions. They define the denominator. Memorizing a formula without reading those words is a common route to a precise but irrelevant answer.
Worked example 4: combine unequal groups correctly
Original exercise: Team A resolves 25% of its 40 cases on the first contact. Team B resolves 75% of its 160 cases on the first contact. What is the combined first-contact resolution rate?
Recover the counts: Team A resolves 10 cases, Team B resolves 120. The combined rate is (10 + 120) ÷ (40 + 160) = 65%. Averaging 25% and 75% gives 50%, which treats the teams as equally sized.
A quick check is that the overall rate must lie between 25% and 75% and should be closer to 75%, because Team B handles four times as many cases. This bound would not by itself prove 65%, but it exposes many calculation errors before you submit.
The correct weight is the denominator of the rate. Here that is case count, not team count, staffing level, or total handling time. If a question asks for an average of team rates rather than the overall case-level rate, that is a different requested statistic. Read the population the final number describes.
Do not average rates across periods with different volumes unless the question calls for that calculation. Add compatible numerators and denominators first. For incompatible units—such as a monthly rate and a daily total—align the measurement periods before combining them.
Finish with an input audit
Once the relationship is solved, verify that the entered answer still satisfies it. In the budget example, the chart must preserve the £1,200 total and the two allocation constraints. In the ticket example, the total height and the split must correspond to the same month.
Check labels after changing a control. If the interface recalculates one field when another changes, inspect the final state after all edits. A previously correct value might no longer be the one displayed. This is preparation advice about checking coupled inputs, not a claim that every SHL item behaves identically.
Use exact working values until the final step. Rounding intermediate percentages can create category totals of 99% or 101%. Follow the question's precision and total rules; do not invent a residual-adjustment method unless the task permits one. If an answer cannot be represented as instructed, revisit the units and equations first.
Distinguish “cannot determine” from “I have not calculated it yet.” A chart with percentages but no total may support a share comparison while leaving absolute counts unknown. No amount of arithmetic can recover missing scale without another constraint.
Practice timing and calculator use without guessing the rules
Dividing the published 18 minutes by the maximum 10 questions gives 108 seconds per question as a rough practice reference. This is our arithmetic, not an SHL recommendation or a per-question timer. Some items will take longer to interpret or enter, and the actual instructions govern navigation.
Use early practice to separate setup time, calculation time, and input time. If equations are quick but chart entry is slow, more mental arithmetic will not solve the main problem. If entry is accurate but the denominator is wrong, rehearse translating short statements before timing yourself again.
Official calculator guidance: SHL says calculators may be used for numerical or calculation tests unless you have been instructed otherwise. Check your invitation and assessment instructions for the applicable rule. A calculator confirms arithmetic; it cannot choose between revenue and cost as the base. SHL calculator guidance
Official practice guidance: SHL says its practice material primarily helps candidates become comfortable with assessment mechanics, and not every test produces a report. Its short examples can provide answers and explanations, while full-length timed-test answer keys are not supplied. Use this distinction when reviewing practice results. Practice guidance, Answer and feedback guidance
A practice percentage is feedback on that practice attempt. It does not establish an employer's hiring threshold. This guide makes no universal passing-score claim.
Use these questions for transferable numerical practice
The following PracHub questions train calculations and interpretation beyond the SHL interface. They are not SHL replicas. For longer cases, focus first on the quantitative subproblem listed here rather than treating the full case as a timed numerical item.
| PracHub question | Relevant practice |
|---|---|
| Solve quantitative word and algebra problems | Translate units, percentage changes, and constraints into equations. |
| Calculate Profitability with Different Pricing Schemes | Separate revenue, fixed cost, variable cost, and the requested result. |
| Calculate Annual Profit of Credit Card Portfolio | Align monthly and annual units before combining values. |
| Explain and resolve Simpson’s paradox | Inspect subgroup sizes and weighted totals; leave causal extensions for later. |
| Explain Statistical Outputs to Non-Technical Stakeholders | Describe what a chart communicates; focus on visual interpretation first. |
After each attempt, classify the mistake: wrong unit, wrong denominator, missed condition, arithmetic error, or incorrect input. Then redo one example with changed numbers. Continue with Statistics & Math practice on PracHub, checking both the reasoning and the final representation.
Comments (0)