Capital One Product Manager Interview Prep Guide
Everything Capital One actually asks Product Manager candidates — concept walkthroughs, worked examples, and the real interview questions, drawn from candidate reports. Free to read.
Last updated

Focus most on Capital One case strategy, fintech/card fundamentals, metric design, A/B testing, estimation, and technical basics because you rated Product / Decision Making 2/5 and flagged non-tech, brand-new-fintech gaps. Behavioral is comparatively lighter at 3/5, so merely review STAR structure and translate your logistics business-lead experience into PM ownership, stakeholder, and trade-off stories. Capital One-specific emphasis is credit card economics, acquisition funnels, fair lending/compliance, fraud and credit risk controls, and card-network/payment basics. With less than a week, budget roughly 3–4 hours for the emphasized product/case sections first, then use the shorter HR and behavioral sections for rehearsal.
HR Screen — 24 min
Product / Decision Making
-
Data-Driven Product Decisions (Focus) — covered in depth under Onsite below.
-
Practical Analytics And SQL Fluency (Focus) — covered in depth under Onsite below.
-
Experimentation And A/B Testing (Focus) — covered in depth under Onsite below.
-
Technical Tradeoffs And Pilot Execution (Focus) — covered in depth under Onsite below.
HR Screen — 6 min
Behavioral & Leadership
- Stakeholder Leadership And STAR Storytelling (Focus) — covered in depth under Onsite below.
Technical Screen — 72 min
Product / Decision Making
-
Case Interview Framing And Structured Communication (Focus) — covered in depth under Onsite below.
-
Market Sizing And Estimation Cases (Focus) — covered in depth under Onsite below.
-
Credit Card Product Strategy (Focus) — covered in depth under Onsite below.
-
Payments And Card Network Fundamentals (Focus) — covered in depth under Onsite below.
-
Customer Segmentation And Funnel Strategy (Focus) — covered in depth under Onsite below.
-
Data-Driven Product Decisions (Focus) — covered in depth under Onsite below.
-
Practical Analytics And SQL Fluency (Focus) — covered in depth under Onsite below.
-
PM Technical Fundamentals For Non-Technical Candidates (Focus) — covered in depth under Onsite below.
-
ML/Data Pipelines For Product Managers (Focus) — covered in depth under Onsite below.
-
Financial Services Compliance And Fair Lending (Focus) — covered in depth under Onsite below.
-
Fraud, Credit Risk, And Risk Controls (Focus) — covered in depth under Onsite below.
Technical Screen — 6 min
Product Design & Strategy
Onsite — 90 min
Product / Decision Making
Focus area — You expect mini case interviews and heavy strategy; drill clarifying questions, frameworks, trade-offs, recommendation structure, and concise synthesis.
What's being tested
Interviewers are assessing your ability to structure ambiguous problems, make defensible trade-offs, and communicate a clear plan that links customer need, measurable outcomes, and implementation risks. At Capital One, this tests whether you can prioritize within regulatory and credit-risk constraints, define success with the right metrics, and align cross-functional partners. Expect probing on clarity (what you assume), measurability (how you know it worked), and sequencing (what you build first).
Core knowledge
-
Hypothesis-driven approach — start with a clear, testable hypothesis (e.g., “targeted cashback will increase activation by X%”); this keeps scope measurable and experimentable.
-
Issue tree / MECE decomposition — break problems into mutually exclusive, collectively exhaustive buckets (demand drivers, conversion funnel, product friction, trust/credit constraints).
-
Top-down metrics — define a North Star and supporting metrics: use
`DAU`/`MAU`, conversion rate, wallet share, and`NPS`; map leading vs lagging indicators for early detection. -
RICE / ICE prioritization — score ideas with Reach × Impact × Confidence / Effort (
`RICE`) or`ICE`to justify roadmap ordering quantitatively; state assumptions behind each input. -
A/B test basics — define primary metric, minimum detectable effect (MDE), sample size, duration, and guardrails for heterogenous effects; track both intent-to-treat and per-segment lift.
-
Forecasting & unit economics — model uplift to ROI: ΔRevenue ≈ Users × BaselineConv × Uplift × ARPU − IncrementalCost. Run sensitivity analysis on key inputs.
-
Stakeholder & risk mapping — a quick
`RACI`for delivery and a regulatory/credit-risk checklist (limits, disclosures, fraud vectors) before committing to experiments. -
Launch vs learn criteria — specify go/no-go thresholds with confidence levels (e.g., >95% CI on primary metric or acceptable cost per incremental customer).
-
Customer segmentation — split by behavior (active/inactive), credit tier, channel; design experiments to avoid Simpson’s paradox and measure heterogenous treatment effects.
-
Tradeoff framing — balance acquisition vs profitability, short-term lift vs long-term retention; explicitly call out cost of incentives and operational complexity.
-
Communication structure — open with one-sentence recommendation, support with 3–5 pillars (metrics, customer, execution, risks), end with two concrete next steps.
-
Data & instrumentation requirements — enumerate minimal signals required (event names, user join date, cohort key) — assume analysts can instrument but you must know what you need.
Worked example — “Increase new credit-card activation rate by 3% in 6 months”
First 30 seconds: clarify the metric (activation = first transaction or card signup?), baseline activation rate, target user cohort, and constraints (marketing budget, regulatory limits). Frame with a one-line objective and hypothesis: “Hypothesis: personalized sign-up incentives for high-propensity users will raise activation by 3% with acceptable CAC.” Structure your answer around 1) target segment identification, 2) intervention options (bonus points, instant credit, payment flexibility), 3) measurement plan (primary metric, MDE, sample size), and 4) operational & risk controls (fraud, credit checks, cost modelling). Quantify: sketch sample-size calc and back-of-envelope ROI using expected activation lift × lifetime value minus incentive cost. Flag a key tradeoff: broad incentive increases short-term activation but dilutes unit economics; targeted incentives reduce cost but need better propensity models. Close with next steps: run a small `A/B test` with 10k users in two tiers, instrument events, and pre-commit to go/no-go thresholds; if more time, refine targeting via cohort analysis and simulate longer-term retention impact.
A second angle — decrease fraud losses by 10% while preserving approval rate
Same framing skills apply but the constraints change: the primary metric is `fraud_loss_rate` (lagging) and a key guardrail is `approval_rate` (secondary). Start with clarifying tradeoffs and stakeholders (fraud ops, underwriting, legal). Decompose root causes: synthetic identities, account takeover, high-risk merchants. Propose a three-pillar approach: detection (better signals/score thresholds), prevention (blocking vectors), and remediation (chargeback handling). For each pillar, define measurement (precision/recall of rules; impact on approvals), experiments (rollback thresholds, monitoring windows), and rollback criteria to avoid customer friction. Emphasize short-term signal changes versus long-term investments in models — and always quantify the cost of a false positive in approvals versus cost saved from prevented fraud.
Common pitfalls
Pitfall: Over-indexing on features instead of the metric — proposing many shiny features without a clear hypothesis for how each moves the primary metric will lose interviewers. Always tie features to expected uplift and cost.
Pitfall: Neglecting segmentation and heterogeneity — giving an average lift without segment-level analysis can hide reversals (e.g., one segment benefits, another is harmed). Present per-cohort expectations.
Pitfall: Too much engineering detail — interviewers want prioritization, measurement, and risk mitigation, not implementation minutiae like schema migrations; keep implementation at a level that shows feasibility and constraints.
Connections
Interviewers commonly pivot from case framing to adjacent topics: experiment design and statistics (sample size, p-hacking), analytics (cohort vs aggregate reporting), and stakeholder-management scenarios (conflicted goals between growth and risk). Being fluent across these makes your framing credible.
Further reading
-
[Decode and Conquer by Lewis C. Lin] — practical frameworks for PM case interviews and structuring answers.
-
[Inspired by Marty Cagan] — product prioritization and how to think about product outcomes vs outputs.
Practice questions

Market Sizing And Estimation Cases
Focus areaFocus area — You said estimation makes you nervous and selected market sizing; practice structured assumptions, sanity checks, and verbal math.
What's being tested
Interviewers test your ability to structure an ambiguous, quantitative estimate into a defendable answer: scope definition, approximation technique selection (top‑down vs bottom‑up), transparent assumptions, sanity checks, and product-relevant implications (revenue, unit economics, prioritization). At Capital One they want to see you think like a PM — connect the estimate to customer segments, go‑to‑market, and measurable outcomes (`ARR`, `LTV`, `CAC`) rather than just arithmetic.
Core knowledge
-
Clarifying scope first: Always confirm geography, time horizon, customer segment, and product definition. A 1‑year US mobile banking TAM differs drastically from a global, all‑product TAM.
-
Two canonical approaches: Top‑down uses macro data (census, industry reports); bottom‑up builds from unit metrics (users × adoption × price). Use top‑down for speed, bottom‑up for actionable product decisions.
-
Fermi estimation: Break the problem into independent, easy-to-estimate factors and multiply: e.g., Population × Target segment % × Adoption % × Frequency × Price.
-
TAM / SAM / SOM distinction: TAM = total theoretical demand; SAM = served market given product constraints; SOM = realistic short‑term obtainable share. Use these to set investment and milestones.
-
Unit economics tie‑ins: Compute revenue and profitability from estimate: Revenue = Price × Quantity. Compute
`LTV`=`ARPU`/ churn_rate and compare to`CAC`to evaluate viability. -
Conversion funnels and levers: Translate adoption into product metrics: Awareness → Acquisition → Activation → Retention → Monetization. Use baseline conversion rates (e.g., 1–5% paid conversion for freemium consumer fintech; adjust by channel).
-
Sensitivity analysis: Present a simple low/likely/high scenario (e.g., ±50% on key assumptions) or a one‑way sensitivity table showing which assumptions most affect the answer.
-
Sanity checks: Compare to proxies: incumbent market revenue, number of relevant devices/users, or adjacent industry spend. If your estimate implies implausible per‑user spend, revisit assumptions.
-
Time/value and adoption curves: For multi‑year horizons, apply adoption curves (linear or S‑curve). Use simple geometric growth or logistic models only if you state assumptions.
-
Rounding and significant digits: Keep 1–2 significant digits for high‑uncertainty factors; don’t present false precision (avoid 7,324,211).
-
Data sources to mention:
`US Census`,`BLS`, industry reports (e.g., Forrester), app store download stats, and public filings — cite them as possible validation points, not exact numbers. -
Edge cases: Watch for double counting (same user across products), mismatched units (monthly vs yearly), and conflating users with accounts (one user may hold multiple accounts/cards).
Worked example — "Estimate the annual addressable market for a mobile banking app in the US"
First 30 seconds: clarify whether “addressable” means paying customers in year one or long‑term potential; confirm geography = US and horizon = 1 year. State approach: bottom‑up to produce an actionable plan and unit economics to judge go‑to‑market feasibility. Skeleton: (1) define target population (e.g., adults 18+ with smartphones), (2) estimate adoption funnel (awareness → download → active user → paid conversion), (3) apply monetization assumptions (monthly fee or interchange revenue), and (4) run sensitivity and sanity checks. Example pillars: Population (US adults ≈ 250M × smartphone penetration ≈ 85% → reachable base), target segment (%) (e.g., digitally‑native 25–44 = 30%), activation/retention (30% monthly active), and `ARPU` (10/month or interchange x transactions). A tradeoff to flag: bottom‑up gives realistic near-term `SOM`, but relies on many behavioral estimates — use macro top‑down as a cross‑check. Close by saying: if more time, I’d pull real app store and competitor revenue numbers, segment by channel, and run a time‑phased adoption curve to estimate `ARR` and required `CAC` to hit break‑even.
A second angle — estimating users for a new feature (e.g., in‑app budgeting tool)
Here the framing shifts from market revenue to feature adoption. Start by defining eligible users (existing active users who meet behavioral criteria, e.g., 60% transact monthly), then estimate eligibility × interest rate × feature conversion. Use survey or engagement proxy (e.g., feature click‑through, NPS) to estimate uptake. The same Fermi decomposition applies, but outputs are product metrics (`DAU`, retention uplift, feature adoption %) rather than dollar TAM. Focus the interviewer on how this affects product priorities: does the feature improve `LTV`, reduce churn, or increase activation? That determines if engineering/resource investment is justified.
Common pitfalls
Pitfall: Mixing time units and rates — eg. using monthly
`ARPU`with yearly adoption without converting units leads to 12× errors. Always align time bases and state them.
Pitfall: Over‑precision and hidden assumptions — presenting a single “exact” number without assumptions or ranges appears untrustworthy; always show the key levers and a low/likely/high band.
Pitfall: Answering arithmetic only — interviewers expect product judgement: explain which assumptions are high‑impact, what levers you’d pull (pricing, conversion, channel), and how the estimate informs go‑to‑market choices.
Connections
Estimations commonly pivot to adjacent areas: pricing strategy (how price affects TAM and conversion), cohort/unit‑economics analysis (turning users into revenue forecasts), and A/B test design (validating adoption assumptions through experiments).
Further reading
- a16z — The Right Way to Size Markets — practical frameworks and examples for TAM/SAM/SOM and investor expectations.
Practice questions
Data-Driven Product Decisions
Focus areaFocus area — You rated product decision-making 2/5 and selected metrics, analytics, prioritization, ambiguity, and stakeholder-heavy decision topics.
What's being tested
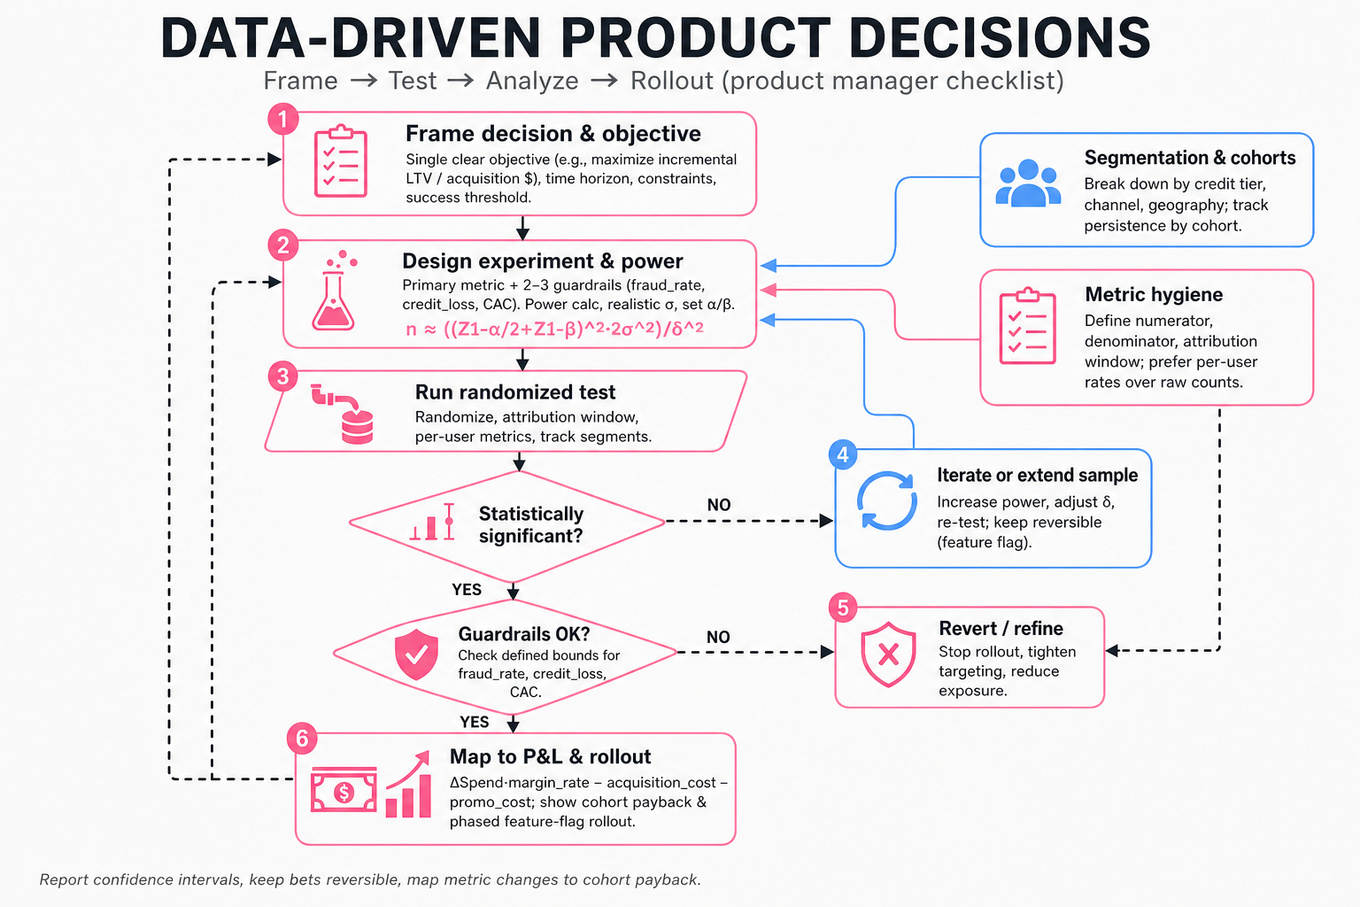
Interviewers are probing your ability to convert data into defensible product choices: framing decisions, selecting the primary metric, designing diagnostics and experiments, and balancing business upside versus risk. They want to see pragmatic statistical literacy (power, uncertainty, incremental impact), segmentation thinking, and stakeholder communication that keeps launches reversible and measurable. At Capital One, this demonstrates you can run acquisition/partnership pilots, promotions, or UX changes while protecting credit/risk and P&L guardrails.
Core knowledge
-
Decision framing: Start with a single clear objective (e.g., maximize incremental
LTVper acquisition dollar) and state the time horizon, constraints, and success threshold before analyzing data. -
Primary metric vs guardrails: Declare one primary metric (e.g., incremental sign-ups or net card spend) and 2–3 guardrails (
fraud_rate, credit-loss,CAC) that cannot degrade beyond defined bounds during tests or rollout. -
Incrementality & causality: Use randomized experiments or credible quasi-experiments to measure incrementality; observational lifts often conflate selection bias with treatment effect.
-
Experiment design basics: Power calculation (sample size) from desired detectable effect δ: — set α, β, and realistic σ based on historical variance.
-
Segmentation and cohorts: Always break down effects by key segments (credit tier, geography, acquisition channel); effects can mask countervailing trends in subgroups — use cohort analysis to track persistence.
-
Metric hygiene: Define metrics precisely (numerator, denominator, attribution window). Prefer per-user or per-customer metrics to avoid volume-driven artifacts (e.g., % of active cardholders vs raw transactions).
-
Uncertainty & reversibility: Report confidence intervals and expected range of outcomes; favor reversible bets (limited-time pilots, feature flags) when uncertainty is high or downside risk is non-linear.
-
P&L mechanics: Map metric changes to P&L: incremental margin = Δ(Spend)*margin_rate − acquisition_cost − promotional_cost; show payback period and cohort payback curves.
-
Tradeoff framing: Quantify short-term acquisition lift vs long-term credit loss or margin dilution; use simple NPV/IRR or cohort
payback = acquisition_cost / monthly_marginmodels to compare offers. -
Diagnostic plan: For any metric change, predefine diagnostics: funnel conversion, channel mix, new vs returning user rates, credit-risk signals, and anomalous logging. Diagnostics turn signal → root cause.
-
Data quality & confidence: Validate event definitions and completeness; if upstream data is noisy, surface that to stakeholders and delay definitive calls or widen confidence intervals.
Tip: Always present a back-of-envelope worst-case, base-case, best-case to show asymmetric risk and the value of guardrails.
Worked example — "How do you make data-driven decisions?"
First 30 seconds: ask clarifying questions — what decision are we making (launch/promo/tiering), the time horizon, constraints (regulatory, credit exposure), and what data sources exist. Frame the approach: (1) define a primary metric and guardrails, (2) choose analysis method (experiment vs observational), (3) plan diagnostics and success thresholds, (4) translate outcome to P&L and rollout plan. Organize answers around measurement, risk, segments, and operationalization. A strong candidate specifies experiment mechanics (randomization unit, sample size, test length) and pre-commits to analysis windows and multiplicity corrections if multiple metrics are tested. Flag a tradeoff: faster, broad rollouts accelerate growth but increase exposure to credit risk; prefer phased rollouts with risk-triggered cutoffs if downside is large. Close by outlining next steps: run a powered pilot, monitor diagnostics daily, and have an agreed rollback criterion; "if I had more time, I'd model long-term cohort economics and simulate credit-loss sensitivity."
A second angle — "Capital One Credit Card: Acquisition & Promotion Strategy"
Here the same data-driven scaffolding focuses on acquisition economics and channel optimization. Start by segmenting target customers by expected LTV and acquisition CAC. Define success as incremental net_margin_per_acquired_customer over a 12–36 month horizon; compute break-even using cohort payback. Design channel-specific pilots (paid search, affiliate, partnership) with consistent attribution windows; run randomized offers where possible to measure incremental signups rather than correlated volume. Emphasize strategic value (brand fit, incremental deposits) in addition to short-term ROI and include credit-safety guardrails (max approval rate by tier, expected charge-off). This framing shifts emphasis from product usage metrics to cohort P&L and credit-risk controls.
Common pitfalls
Pitfall: Confusing lift with volume. Measuring total sign-ups without a counterfactual can mistake seasonality or channel spend increases for product impact.
Quantitative mistake — over-interpreting underpowered tests. Running many underpowered experiments inflates false negatives and encourages chasing noise; always compute required sample size for a meaningful δ and report confidence intervals, not just p-values.
Communication mistake — hiding assumptions. Presenting a headline lift without disclosing attribution window, segment mix shifts, or data quality issues breaks trust. State assumptions, show diagnostics, and explicitly call out what would change your recommendation.
Depth mistake — ignoring long-run economics. Choosing a promotion solely on immediate sign-ups without modeling cohort-level LTV, churn, and credit-loss leads to toxic growth. Translate short-term metrics into multi-period P&L before approving large-scale rollouts.
Connections
Interviewers may pivot to experimentation infrastructure (how to implement randomized rollouts), risk/credit modeling (impact on loss rates), or partnership evaluation (incremental economics vs strategic benefits). Be ready to move from metric measurement to operational controls and legal/regulatory constraints.
Further reading
-
Running Controlled Experiments at Scale (Kohavi et al.) — practical guide to experimentation design and pitfalls.
-
Lean Analytics (Alistair Croll & Benjamin Yoskovitz) — frameworks for metric selection, experiments, and growth-stage decisions.
Credit Card Product Strategy
Focus areaFocus area — Capital One-specific and fintech-new for you; anchor cases in segments, rewards, acquisition, profitability, and risk trade-offs.

What's being tested
Interviewers probe your ability to design acquisition, promotion, and partnership strategies that balance unit economics, customer experience, and risk for a mid-tier rewards credit card. They want to see structured prioritization: target-segment selection, channel mix, funnel conversion targets, and quantified trade-offs (bonus size vs. payback). Capital One cares because small errors in assumptions scale to large losses or missed growth opportunities across millions of accounts.
Core knowledge
-
Customer Lifetime Value (LTV) — LTV = ∑_{t=0..T} (Gross margin_t − Rewards_t − Servicing_t − CreditLoss_t) / (1+ r)^t; use cohort horizons (24–60 months) for cards.
-
Customer Acquisition Cost (CAC) — CAC = (MarketingSpend + Fulfillment + BonusCostAllocated + AttributionOverhead) / NumberOfApprovedAccounts; compare to LTV and compute payback: PaybackMonths = CAC / MonthlyContribution.
-
Sign-up bonus ROI — Model bonus ROI as BonusCost / IncrementalSpendCaptured × (InterchangeMargin − RewardRate); assume incrementality (vs. cannibalization) and activation windows (30–90 days).
-
Incremental margin per customer — IncrementalMargin = Spend × InterchangeRate − Rewards − CreditLoss − Servicing; use merchant interchange % (e.g., 1.5–2.5%) and card-specific reward rates when modeling.
-
Funnel metrics & benchmarks — Track
Impression → AppStart → Submit → Approved → Activated → 3-mo Retained; use segment-level conversion assumptions (e.g., submit→approved 60–85% depending on cut). -
Channel economics — Paid search, affiliates, direct mail, digital display, partner co-brand have different
CAC, approval quality, and attribution windows; prioritize channels by CAC-to-LTV and supply-capacity constraints. -
Risk & underwriting guardrails — For acquisition pushes, define max accept rate, credit-score thresholds, and expected charge-off lift; use prospective stress (e.g., +50–200 bps delinquency) to set bonus caps.
-
Partnership valuation — For merchant deals, compute break-even customers = (DiscountPaid × ExpectedSpendingPerCard × MarginShare) / (IncrementalCardMargin); include strategic KPIs (brand lift, customer data).
-
Experimentation & pilots — Always pilot promotions with randomized holdouts or geo-splits; compute required N for key metrics (activation lift, incremental spend) and monitor upstream (application rate) and downstream (credit performance) signals.
-
Cannibalization & cohort-cross effects — Model cannibalization by estimating share of spend shifted from existing cards and cross-product migration; adjust incremental spend assumptions conservatively (e.g., 30–70% incremental).
-
Regulatory & operational constraints — Factor in disclosure/regulatory review cycles, fulfillment lead times, and operational capacity (call center, fraud ops); these can lengthen campaign ramp and increase costs.
-
Narrow KPIs to defend decisions — Choose 2–3 primary KPIs (e.g., Net New Active Accounts, 12-month Incremental Margin per Account, Payback Months) and supporting safety metrics (charge-off rate, bad-debt dollar).
Worked example — Capital One Credit Card: Acquisition & Promotion Strategy
First 30 seconds: ask clarifying questions — target geography, customer segment (mass-market vs. affluent), current funnel baselines (Impressions, AppStart, Submit, Approved, Activated), and approved channel CACs. Structure the answer around three pillars: segmentation, promotion mechanics & channel mix, and economics + guardrails. For segmentation, prioritize cohorts with high interchange and low expected credit loss (e.g., transactors with 12–18 months avg spend). For promotion mechanics, propose bonus size tied to achievable spend thresholds and an activation period to reduce fraud. For economics, show a simple P&L per cohort: CAC + Bonus + Fulfillment vs. expected incremental margin and compute payback months using . Flag the tradeoff explicitly: larger sign-up bonuses lift acquisition but may shorten payback and increase fraud/charge-offs, so cap based on maximum acceptable payback (e.g., 12 months) and real-time underwriting adjustments. Close by recommending a 90-day randomized pilot with pre-specified success thresholds and a post-pilot cohort analysis on 12-month incremental margin and credit performance; if more time, build a scenario Monte Carlo for delinquency sensitivity.
A second angle — Evaluate a Credit Card Partnership
A merchant partnership reframes acquisition as a revenue-share negotiation: quantify DiscountCost to merchant vs. IncrementalCardMargin for Capital One. Start by modeling customer-level economics: expected incremental transactions driven by merchant promotion, expected SpendPerCard at merchant, and discount paid per transaction. Determine break-even number of new accounts and churn-adjusted LTV uplift. Key constraints differ: merchant wants CPA-like guarantees or performance tiers; product focus shifts to tracking attribution windows, fraud prevention (promo abuse), and contractual protections (clawbacks). Recommend a small, timeboxed pilot that measures incremental card activations attributable to the merchant, with a sliding discount based on verified incremental spend.
Common pitfalls
Pitfall: Overstating incremental spend. A tempting mistake is treating all cardholder spend after acquisition as incremental. Always model cannibalization and baseline behavior; assume conservative incrementality unless you have causal A/B evidence.
Pitfall: Missing operational constraints. Presenting an aggressive campaign without considering underwriting capacity, fraud ops, or regulatory review undermines feasibility. State these constraints and how they change launch timelines and costs.
Pitfall: Not stating assumptions numerically. Saying “this will be profitable” without listing CAC, expected approval rate, activation, and churn loses credibility. Always show key assumptions and sensitivity ranges.
Connections
Interviewers may pivot to experimentation design (sample sizes, holdouts), credit risk management (loss forecasting, vintage analysis), or pricing strategy (rewards structure, interchange sensitivity). Be prepared to switch to metric-level analysis or operational rollout plans.
Further reading
-
[Customer-Based Corporate Valuation — Peter Fader] — rigorous framing for customer lifetime value and segmentation.
-
[A/B Testing by Kohavi et al.] — practical guidance on experimentation pitfalls and metrics selection.
Payments And Card Network Fundamentals
Focus areaFocus area — Fintech is new for you; understand issuer, acquirer, merchant, network, interchange, authorization, settlement, chargebacks, and rewards funding.
What's being tested
The interviewer is probing product-level mastery of how card payments move end-to-end, where customer experience and revenue leak vs. fraud tradeoffs live, and which levers a PM can pull. Expect to show you can diagnose declines, prioritize product fixes, and translate network/settlement constraints into measurable hypotheses and launch plans. Capital One cares because small percentage improvements in approval, latency, or chargebacks materially change net interchange revenue and customer satisfaction.
Core knowledge
-
Actors in the ecosystem: cardholder, merchant, acquirer, issuer, card network (e.g.
Visa,Mastercard); each actor has distinct incentives and SLAs affecting product decisions and partnership opportunities. -
Authorization vs. clearing vs. settlement: authorization is an instantaneous approve/decline (milliseconds → hold), clearing transmits transaction detail, settlement moves funds (netting, typically T+1 for cards). Product impact: authorizations affect conversion; settlement affects cashflow.
-
Typical message flow & constraints: authorization messages follow
ISO 8583-style flows; networks expect sub-1-second latency; retries, partial auths, and offline approvals change UX and fraud risk. -
Fee stack and economics: interchange (issuer fee), assessment, and merchant discount (MDR) determine per-transaction economics — interchange often ~1–3% depending on card/product; small basis-point changes scale with volume.
-
Authentication & tokenization: tokenization and
3DS2reduce fraud chargebacks but add friction/latency for checkout;PCI DSSapplies to card data scope — product choices change compliance scope and cost. -
Decline taxonomy: classify declines by issuer rule, network rule, AVS/CVV mismatch, expired card, insufficient funds, suspected fraud, or technical/numeric errors — this classification drives prioritized interventions.
-
Chargebacks & disputes: disputes impose merchant debit + reputational/operational costs; typical dispute windows can extend ~60–120 days depending on scheme; recurring chargebacks can affect pricing and take rates.
-
Settlement timing & funding: card funds are netted; merchant funding cadence (daily vs T+2) affects merchant cash flow products; compare
ACH(bank-to-bank) timing and reversal rules for alternatives. -
Key PM metrics & formulas: authorization rate = approvals / attempts; net revenue ≈ Σ(approved_amount * take_rate) − fraud_loss − chargeback_cost − operating_costs. Monitor
decline rate,false positive rate,chargeback rate, and latencyp95/p99. -
Interchange qualification & routing: transaction attributes (card-present vs e-commerce, network tokens, MCC, POS data) change interchange bin/qualification and fees, so UX changes (e.g., request more auth data) can change economics.
-
Edge behaviors: partial authorizations, authorization holds (pre-auths), reversals/voids, and offline EMV behavior create UX edge-cases; product flows must surface expected hold amounts and release timing.
Worked example — "Explain the end-to-end card payment flow (authorization, clearing, settlement) and where product can intervene"
Frame with clarifying questions first: Is this card-present or online? Which markets, volumes, and success metrics matter (conversion, fraud %, authorization latency)? Are we focusing on issuer-side product or merchant acquiring? A strong answer maps the 3-stage flow (cardholder → merchant → acquirer → network → issuer) with where holds and responses occur. Organize your response into: (1) technical steps and timing constraints, (2) user/merchant pain points (declines, slow checkout, unclear holds), and (3) product levers (UX: retry or clear messaging, risk: authentication or tokenization, commercial: interchange-qualification optimizations). Flag tradeoffs explicitly: enabling 3DS2 reduces fraud but raises drop-off and increases latency; merchant-initiated retries may improve approvals but risk duplicate charges without idempotency. Close with measurement and rollout: propose A/B tests for retry logic measuring net approval, fraud lift, and revenue per session; if more time, add issuer cohort analysis and issuer-specific decline diagnostics to target partnership remediation.
A second angle — "Prioritize features to reduce authorization declines while balancing fraud and revenue"
Reframe: this is a prioritization problem constrained by risk appetite and implementation lead times. Start with diagnostics: segment decline rate by merchant, card-issuing bank, MCC, and error code. Quick wins include smart retry (retry transient network errors), card-type-specific messaging, and in-checkout validation (AVS/CVV pre-check). Mid-term: implement tokenization and 3DS2 integration, route authorizations to alternate networks for better issuer behavior, and partner with high-decline issuers. Long-term: build issuer scorecards and real-time issuance rules. Explicitly call out guards: tie each experiment to an economic metric (net revenue per checkout) and cap fraud tolerance with a loss budget. Different merchant types (subscriptions vs single-purchase) require different tolerance for friction.
Common pitfalls
Pitfall: Focusing on overall decline rate without segmenting by merchant, card issuer, or error code leads to wasted effort; high-volume merchant declines matter disproportionately for revenue.
Pitfall: Promising to “eliminate declines” or “remove fraud” misunderstands tradeoffs; communicate expected delta, confidence, and guardrails instead.
Pitfall: Proposing routing or network-certification changes as fast fixes ignores long lead-times and cross-party dependencies; always include time-to-value and partner dependencies.
Connections
Adjacent interview pivots will likely include Fraud & Risk product (model thresholds, false positives), Merchant Acquiring (pricing, onboarding, settlement cadence), and Customer Billing & Disputes (chargeback workflows and remediation). Be ready to move from product levers to experiment design and KPI tradeoffs.
Further reading
-
[EMVCo specifications] — deep dive into chip card/EMV behaviors and offline approvals, useful for card-present product decisions.
-
[PCI DSS overview] — concise summary of compliance scope changes driven by tokenization decisions.
-
[Visa Developer docs] — practical examples of authorization/clearing messages and network behavior for product planning.
Practice questions
Focus area — Needed for Capital One acquisition cases and your selected marketplace, UX journey, and growth-strategy topics.
What's being tested
Interviewers probe your ability to turn customer signals into a prioritized acquisition and funnel plan that balances growth, economics, and risk. They want to see structured segmentation, clear funnel metrics, ROI-driven tradeoffs, and defensible guardrails specific to a credit-card product. At Capital One, expect emphasis on risk-adjusted profitability, measurable incrementality, and operational constraints like regulatory/compliance boundaries.
Core knowledge
-
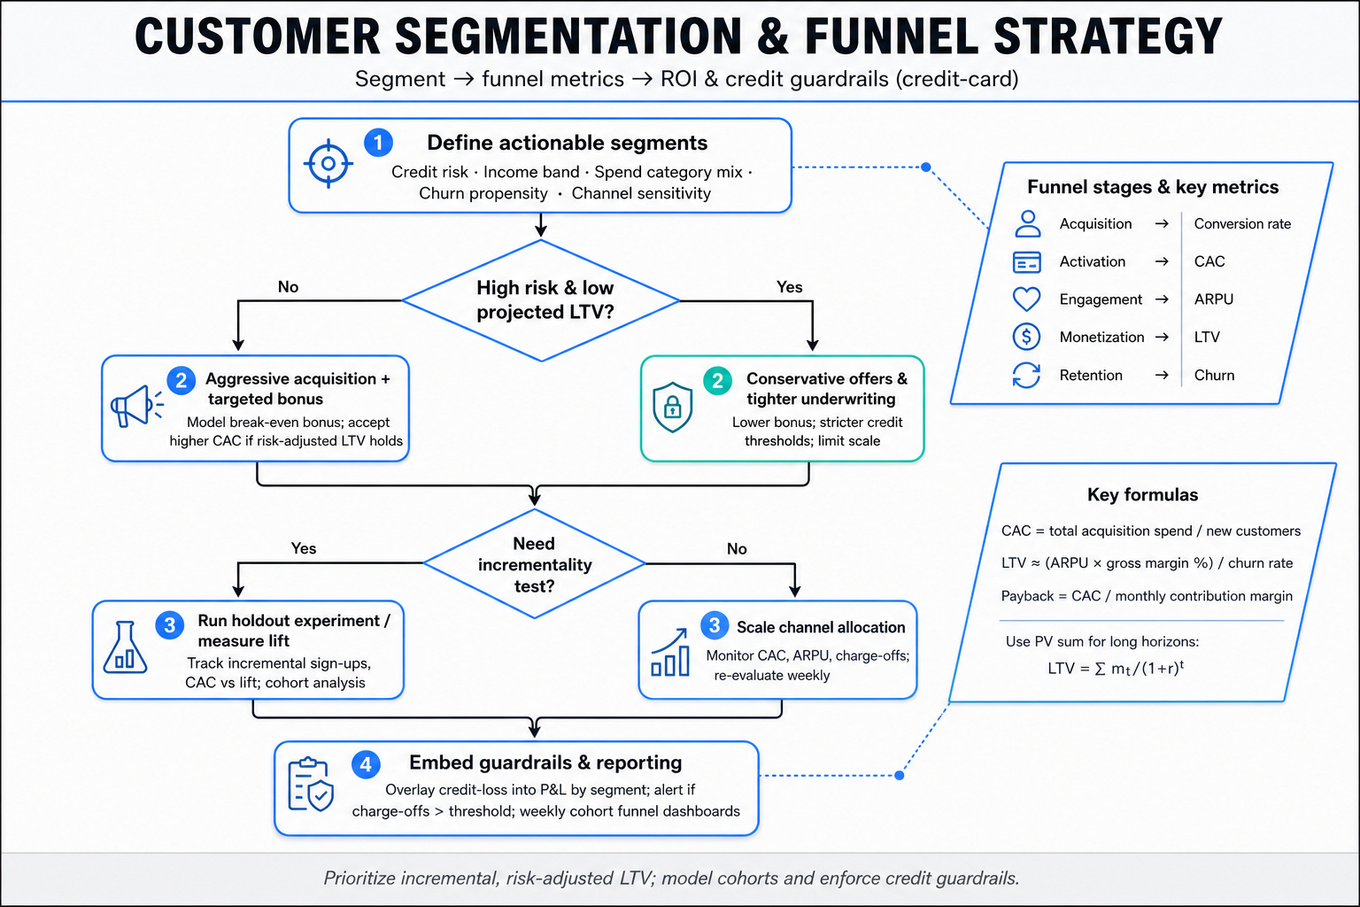
Customer Segmentation: segment by observable behaviors and value drivers — credit risk, income band, spend category mix, churn propensity, and acquisition channel sensitivity; segments must be actionable (i.e., map to different offers or channels).
-
Funnel stages & metrics: define Acquisition → Activation → Engagement → Monetization → Retention; key metrics: Conversion rate at each stage,
CAC,ARPU,LTV, and churn; instrument stage-level attribution for diagnosis. -
Economics formulas:
CAC= total acquisition spend / new customers;LTV≈ (ARPU× gross margin %) / churn rate. Payback period =CAC/ monthly contribution margin. Use present-value for long horizons: where is contribution margin, is discount rate. -
Incrementality vs. correlation: prioritize incremental sign-ups (causal lift) not raw attribution; recommend experiments or holdout groups for high-spend channels or partnerships to measure lift.
-
Promotion mechanics & tradeoffs: sign-up bonus increases short-term acquisition (lowers apparent
CAC) but may attract low-LTVcustomers; model cohorts to estimate break-even bonus size and dilution of long-term margin. -
Risk & credit guardrails: overlay credit-loss modelling into P&L per segment; express maximum acceptable charge-offs as a percent of revenue and translate into conservative underwriting thresholds for acquisition efforts.
-
Channel strategy mapping: map segments to channels by Cost-per-Lead and targeting fidelity — e.g., search/social for intent-rich prospects, partnerships/affiliates for niche segments; weigh scale vs. targeting precision.
-
Cohort analysis & retention levers: use
SQL/Lookercohort funnels to track early activation signals predictive ofLTV(e.g., first 30-day spend, category adoption); prioritize features/offers that move cohorts into higher-LTVbehaviors. -
Experimentation & measurement plan: propose A/B or geo-holdout tests with pre-specified primary metric (incremental funded accounts) and guard against seasonal confounders; ensure sample size and test duration are powered to detect business-significant lifts.
-
P&L & unit economics view: model per-segment unit economics (gross margin per account, expected default costs, amortized acquisition expense), and report simple break-even table by cohort/year.
-
Privacy & data constraints: account for
PII/consent limits and partner data-sharing constraints when planning targeting; prefer deterministic signals when available, fallback to aggregated segment-level analysis otherwise. -
Operational constraints: include onboarding friction (KYC/ID checks), regulatory time-to-decision, and fraud filters — these change funnel conversion rates materially and vary by segment.
Worked example — Capital One Credit Card: Acquisition & Promotion Strategy
First 30 seconds: ask clarifying questions — target market (mid-tier rewards), growth vs. profitability priority, current baseline funnel metrics, and any regulatory or partnership constraints. Frame answer around three pillars: (1) segmentation (who to target first), (2) channel & promotion design (which offers and channels per segment), and (3) measurement & guardrails (how to prove incremental value and limit credit losses). For segmentation, propose 3–4 segments (e.g., existing-credit customers with high spend, new-to-credit young professionals, rewards-seekers with moderate credit) and prioritize by expected LTV and ease of acquisition. For promotions, present a small-bonus/high-targeting approach for high-LTV cohorts and a larger-bonus/test for risk-tolerant channels, showing break-even math: model CAC vs. 12–24 month LTV and compute payback. Call out one explicit tradeoff: larger sign-up bonuses increase short-run conversion but reduce selection quality — propose a pilot with holdout control to measure incremental spend in first 90 days. Close: if given more time, say you'd build a 12-week pilot with sample-size calculations, partner-level attribution tests, and a plan to feed early activation signals into a dynamic offer engine.
A second angle — Evaluate a Credit Card Partnership
With a merchant partnership, the framing shifts to shared economics and attribution. Start by segmenting existing cardholders and potential incremental prospects by merchant affinity and incremental spend probability. Key pillars: partner cost (merchant discounting), segment-level incremental margin (net of interchange and fees), and strategic value (category growth, cross-sell potential). Design a pilot that uses a matched holdout to measure true lift from the partnership, report expected break-even number of purchases per acquired cardholder, and set time-boxed success criteria. Constraints differ: data-sharing limits, co-marketing reach, and merchant-level fraud/chargeback risk — require tighter guardrails and a shorter test horizon.
Common pitfalls
Pitfall: Focusing on headline acquisition volume instead of incremental funded accounts — you’ll over-invest in channels that cannibalize existing demand. Always ask for a control to measure lift.
Pitfall: Presenting
CACwithout integrating credit loss or churn — the unit economics will look deceptively positive. Always showCACvs. risk-adjustedLTVand payback.
Pitfall: Over-segmentation into too many micro-cohorts with no actionability — prefer a small set (3–6) of operationally distinct segments you can target and measure within the experiment window.
Connections
Interviewers may pivot to adjacent topics: A/B testing & experimentation design (sample sizing, click-through vs. downstream lift), pricing & rewards design (bonus sizing and breakage), or risk/fraud (how underwriting and limits change acquisition strategy). Be prepared to move between segmentation, measurement, and risk in the same conversation.
Further reading
-
Trustworthy Online Controlled Experiments: A Practical Guide to A/B Testing — practical experiment design/analysis for incremental measurement.
-
Lean Analytics — practical frameworks for metrics-driven product decisions and cohort thinking.
Practice questions
Experimentation And A/B Testing
Focus areaFocus area — You explicitly selected A/B testing and metric design; focus on hypotheses, guardrails, segmentation, and rollout calls.
What's being tested
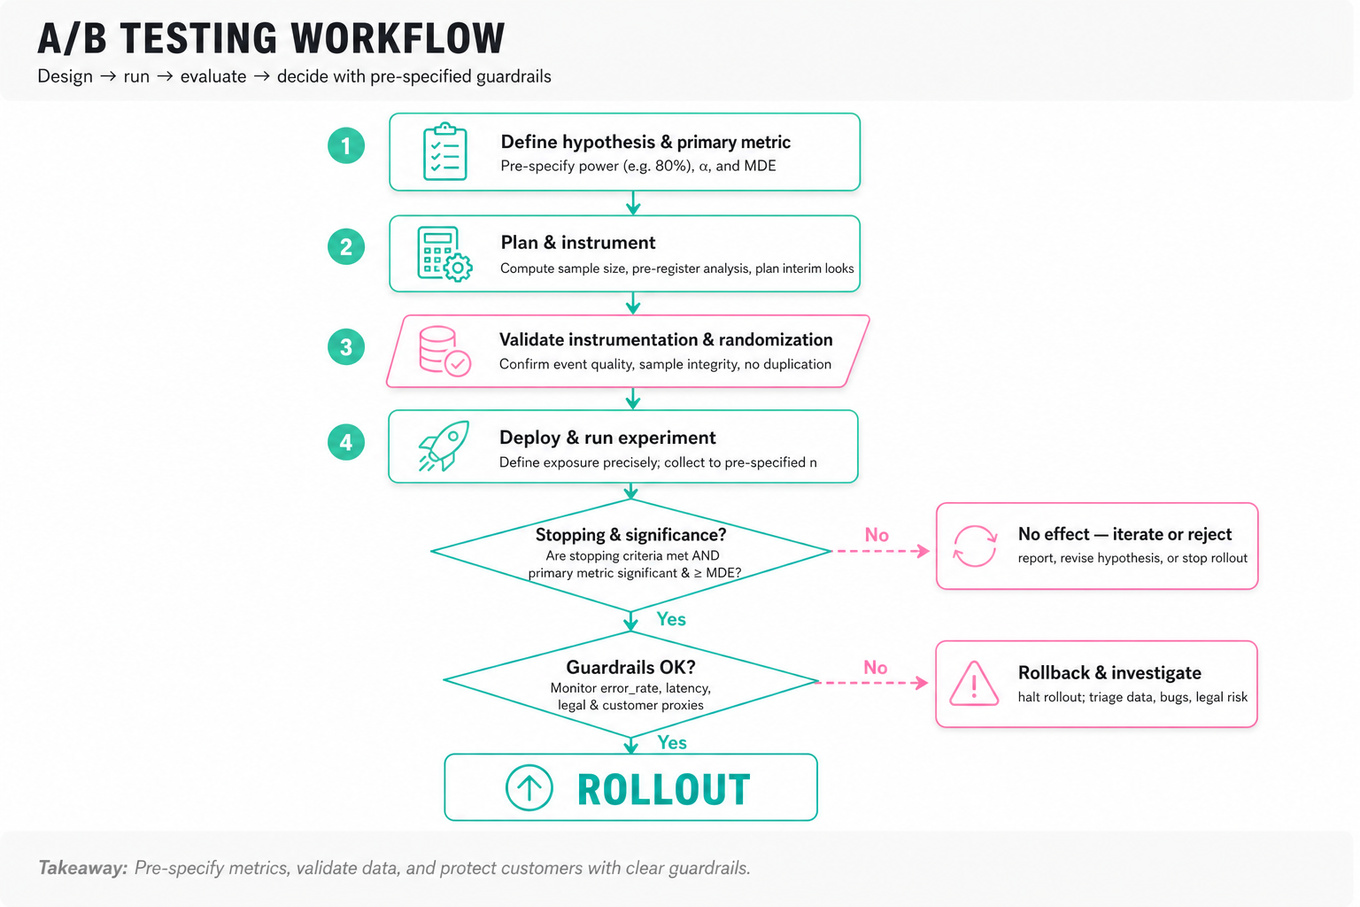
Interviewers are probing your practical command of experimentation as a product lever: how you frame decisions, pick and defend metrics, design (and stop) tests responsibly, and translate results into rollout decisions. Capital One cares because experiments are the core way PMs trade off revenue, risk, and customer experience while keeping regulatory and trust constraints in mind. Expect them to evaluate your ability to balance statistical reasoning, product tradeoffs, stakeholder communication, and operational guardrails.
Core knowledge
-
A/B test basics: randomize users into treatment/control, define exposure precisely, and measure the average treatment effect (ATE) on your primary metric with pre-specified analysis.
-
Primary metric selection: choose one metric that directly ties to the business decision (e.g.,
conversion_rate,ARPU,churn_rate); tie secondary metrics and guardrails to safety, legal, or latency concerns. -
Minimum Detectable Effect (MDE) and sample sizing: compute sample size from desired power and alpha using where is MDE and is metric SD.
-
Power (1−β) and Type I error (α) tradeoffs: common PM defaults are power = 80% and α = 5%, but lower α may be required for high-risk launches (financial, legal).
-
Sequential testing & peeking: ad-hoc interim looks inflate false positives; use pre-registration, alpha-spending or proper sequential frameworks, or adopt Bayesian methods and state them up-front.
-
Guardrails and SLA metrics: simultaneously monitor error_rate, latency, and customer experience proxies (e.g., NPS, retention) for rollback criteria and business safety—predefine alert thresholds.
-
Heterogeneous treatment effects (HTE) and segmentation: pre-specify segment analyses (by device, cohort, geography) to avoid post-hoc fishing; control for multiple comparisons using Bonferroni or FDR when needed.
-
Instrumention & data quality: validate randomization, sample integrity, event loss, and duplication; a PM should own the question "Can we trust
conversionevents inSnowflake/Looker/Amplitude?" before deciding. -
SUTVA / interference: watch for spillovers (social features, referrals) that violate independent assignment; prefer cluster-randomization when users influence each other.
-
Short-term vs long-term effects: measure immediate metrics and plan for long-horizon tracking (lifetime value, retention) using holdouts or longitudinal experiments to detect transient novelty effects.
-
Reversibility & rollout strategy: always decide if a change is reversible; use staged rollouts (e.g., 1% → 10% → 50%) with objective stop criteria, and consider a permanent holdout for long-term impact estimation.
-
Communication & decision framing: pre-specify success criteria, write a clear experiment brief, and communicate uncertainty with confidence intervals and practical impact (e.g., "this increases weekly spend by 0.30 per user").
Worked example — How do you make data-driven decisions?
First 30s: clarify the decision (e.g., launch feature X globally?), the audience (ops/finance), and the time horizon (short-term conversions vs long-term retention). Skeleton answer pillars: (1) define the primary metric and its business-alignment, (2) decide experiment vs observational approach and compute MDE/sample size, (3) enumerate diagnostics and guardrails to detect regressions, (4) plan segmentation and rollout, (5) define communication and stop rules. Flag a tradeoff: picking a single primary metric simplifies hypothesis testing but can miss important side effects—so pick one primary plus explicit guardrails. Close by stating next steps: run a pilot with instrumentation checks, preregister analysis, run to required power, then ramp if safe; add “if I had more time, I’d set up a 90-day holdout to measure retention and LTV.”
A second angle — Improve Capital One Shopping
Here the experimentation frame shifts to commercial partnerships and long-term value. Treat merchant payouts and coupon availability as business constraints: define both user-centric metrics (conversion, coupon-usage trust) and revenue/cost-weighted metrics (net take-rate, partner lifetime value). Email A/B tests require lifecycle-aware metrics (open → click → purchase), and personalization tests need offline slices to avoid heavy multiple-testing penalties. Tradeoffs include short-term revenue vs user trust (over-personalization reduces coupon diversity), and regulatory constraints around disclosures. Pre-specify tests on a per-partner basis to avoid biased monetization results.
Common pitfalls
Pitfall: Picking many "interesting" metrics as primaries. Multiple primary metrics creates ambiguous success criteria and inflates false positives; pick one business-aligned primary and pre-declare secondaries.
Pitfall: Peeking and stopping when the result looks good. Running unplanned interim analyses without correction leads to false discoveries; always pre-register stopping rules or use proper sequential methods.
Pitfall: Ignoring instrumentation drift and exposure definition. Trusting events before verifying randomization, event completeness, and user-scope leads to garbage conclusions—run A/A tests and data QA first.
Connections
Interviewers often pivot to adjacent topics: product prioritization (how experiments inform roadmap tradeoffs), causal inference (when experiments aren't possible), or analytics instrumentation (ensuring events and cohort definitions are reliable). Be ready to discuss tradeoffs between experimentation and observational analyses.
Further reading
-
Kohavi et al., “Online Controlled Experiments at Large Scale” (MSR) — practical engineering and statistical lessons from large-scale experimentation.
-
Evan Miller, “A/B Testing” guide — concise tutorial on statistics, power, and pitfalls for practitioners.
Practice questions
Practical Analytics And SQL Fluency
Focus areaFocus area — You selected metric design and analytics instrumentation; Capital One PM interviews reward practical data reasoning even without deep coding.
What's being tested
Demonstrates practical SQL metric translation: turn a product question into correct, auditable queries that answer “who,” “when,” and “how much.” Interviewers check clarity on deduplication, time-windowing, cohort/funnel logic, and sensible performance tradeoffs for large tables.
Patterns & templates
-
Last-event-per-entity using
ROW_NUMBER() OVER (PARTITION BY user_id ORDER BY ts DESC)to dedupe; filterrow_num = 1; watch ties. -
Session / funnel counts: event-level
COUNT(*)thenCOUNT(DISTINCT user_id)per step; useCASE WHEN+GROUP BYfor step conversion rates. -
Rolling/lag analysis with
LAG(col) OVER (PARTITION BY user_id ORDER BY ts)to compute time-between-events or churn triggers. -
Time bucketing via
DATE_TRUNC('day', ts)orTIMESTAMP_TRUNCforDAU/WAU/MAU; be explicit about timezone conversion. -
Cohort retention: cohort by
MIN(event_date), thenLEFT JOINback on users to compute week N retention; prefer CTEs (WITH) for readability. -
**Avoid SELECT *** on wide tables; filter early with indexed predicates and limit scan range (
WHERE ts BETWEEN), or sample (TABLESAMPLE) for prototyping. -
Use
COUNT(DISTINCT ...)sparingly — it's correct but expensive at scale; consider approximate functions (APPROX_COUNT_DISTINCT) if acceptable.
Common pitfalls
Pitfall: Double-counting by grouping on event_id instead of user_id leads to inflated engagement metrics; always validate numerator/denominator entity alignment.
Pitfall: Using local timestamps without normalizing causes off-by-one-day cohort errors across timezones; declare and apply a canonical timezone.
Focus area — You called out weak technical fundamentals; cover APIs, databases, services, latency, reliability, integrations, and basic architecture vocabulary.
What's being tested
Interviewers are probing your ability to translate technical signals into product decisions: diagnosing metric regressions, prioritizing engineering tradeoffs, and communicating clearly with engineers and stakeholders. They expect you to own metric framing, hypothesis-driven investigation, and launch/rollback decisions without designing implementation details. Capital One cares because PMs must make risk-balanced product calls that protect customer experience and business metrics while enabling velocity.
Core knowledge
-
Key product metrics: Know activation, retention, conversion rate,
`DAU`,`MAU`, and NPS definitions and how upstream changes affect them; express deltas as percent change: . -
Signal vs. source: Treat analytics platforms (
`BigQuery`,`Snowflake`) and event streams (`Kafka`) as signal sources you query, not things you architect; validate schema, event timestamps, and duplicate events before trusting numbers. -
Observability primitives: Understand logs, metrics, and traces;
`Prometheus`-style metrics for throughput/latency, and tracing to map user request paths; correlate a metric drop to traces/latency spikes. -
Latency and tail metrics: Use p50/p95/p99 to capture central and tail performance; a small p99 increase can disproportionately harm user-facing experiences even when p50 is stable.
-
Error budgets (SLI/SLO/SLA): Know the concept of an SLI (e.g., success rate), SLO (target), and error budget for release risk decisions; if error budget exhausted, favor mitigation.
-
Feature flags & rollback: Expect engineers to use feature flags for dark launches and quick rollback; ask whether the new code path can be toggled per region or user cohort.
-
A/B testing basics: Understand hypothesis, treatment vs. control, power, significance, and common mismatches (peeking, multiple comparisons). For conversion metrics, sample sizes grow with smaller effect sizes; approximate z-test for proportions.
-
Root-cause investigation framework: Follow data → system → user flow. Break down by dimension (platform, region, cohort, browser) and pivot on upstream event counts, downstream processing, and UX flows.
-
Prioritization tradeoffs: Balance customer impact, engineering effort, and business value (e.g., RICE). Quantify expected benefit (revenue lift or retention) vs. cost and risk.
-
Communication with engineers: Ask concrete questions: can we toggle the change? Is there rollout plan, dashboards, and alerts? What are rollback criteria and expected mitigation time?
-
Data integrity checks: Verify event counts, missing keys, late-arriving events, and timezones; simple sanity checks often find instrumentation bugs before deeper system faults.
-
Decision heuristics: Use guardrails: severe customer-visible regressions merit immediate rollback; small metric noise may warrant a scoped investigation and a staged rollout.
Worked example — "DAU drops 10% after a release"
Start by clarifying scope: confirm the timeframe, affected cohorts (global/all users), and whether the drop is absolute or relative by segment. Frame the investigation pillars: 1) validate metric integrity (missing events, instrumentation), 2) triage system health (errors, latency, deployments), 3) analyze user cohorts/dimensions (platform, region, segments), and 4) decide containment (rollback, kill-switch, scoped mitigation). Immediately ask whether a feature flag exists and if a rollback is feasible within the error budget/SLO context. Pull quick charts: event count trends, p99 latency, and error rate by service; split `DAU` by client version and geography to surface correlated changes. Flag one explicit tradeoff: rolling back avoids potential revenue loss but forfeits diagnostics that require the failing code in production; consider darkening the feature for a small cohort first if rollback is disruptive. Close by proposing an action plan (quick rollback if instrumentation or safety checks fail; otherwise restrict to affected cohort, add instrumentation hooks) and note next steps: full root-cause post-mortem and retrospective on release process.
A second angle — "Engineers say a feature will increase p99 latency; should we ship?"
This reframes the same skillset toward proactive tradeoffs: quantify user impact by connecting latency increase to conversion/abandonment curves (e.g., conversion drops X% per 100ms). Ask for empirical estimates or historical sensitivity; request a canary rollout with a feature flag and a dedicated observability dashboard. Decide using a cost-benefit matrix: estimated revenue impact vs. engineering effort for optimization. If the p99 increase affects a small backend batch job with no customer-facing latency, shipping may be acceptable; if it affects checkout p99, require mitigation or phased rollout with strict SLOs and an error budget check.
Common pitfalls
Pitfall: Treating a metric drop as purely technical.
Many candidates jump to system fixes; first validate the metric and examine product-side causes (UI changes, experiments, marketing shifts). Always prove the signal before demanding engineering changes.
Pitfall: Over-prescribing implementation.
PMs shouldn't design server architectures or choose database partitions. Saying "add a cache layer" without user-impact justification or rollback strategy loses points. Focus on scope, risk, and decision criteria.
Pitfall: Poor stakeholder communication.
Failing to state assumptions (which cohorts are affected, rollback feasibility, business tolerance) leads to misaligned decisions. Present a clear, prioritized action plan with tradeoffs and expected timelines.
Connections
Interviewers may pivot to experimentation (A/B test design and power calculations), data quality (schema drift, late events), or reliability engineering (SLOs and incident response workflows). Being fluent in these adjacent areas helps you steer technical conversations without overstepping.
Further reading
-
Metric Driven Development (blog posts collection) — practical patterns for metric hygiene and dashboards.
-
“Accelerate” by Nicole Forsgren et al. — links delivery performance, observability, and business outcomes; helps frame tradeoffs between speed and stability.
Practice questions
ML/Data Pipelines For Product Managers
Focus areaFocus area — You selected ML data pipelines; learn inputs, labels, model outputs, monitoring, bias, drift, and data-quality risks at PM depth.
What's being tested
Interviewers probe your ability to translate business goals into measurable, reliable ML-enabled products while owning tradeoffs between product value, data quality, and operational risk. Expect to demonstrate how you prioritize instrumentation, define success metrics (and guardrails), interpret model/evidence signals, and decide launch vs. iterate. Capital One cares because ML decisions touching customer accounts demand correctness, traceability, and clear product impact.
Core knowledge
-
Data pipeline (PM view): the end-to-end flow from user event → storage → features → model predictions → product action; you own the product requirements for each stage, not low-level plumbing.
-
Instrumentation: log the minimal immutable identifiers (user id, event id, timestamp) and contextual attributes; missing or inconsistent instrumentation is the #1 reason models fail in production.
-
Data quality signals: monitor completeness, latency, schema drift, and label skew; set channel-specific alerts (e.g., >5% missing labels in a day) and define remediation SLAs.
-
Feature freshness & staleness: quantify acceptable staleness for the product (e.g., near-real-time for fraud, daily for recommendations) and translate to user-impact metrics (e.g., increased false positives).
-
Evaluation metrics (product-forward): choose business-aligned metrics — precision, recall, false positive rate, lift on
conversion_rateorrevenue. Always map model metrics to downstream product KPIs. -
Experiment design basics: understand A/B testing assumptions, statistical power and sample-size calculation (approximate): and the impact of novelty effects and seasonality on run-length.
-
Guardrails and SLIs/SLOs: define Service Level Indicators like prediction latency (
p99), rollback thresholds for error rate, and product guardrails (e.g., max allowable false positive rate to avoid customer harm). -
Model drift and monitoring: track input distribution shifts (population features), label distribution changes, and business-metric decay; decide thresholds that trigger retraining, investigation, or rollback.
-
Prioritization framework: estimate expected value = (delta KPI * affected population * conversion) − cost/risk; use effort-to-impact tradeoffs when choosing between data fixes, model tweaks, or UX changes.
-
Data provenance & lineage: require teams to provide source datasets, collection logic, filtering, and transformation notes; this supports root-cause when KPIs move.
-
Privacy & compliance constraints: know whether features are PII, require consent, or have retention limits; these constraints often rule out otherwise-high signal features.
-
Release strategies: prefer staged rollouts (canary, % ramp) with automated rollback triggers, and tie each stage to specific monitoring dashboards and business KPI checks.
Worked example — "Design a reliable data pipeline to support an ML-based personalization feature"
First 30 seconds: clarify the business goal (what conversion or experience improves), target population, allowable latency, and privacy constraints. Ask whether personalization is real-time, session-based, or batched, and which downstream KPI (e.g., CTR or revenue per user) defines success. Organize your answer around three pillars: (1) Signal & instrumentation (which events/labels are needed, sampling scheme); (2) Evaluation & experiment plan (offline validation, A/B test design, metrics and sample-size); (3) Operationalization & monitoring (SLIs, rollout ramp, rollback criteria). Explicit tradeoff: choose between richer features that need new instrumentation (longer lead time, higher accuracy) versus deploying a simpler model today with fast user learnings. Close by stating next steps: prototype offline with historical data, run a small live canary with close monitoring, and schedule a post-launch analysis window; if more time, you'd model counterfactuals and plan data-contracts for producers.
A second angle — "How to prioritize fixing poor model performance: model changes vs data fixes vs UX"
Framing shifts from building to triage: start by decomposing failure modes into data (bad labels, drift), model (overfit, poor generalization), and UX (misleading presentation of predictions). The same core concepts apply: measure impact on business KPIs, instrument root-cause metrics (feature distributions, label quality), and estimate fix timelines. For example, a short-term UX tweak (softening confidence display) may reduce harm quickly while you pursue a longer-term data-contract and retrain. Emphasize incremental mitigations with monitored rollouts and pre-defined threshold-based escalations.
Common pitfalls
Pitfall: Treating ML as a purely technical problem — PMs who focus only on model accuracy ignore downstream UX and business impact; always translate model changes into KPI hypotheses.
Pitfall: Over-indexing on offline metrics like AUC without mapping to product outcomes — AUC gains can be irrelevant or harmful if they worsen calibration or increase false positives in production.
Pitfall: Asking engineering teams for immediate system rewrites to get "perfect" data — better to prioritize minimal viable instrumentation and quick experiments that prove value before heavy infra investments.
Connections
Interviewers may pivot to experimentation design (sample ratios, SUTs, sequential testing) or compliance/privacy (GDPR, data retention, de-identification). They may also ask about collaboration with data engineering and MLE teams—expect to state requirements and constraints, not implementation details.
Further reading
-
Designing Data-Driven Products — by Martin Kleppmann (notes) — practical thinking about data-driven system requirements and tradeoffs.
-
Practical Guide to A/B Testing — Evan Miller — concise primer on experiment statistics and pitfalls.
Build Vs Buy And Partnership Evaluation
Focus areaFocus area — You explicitly selected build-vs-buy; Capital One cases may test vendor, partner, integration, speed, and control trade-offs.

What's being tested
Interviewers are probing your ability to make a structured, business-focused decision under uncertainty: quantify segment-level economics, weigh strategic value vs short-term profit, and design a pilot to validate assumptions. They want a PM who can break a partnership/build decision into clear financial levers, identify key risks (measurement, cannibalization, ops), and recommend a path with explicit assumptions and sensitivity. Capital One cares because these decisions affect card economics, customer acquisition, brand risk, and long-term cross-sell potential.
Core knowledge
-
Incremental contribution per customer — compute as: incremental revenue (e.g., interchange + fees + interest) minus discount/cost to partner and servicing costs; express per month/year and per cohort for
LTVmath. -
Customer Lifetime Value (
LTV) — model cohort retention and margin: wherem_tis per-period margin andris discount rate; use to compare against acquisition cost. -
Customer Acquisition Cost (
CAC) — include marketing, partner-funded discounts, and front-loaded incentives; compareCACto discountedLTVto judge payback and ROI. -
Break-even customer calculation — required incremental customers = Required incremental profit / per-customer contribution; show sensitivity to adoption rate and cannibalization.
-
Fixed vs variable costs — separate up-front integration and platform build (fixed) from per-transaction discount or license fees (variable). Fixed costs amortize across expected customers; show scenarios for small vs large scale.
-
Adoption-adjusted profitability — multiply raw per-customer profit by adoption probability and onboarding friction; low adoption can turn an attractive unit economics model negative.
-
Strategic value factors — capture of first-party data, exclusivity, retention uplift, cross-sell potential, and competitive positioning; quantify where possible (e.g., retention delta → incremental
LTV). -
Cannibalization & attribution — model cannibalization as displaced revenue/margin from existing channels; use cohort comparisons and holdout groups to estimate.
-
Pilot & measurement design — require a randomized
A/B testor geographic holdout, pre-specified primary metric, guardrail metrics (fraud, chargebacks), and a minimum detectable effect calculation to size sample and duration. -
Time-to-market and vendor risk — trade speed (buy) vs control/cost (build); assess vendor lock-in, upgrade cadence, SLAs, data access, and compliance burden as operational risks.
-
Decision metrics & thresholds — prefer presenting a small set: NPV/IRR at a chosen discount rate, payback months, and sensitivity band for ±20–50% adoption or margin shocks.
-
Governance & exit criteria — define success thresholds and an experiment timeline; include stop conditions for poor performance or operational issues.
Worked example — Evaluate a Credit Card Partnership
First 30 seconds: ask clarifying questions — what is the discount rate the merchant expects, expected incremental spend per new cardholder, segmentation (acquirable customer types), estimated cannibalization, and legal/data-sharing limits. Skeleton: (1) Build a segment-level P&L (acquisition, discount, incremental card margin, servicing); (2) Quantify strategic uplift (retention, cross-sell) in LTV terms; (3) Assess operational feasibility and vendor integration cost; (4) Design a pilot to measure real uplift and cannibalization. Explicit tradeoff to call out: a deeper merchant-funded discount increases adoption but shrinks per-customer margin and may encourage higher-risk behaviors (fraud/chargebacks). For break-even, compute required incremental customers = Fixed cost amortization + target incremental profit divided by per-customer contribution, then show sensitivity to adoption rate. Close by recommending a 3–6 month randomized pilot with pre-registered primary metric (net incremental card profit per cohort), guardrails, and a decision matrix: scale if NPV positive at base case and robust across downside scenarios. If more time: build a cohort-level financial model, run scenarios (best/likely/worst), and consult legal/compliance on data sharing.
A second angle — Recommend Build vs Buy for Restaurants
Restaurants are low-ARPU, high-heterogeneity customers with strong sensitivity to speed and simplicity. Frame the problem around adoption-adjusted ARPU: a bought solution gives rapid distribution and possible marketplace traffic, increasing adoption; building allows higher margin and customization but requires sales/implementation cost per restaurant. Key pillars: per-merchant unit economics (monthly fee or take-rate), upfront onboarding cost, expected adoption % of target market, churn/retention rates, and integration with reservation networks (3rd-party distribution vs native). Here, strategic value shifts: network effects and aggregator distribution can substitute for marketing spend, so buying a partner with distribution can be worth lower per-customer margin. Pilot design should measure activation time, retention, and incremental sales attributable to the product rather than overall footfall.
Common pitfalls
Pitfall: Ignoring cannibalization.
Treating all incremental card spend as new is tempting; failing to model displaced spend from other cards or channels overstates benefit. Always estimate a cannibalization rate and fold it into per-customer contribution.
Pitfall: Presenting a single-point forecast.
A point estimate without sensitivity analysis fails interviews; provide base, best, and downside cases, and show how the recommendation changes across realistic adoption and margin bands.
Pitfall: Skipping measurement rigor.
Recommending a partnership rollout without pre-defined metrics, control groups, or sample-size logic makes post-launch learning impossible. Define primary metric, guardrails, MDE, and time horizon up front.
Connections
This area often leads to pivots into pricing strategy (how to structure merchant discounts or take-rates), experimentation & analytics (power calculations, attribution), and partnership/ops (contracts, SLAs, data flows, and compliance). Expect follow-ups that zero in on measurement plans or contract terms.
Technical Tradeoffs And Pilot Execution
Focus areaFocus area — You flagged non-tech background, weak fundamentals, execution, stakeholders, and system design; focus on pilots and feasible rollouts.
What's being tested
Interviewers are probing your ability to weigh technical and product tradeoffs and run a low-risk, learning-oriented pilot that answers business questions. They want to see metric-first thinking — how you pick a primary metric, define guardrails, design rollouts/experiments, and make reversible decisions with stakeholders. At Capital One this maps to balancing customer value, compliance/risk exposure, and measurable financial impact while keeping engineering and ops in their lanes.
Core knowledge
-
Primary metric (North Star) — choose one measurable metric (e.g.,
conversion_rate, revenue per user) that directly ties to the decision; every pilot should optimize this and report it first. -
Guardrail metrics — always pair primary metric with safety signals (
complaint_rate,fraud_rate,churn) to detect negative externalities fast. -
Pilot types — be fluent in feature-flag soft launches, targeted cohorts, partner pilots, and A/B experiments; pick based on risk, reversibility, and learnings required.
-
Segmentation & heterogeneity — pre-specify segments (e.g., by risk band, revenue tier) because average effects can hide opposite effects in subgroups.
-
Sample size & power — estimate sample size with the standard formula: where Δ is minimum detectable effect; trade off MDE vs time-to-insight.
-
Run-length & seasonality — ensure pilot spans relevant cycles (week/month/statement cycle) to avoid temporal bias; document assumptions about seasonality and traffic stability.
-
Stop / go criteria — predefine statistical and business thresholds for scaling, continuing, or killing a pilot (e.g., MDE achieved, guardrail breach, customer complaints).
-
Build vs buy framework — evaluate on speed to market, differentiation value, total cost of ownership (
TCO), integration effort, data control, and optionality; quantify using NPV or 3‑year TCO. -
Adoption-adjusted profitability — compute per-customer profit = (ARPU × adoption_rate × retention) − per-customer cost; pilot should measure adoption, not just efficacy.
-
Bias & data quality — validate instrumentation (event coverage, deduplication), audit upstream signals, and treat missing user identifiers as a showstopper for attribution.
-
Stakeholder alignment & comms — map decisions to owners (legal, ops, analytics, engineering), circulate a one-page objective-measure-plan (OMP) before launching, and schedule cadence reviews.
-
Reversibility & mitigation — prefer gradual ramps, kill-switches, and rollback plans when risk or regulatory exposure exists; document customer communication plans for reversals.
Worked example — "How do you make data-driven decisions?"
Start by clarifying: what is the concrete decision (e.g., raise default credit line for segment X), who are the affected customers, and what time horizon and constraints (regulatory, capital) exist. Organize the answer into three pillars: (1) Define success — pick a single primary metric and 2–3 guardrails; (2) Design learning — choose observational analysis vs randomized pilot, pre-specify segments, sample size, and run-length; (3) Operationalize — rollout plan, monitoring dashboard, stakeholder comms, and rollback criteria. Flag the key tradeoff explicitly: speed versus statistical certainty — a full-powered experiment might take months, so consider staged learning with a small, high-risk-tolerant cohort first. Close by describing next steps: if early signals look good, scale via stratified ramp; if inconclusive, run a powered A/B test or refine targeting. If more time, you'd add heterogeneity-of-treatment analysis and long-term retention modeling.
A second angle — "Recommend Build vs Buy for Restaurants"
Same concept but reframed to vendor evaluation and monetization. Start by segmenting restaurants by size and tech sophistication because cost, adoption, and margin differ. Define primary success: incremental paying customers or ARR per customer; guardrails: integration failures, chargebacks, and support SLAs. For pilot execution choose a small, representative cohort or region, run a time-limited trial with usage-based pricing, measure adoption-adjusted profitability, and test real integrations (reservations, payments). The tradeoff emphasizes strategic differentiation: build gives control and differentiation, buy accelerates time-to-revenue but may commoditize product; pilot to test acquisition lift and retention before committing capex.
Common pitfalls
Pitfall: Ignoring selection bias — launching a pilot to self-selected early adopters and pretending the result generalizes.
Failing to predefine segments and selection filters leads to overoptimistic extrapolation; instead, document representativeness and weight results for broader populations.
Pitfall: No guardrails or rollback plan — focusing solely on the primary metric.
This causes slow detection of harm (fraud, compliance breaches, customer complaints). Always publish an observability dashboard and trigger-based escalation path before pilot start.
Pitfall: Stakeholder misalignment on success criteria.
A common communication error is assuming "positive lift" equals go; instead, circulate an OMP with primary metric, minimum detectable effect, timeframe, and ownership so decisions are unambiguous.
Connections
Interviewers often pivot to experimentation design (power calculations, multiple comparisons), analytics & attribution (cohort analysis, funnel metrics), or go-to-market and pricing tradeoffs once pilot feasibility is shown. Be ready to bring analysts and legal into the conversation quickly.
Further reading
-
Trustworthy Online Controlled Experiments — Ron Kohavi et al., concise principles on experiment design and pitfalls.
-
Lean Analytics — practical frameworks for metric selection and rapid learning in pilots.
Focus area — Brand new to fintech means disclosures, privacy, fair lending, and consumer protection need focused Capital One preparation.
What's being tested
Interviewers are probing your ability to build and operate products that meet fair lending and compliance obligations while still delivering business value. Expect to show structured tradeoff thinking: how you measure discriminatory risk, what mitigation levers you’d prioritize, how you’d monitor post-launch, and how you coordinate legal, analytics, and engineering stakeholders. Capital One cares because lending products must be defensible to regulators, auditable internally, and fair to customers while preserving credit performance.
Core knowledge
-
Key regulations: know
ECOA(Equal Credit Opportunity Act),FCRA(Fair Credit Reporting Act) basics, andHMDAreporting scope for mortgages; these drive disclosure, recordkeeping, and adverse-action rules. -
Two legal risk classes: disparate treatment (intentional discrimination) vs disparate impact (neutral policy with disproportionate harm); disparate impact often drives product changes even absent intent.
-
Fairness metrics: be fluent in statistical parity, disparate impact ratio (four-fifths rule ≈ 0.8 threshold), equal opportunity (equal true positive rates), predictive parity, and calibration; each captures different legal/operational concerns.
-
Adverse action rules: when a credit decision harms an applicant,
FCRA/ECOArequire an adverse action notice with reasons; product UX must surface mandatory items and allow consumer response workflows. -
Data/privacy caveats: protected-class data (race, gender) is often unavailable or sensitive; use proxy inference carefully — proxies introduce noise and legal risk; document assumptions and limitations.
-
Experimentation constraints: when running
A/B tests, stratify and power by protected groups; low subgroup N leads to noisy estimates and false negatives/positives — pre-specify tests and correction methods (e.g., multiple comparisons adjustment). -
Monitoring & SLOs: set automated dashboards for population-level and subgroup metrics (approval rate, denial rate, average APR, default rate) with alert thresholds and an incident playbook for breaches.
-
Mitigation levers: ranking/threshold adjustments, feature removal/transform, targeted outreach, and counterfactual explanations; each has tradeoffs across profitability, explainability, and operational complexity.
-
Documentation & auditability: maintain product decisions, data lineage, fairness analyses, and remediation steps in a
Fair Lending Assessmentdocument — this is what regulators and internal auditors will read. -
Stakeholder orchestration: as PM, you own prioritization: coordinate Legal for assessable risk, Analytics for metric definitions and power calculations, Engineering for telemetry, and Ops for customer remediation.
-
Tradeoff quantification: express impacts in both business and legal terms — e.g., a threshold shift that reduces disparate impact ratio from 0.72 to 0.85 while decreasing approval volume by X% and increasing loss rate by Y percentage points.
-
Operational constraints: remediation requires end-to-end changes (decisioning, disclosures, support scripts); small models or hard-coded rules are easier to explain, but often less performant.
Worked example — "Design a fair credit decisioning product"
First 30s framing: clarify the product boundary (credit card vs mortgage), what “fair” means here (reduce disparate impact on a protected group? maintain equal denial rates?), available data (do we have self-reported race?), and regulatory constraints (ECOA, Adverse Action requirements). Skeleton answer pillars: (1) define concrete fairness success criteria and legal risk threshold (e.g., disparate impact ratio ≥ 0.8), (2) baseline measurement plan and subgroup power calculations, (3) mitigation strategy options and expected business impacts, (4) monitoring, reporting, and remediation playbook. Explicit tradeoff: choosing a threshold adjustment to boost subgroup approval increases credit losses — quantify expected loss increase vs incremental revenue and present to stakeholders. Close by stating next steps: run a pre-production simulation on historical applicants, involve Legal to sign off on acceptable thresholds, and, if approved, pilot with limited volume plus aggressive monitoring. If more time: detail the adverse-action UX and script for frontline agents.
A second angle — "You rolled out a pricing change and a subgroup shows higher APR increases"
Here the problem shifts from model decisioning to pricing fairness. Same concept applies: measure subgroup-level changes (average APR, spread), compute disparate impact-like ratios for pricing uplift, and power the analysis before acting. Framing differences: pricing changes often require distinct remedies (manual price caps, targeted re-pricing, grandfathering existing customers) and have more immediate revenue consequences. Product approach: (1) triage whether imbalance came from algorithm, data, or rollout targeting; (2) run counterfactual simulations to show alternative pricing; (3) choose mitigations with the smallest compliance + revenue cost and implement monitoring and customer communications. Emphasize pre-specified guardrails for future pricing experiments.
Common pitfalls
Pitfall: Treating fairness as a single metric. Interviewees will be penalized for optimizing only statistical parity; regulators care about multiple lenses — discrimination can appear in approvals, pricing, or post-origination outcomes.
Pitfall: Ignoring sample size and noise. Saying “no disparate impact” without subgroup power calculations invites risky statements; always present confidence intervals and minimum detectable effect sizes.
Pitfall: Over-relying on proxy inference for protected classes. Using inferred race/gender without documenting error bounds, bias, and legal rationale is a communication and compliance failure; recommend conservative interpretation and Legal review.
Connections
Interviewers may pivot to model governance (model risk management, documentation, and versioning), credit risk tradeoffs (loss forecasting, reserves), or experimentation (designing fair A/B tests and sequential testing). Be ready to connect technical fairness choices to business KPIs like NIM, approval volume, and charge-off rates.
Further reading
-
[Fairness and Machine Learning, Baracas/Hardt/Narayanan] — rigorous treatments of fairness definitions and tradeoffs.
-
[CFPB Fair Lending guidance and supervisory expectations] — practical regulator perspective on measuring and remediating disparate impact.
Fraud, Credit Risk, And Risk Controls
Focus areaFocus area — Capital One products are shaped by fraud, eligibility, underwriting, and abuse controls; this is likely new from logistics.
What's being tested
Interviewers are probing a Product Manager’s ability to balance fraud prevention and credit risk controls against business metrics (revenue, conversion, and customer experience). Expect to show structured tradeoffs, measurable success criteria, and a rollout/monitoring plan that limits customer harm while containing losses. Capital One cares because small policy or threshold changes can move millions in expected losses or revenue; the PM must quantify those impacts and prioritize controls accordingly.
Core knowledge
-
Control taxonomy: distinguish preventive, detective, and corrective controls; prioritize preventive for high-loss, high-frequency events, detective when friction cost is high, corrective for recovery and deterrence.
-
Key metrics: first-order metrics include
fraud loss,chargeback rate,approval rate,false positive rate,false negative rate, andnet revenue; always pair loss metrics with customer-experience metrics likeconversionandchurn. -
Expected loss math: for credit risk, use where PD=probability of default, LGD=loss given default, EAD=exposure at default; for transaction fraud, use Fraud Rate × Avg Fraud Value × Volume.
-
Economic tradeoff calc: quantify interventions with Net Benefit = (Fraud prevented × Avg loss) − (False declines × CLTV loss) − Implementation/Ops cost; use this to rank features and thresholds.
-
Threshold & segmentation: one global threshold rarely works — segment by product, geography, customer vintage, and risk tier; thresholds should map to business tolerance (e.g., accept X% fraud at checkout to preserve Y% conversion).
-
Rule vs. model tradeoffs: rules (deterministic) are fast, explainable, and low-cost for known patterns; models (scores) capture complex signals and reduce false positives but require monitoring, retraining, and explainability work.
-
Latency & UX: real-time controls (sub-second approvals) are essential at checkout; deferred checks (post-authorization review) are acceptable for lower-friction channels — always map control to allowed latency and fallback UX (soft-decline, step-up).
-
Experimentation & measurement: design randomized rollouts / holdout tests; instrument primary metrics and downstream effects (e.g., lifetime value) and use pre-specified stopping criteria to avoid peeking bias.
-
Operational controls: include manual review queue sizing, analyst SLAs, appeal/dispute workflows, and metrics for
time-to-resolutionand false-review rates — a control is only useful if resourcing is planned. -
Regulatory & fairness constraints: account for adverse action rules, required disclosures, and model explainability (e.g., reasons for decline); avoid policies that disproportionately harm protected groups without justification.
-
Monitoring & alerting: set guardrails for metric drift: sudden jumps in
fraud loss,chargeback rate, or drop inapproval rate; define playbooks for triage and rollback. -
Customer communications: plan messaging for declines, friction, and remediation that preserve brand trust; measure CSAT after interventions and include remediation costs in economics.
Worked example
Example prompt: "Reduce false declines at online checkout while keeping monthly fraud losses under $X." First 30 seconds: clarify the exact definitions and targets (how is false decline measured? time window for fraud loss? acceptable margin vs. X?), data latency, and constraints (real-time decision only? can we add challenge flows?). Skeleton of an answer: (1) define success metrics and guardrails (false decline%, fraud loss), (2) segment traffic and identify high-impact cohorts (new customers, high-value transactions), (3) propose interventions (multi-tier thresholds, soft declines/step-up auth, borrowing model score + deterministic overrides), (4) rollout and measure with an A/B or feature-flagged ramp, (5) monitoring and rollback plan. A key tradeoff to flag: lowering thresholds reduces false declines but increases fraud exposure — quantify with expected loss math and show break-even threshold. Close by noting additional work: instrument full funnel LTV impact, run simulations on historical data, and prepare manual-review capacity for step-ups.
A second angle
Different prompt: "Design risk controls for a new Buy-Now-Pay-Later (BNPL) installment product." The same principles apply but constraints shift: credit risk horizon lengthens, underwriting needs richer income/behavior signals, and fraud vectors change (account takeovers, synthetic identities). Prioritize lightweight onboarding friction to drive approval while building staged credit limits and velocity caps. Instrument early-warning signals (missed payments, returned items) and design remediation (grace periods, collections paths). You’d emphasize portfolio-level expected loss projections, vintage analysis, and staged policy tightening based on observed delinquency curves.
Common pitfalls
Pitfall: Optimizing only for fraud dollars — Proposing an aggressive rule that cuts fraud 90% without quantifying the conversion or lifetime-value loss will fail; always present the net economic impact.
Pitfall: Vagueness on metrics and rollout — Saying “we’ll reduce false declines” without specifying measurement windows, cohorts, sample sizes, or A/B design undermines confidence; give concrete test plans.
Pitfall: Over-reliance on a single lever — Suggesting only “build a model” or “raise the threshold” ignores operations, monitoring, and customer communication; better answers combine technical, operational, and UX levers.
Connections
Interviewers may pivot to experiment design (how you A/B test declines), data-science evaluation (precision/recall, calibration), or legal/compliance (disclosures, adverse action). Be ready to translate decisions into measurable experiments and operational playbooks.
Further reading
-
Stripe Radar overview — practical examples of multi-layered fraud controls and tradeoffs between automation and review.
-
Bart Baesens, "Credit Risk Analytics" — a practitioner’s reference for expected loss math, scorecard thinking, and portfolio monitoring.
Onsite — 6 min
Product Design & Strategy
Onsite — 6 min
Behavioral & Leadership
Focus area — Behavioral is 3/5, but you selected many leadership topics and need to reframe logistics business-lead experience as PM ownership.
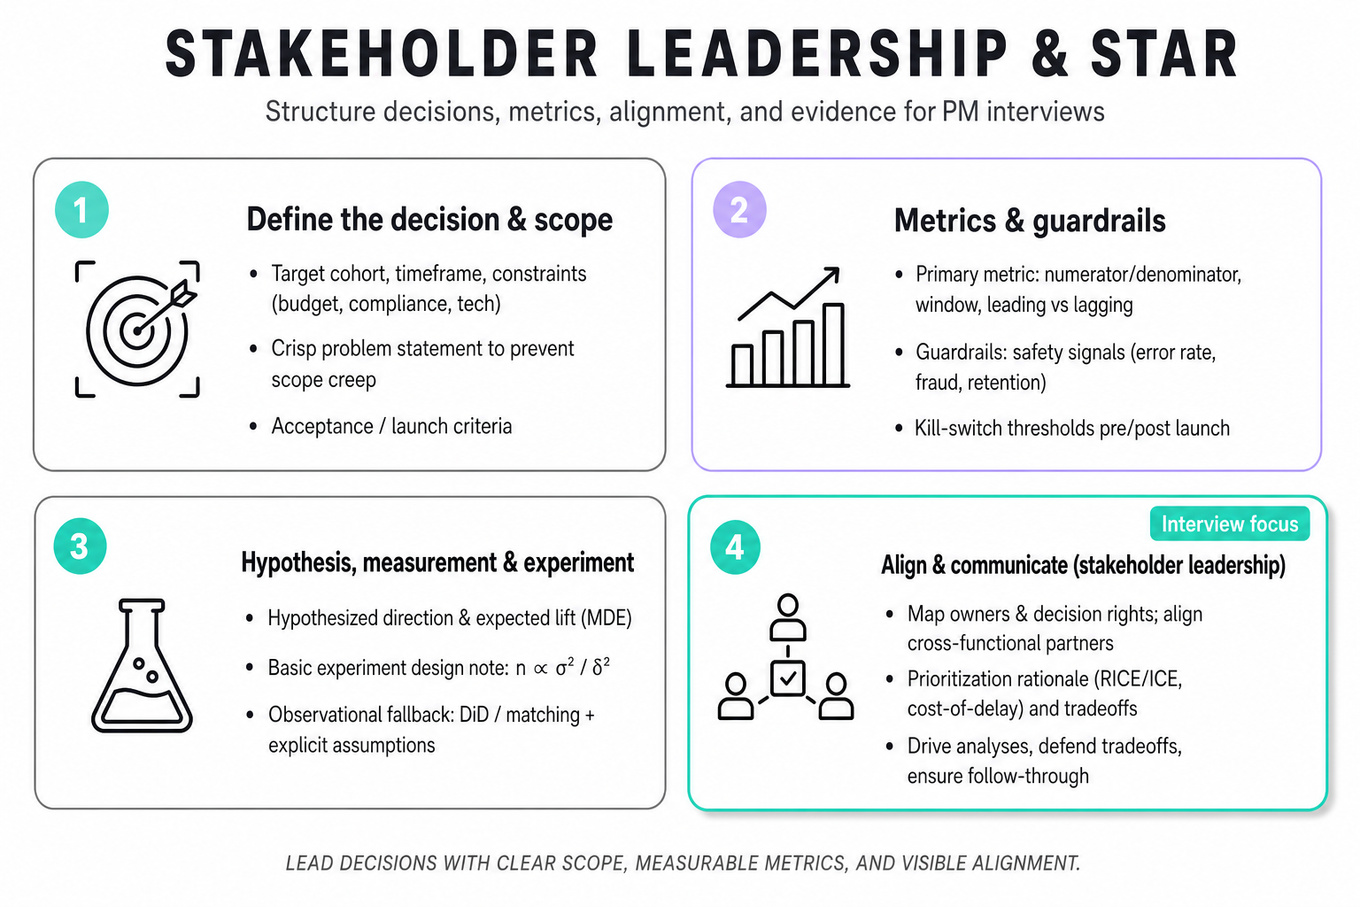
What's being tested
Interviewers expect a Product Manager to show STAR storytelling with precise stakeholder leadership: define the decision, align cross-functional partners, choose measurable success criteria, and drive to a data-backed outcome. They probe your ability to translate ambiguity into a scannable plan (priorities, risks, launch criteria), run or commission the right analyses/experiments, and defend tradeoffs—all while owning communication and follow-through. Capital One cares about reducing business and regulatory risk while delivering measurable customer value, so show rigor in metrics, safety/guardrails, and decision rights.
Core knowledge
-
Problem framing — Always start by clarifying the specific decision: target cohort, timeframe, and constraints (budget, compliance, tech). A crisp problem statement prevents scope creep and misaligned success metrics.
-
Primary metric — The single outcome that answers the ask (e.g., change in
DAU, conversion rate). Define numerator/denominator, aggregation window, and whether it's leading or lagging. -
Guardrail metrics — Minimum set of safety signals (e.g., error rate, fraud flags,
MAUretention). Must be monitored pre/post-launch and used as kill-switch criteria. -
Hypothesis + measurement plan — State hypothesized direction and magnitude (expected lift). Translate to measurable targets and acceptable uncertainty (minimum detectable effect).
-
Basic experiment design — For randomized tests, know sample-size intuition: larger effect size needs fewer users; noisy metrics (high variance) require more samples. Rough formula: where is the detectable lift.
-
Statistical vs practical significance —
p-valueand confidence matter, but also quantify business impact (dollars, retention, cost). Small statistically significant lifts may not justify rollout. -
Observational decisions — When RCTs are infeasible, use quasi-experimental techniques (difference-in-differences, matching) and be explicit about assumptions and confounders.
-
Data quality & instrumentation — Validate event counts, freshness, duplicate events, and schema drift. Monitor missingness, sampling changes, and upstream backfills before trusting metrics.
-
Prioritization & tradeoffs — Use
RICE/ICEor cost-of-delay to justify scope. Call out build-time vs learn-time tradeoffs and iterative vs big-bang launches. -
Stakeholder alignment — Use a one-pager/PRD, clear decision RACI (
RACI), and an explicit launch criteria table (primary metric threshold, guardrails, rollback plan). -
Rollout strategy — Canary, percentage rollouts, or feature flags reduce risk. Define escalation paths and rollback triggers prior to launch.
-
Post-launch cadence — Define short-term (first 24–72 hours) and medium-term (2–12 weeks) monitoring dashboards and ownership for anomaly triage and iteration.
Worked example — "Describe a Product You Led"
First 30 seconds: ask clarifying questions—what was the business objective, who were the target customers, what constraints (compliance, tech, timeline) existed, and what primary metric the interviewer expects you to report. Structure the answer around five pillars: problem & user, hypothesis & solution, cross-functional stakeholders & governance, metrics & launch criteria, and outcomes + learnings. Describe how you aligned stakeholders: a one-pager with the decision RACI, weekly syncs with Engineering, Design, Analytics, and Risk, and an agreed rollout plan with guardrails. Call out a specific tradeoff you made (for example, launching an MVP to test behavioral change versus delaying for a scalable backend)—explain why speed-to-learn won or lost. Report measurable impact with exact numbers (e.g., +4.3% conversion, 95% CI [1.2%,7.4%]) and attribution method. Close with “if I had more time” items: plan for segment-level analysis, a retention cohort study, and automated anomaly alerts to sustain the gain.
A second angle — "How do you make data-driven decisions?"
Apply the same pillars but foreground the measurement plan: define the decision and the single primary metric, include guardrails, and state minimum detectable effect and acceptable risk before any analysis. Describe diagnostics you’d run: event count stability, funnel-level checks, pre-period balance, segment heterogeneity. If randomized experiments aren’t possible, describe the quasi-experimental fallback and residual uncertainty. Emphasize communication: present both the statistical result and the business translation (e.g., expected incremental revenue, customer lifetime value impact), and recommend an action (ship, iterate, kill) tied to the evidence and reversibility.
Common pitfalls
Pitfall: Cherry-picking metrics that make the change look good (e.g., touting click-through while ignoring retention harm).
If you track only vanity metrics, you’ll miss downstream regressions—always pair a primary metric with guardrails and a downstream cohort analysis.
Pitfall: Skipping stakeholder alignment and surfacing late objections.
Many candidates describe technical success but not who needed to sign off; state the decision owners, how you secured alignment, and the escalation path for unresolved tradeoffs.
Pitfall: Overloading with technical detail or using fuzzy measurements.
Don’t dive into implementation minutiae; instead, give crisp definitions (numerator/denominator, window), unbiased results, and practical conclusions with rollback plans.
Connections
Interviewers may pivot to adjacent topics like experimentation design (power calculations, sequential testing), metric design & monitoring (alerting, SLOs), or go-to-market and adoption (launch communications, incentives). Be prepared to hand off technical analysis to Analytics/DS while owning the decision and tradeoffs.
Further reading
-
[Trustworthy Online Controlled Experiments — Kohavi, Tang, Xu] — practical guidance on experiment design and pitfalls.
-
[Inspired — Marty Cagan] — frameworks for ownership, product discovery, and stakeholder leadership.