Meta Product Manager Interview Prep Guide
Everything Meta actually asks Product Manager candidates — concept walkthroughs, worked examples, and the real interview questions, drawn from candidate reports. Free to read.
Last updated
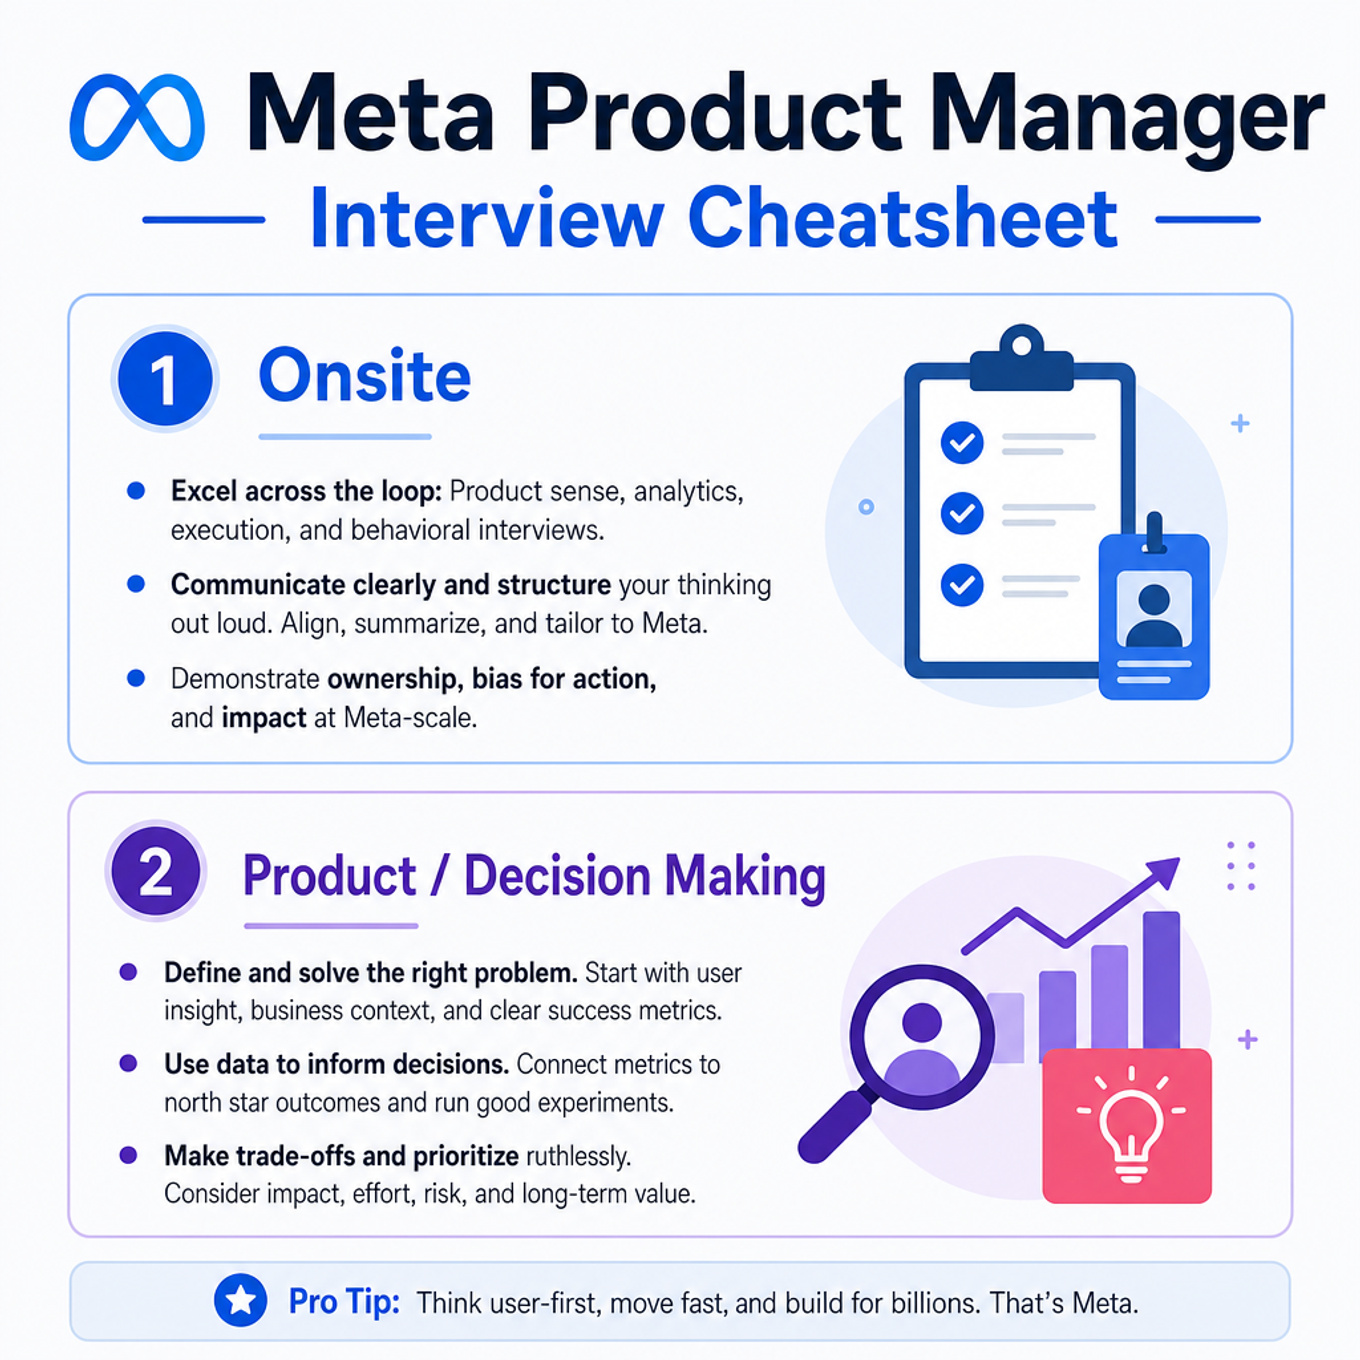
Focus most on Meta product case and analysis fundamentals: metric trees, funnel debugging, A/B testing, prioritization, marketplace/pricing, PM system design, and SQL, because your Product/Decision self-rating is 2/5 with no solved-case signal. Merely review the unflagged default-solid areas like accessible VR and behavioral STAR-L; they were not selected as gaps and your stated 60-minute round centers on product case, analysis, and SQL. Meta-specific highlights are feed/ranking tradeoffs, social-graph dynamics, Meta Pay-style marketplace/payment metrics, privacy guardrails, and experiment interpretation at Meta scale. With less than one week before the August 20, 2026 round, this plan compresses into high-yield drills and interview-ready frameworks rather than broad theory.
Onsite — 78 min
Product / Decision Making
Focus area — Your special requirement names three round types inside 60 minutes, so you need fast structure, timeboxing, and answer-switching practice.
What's being tested
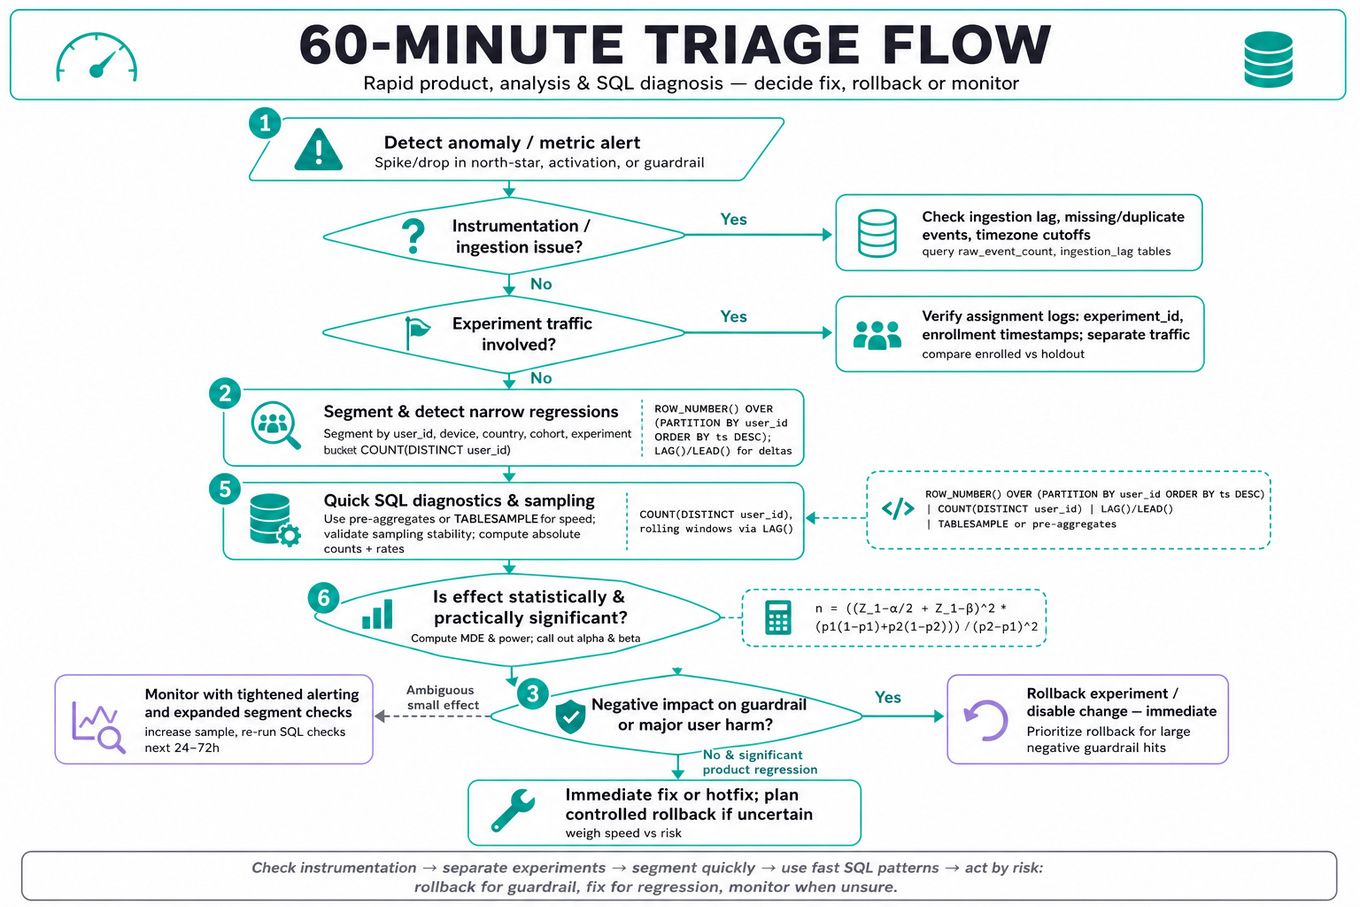
Interviewers are probing your ability to triage product issues end-to-end: form crisp hypotheses, pick the right product metrics, run focused SQL diagnostics, and recommend product or experiment actions that balance speed and risk. Meta cares because PMs must quickly decide whether a metric change is instrumentation/infra, a regression, an experiment effect, or a real user-behavior shift—and then prioritize fixes or rollouts.
Core knowledge
-
Metric taxonomy: know the difference between health metrics (
DAU,MAU, crash rate), north star (engagement or value capture), activation/conversion (funnel rates), and guardrail metrics (latency, abuse). -
High-cardinality segmentation: use user-level keys (
user_id) and segment by device, country, cohort, platform, or experiment bucketing to surface narrow regressions that aggregate metrics hide. -
Cohort & retention math: retention = returning users at t / users in cohort; lifetime metrics need right-censoring and cohort alignment to avoid survivorship bias.
-
Change attribution: check experiment traffic first—use assignment logs,
experiment_id, and enrollment timestamps to separate experiment-driven lifts from organic shifts. -
Quick SQL patterns:
ROW_NUMBER() OVER (PARTITION BY user ORDER BY ts DESC)for last-event-per-user;COUNT(DISTINCT user_id)for unique users; rolling windows viaLAG()/LEAD()to compute deltas. -
Sampling & scale tradeoffs: full-scan
GROUP BYacross billions of events is slow; use pre-aggregates/materialized views orTABLESAMPLEfor quick hypothesis checks, and always validate sampling stability by multiple runs. -
Significance & MDE: when recommending experiments, compute Minimum Detectable Effect (MDE) with
and call out power, alpha, and expected baseline p1.
-
Instrumentation checks: missing events, duplicate keys, pipeline delays, and timezone/partition cutoffs create false signals—query raw event counts and ingestion lag tables before product changes.
-
Signal vs. noise: use ratios with denominators that are stable; prefer absolute counts + rates and plot both to avoid misleading relative changes on small bases.
-
Roll-forward vs. rollback decisions: if an experiment shows large negative impact on guardrail metrics, prioritize rollback; for ambiguous signals prioritize more data or targeted canary rollouts.
-
Communication framing: always present: observation → possible causes (top 3) → quick checks performed → recommended next step (monitor/rollback/experiment/patch) with time-to-resolution estimate.
-
Privacy & sampling: when pulling user-level data, use hashed IDs and respect aggregation thresholds to avoid exposing PII; validate cohorts against privacy rules before sharing.
Worked example — Triage: sudden drop in DAU
First 30 seconds: ask sharp clarifying questions—exact time window, whether a release/deployment or experiment coincided, which platforms are affected, and whether DAU is computed by event X or a derived table. Frame your triage around three pillars: instrumentation, segment analysis, and funnel/feature checks. Start with a quick SQL to compare raw event ingestion counts vs. previous day and check for pipeline lag; then run GROUP BY platform, country, app_version on user_id unique counts to localize. Next, inspect experiments: join assignment logs to user_id and verify whether a treatment rollout aligns with the timestamp. Tradeoff to call out: deep forensic on logs gives certainty but costs hours—initial triage should favor narrow, high-leverage checks (ingestion + top 3 segments) to get a rollback decision window. Close by recommending immediate action (e.g., rollback release if instrumentation ok and guardrails broken; otherwise monitor 2–4 hours + run a focused experiment) and say "if I had more time, I'd pull server logs and the feature flag history, run a user-session-level replay, and validate against pre-aggregated metrics."
A second angle — Ambiguous A/B result on feed click-through
Same diagnostic skillset applies but the framing shifts: there you expect randomized assignment and need to validate randomization integrity and metric stability. Start by checking assignment balance across key covariates (platform, country, prior activity level) using AVG() and COUNT() by experiment_id. Then audit metric definition: are clicks deduplicated and counted in the same window used for the experiment? If the conversion lift is small and p≈0.06, explicate power and MDE concerns, propose either extending the experiment or switching to a more sensitive metric (e.g., session-level clicks per user). The core transfer: both cases require quick SQL checks, segment-level breakdowns, and an action plan that trades speed for confidence.
Common pitfalls
Pitfall: Assuming correlation implies causation.
Many candidates jump from a metric change to a product bug without validating experiments, releases, or instrumentation; always check assignment and ingestion first.
Pitfall: Over-aggregating too early.
Reporting only globalDAUcan hide platform- or cohort-specific regressions; failing to segment leads to wrong rollbacks.
Pitfall: Ignoring sample size and variability.
Reporting percent lift without confidence intervals or explaining underpowered tests makes your recommendation unreliable—call out MDE, power, and minimum runtime.
Connections
Interviewers may pivot into experimentation design (power calculations, blocking, multiple-hypothesis correction) or data engineering handoff (how to request logs, SLAs on materialized views). Be ready to propose instrumentation fixes you would ask the engineering team to implement.
Further reading
- Trustworthy Online Controlled Experiments (Kohavi et al.) — canonical reference on A/B testing pitfalls and best practices.
Practice questions
Focus area — SQL is explicitly expected in your upcoming round and is not covered by the base PM outline.
What's being tested
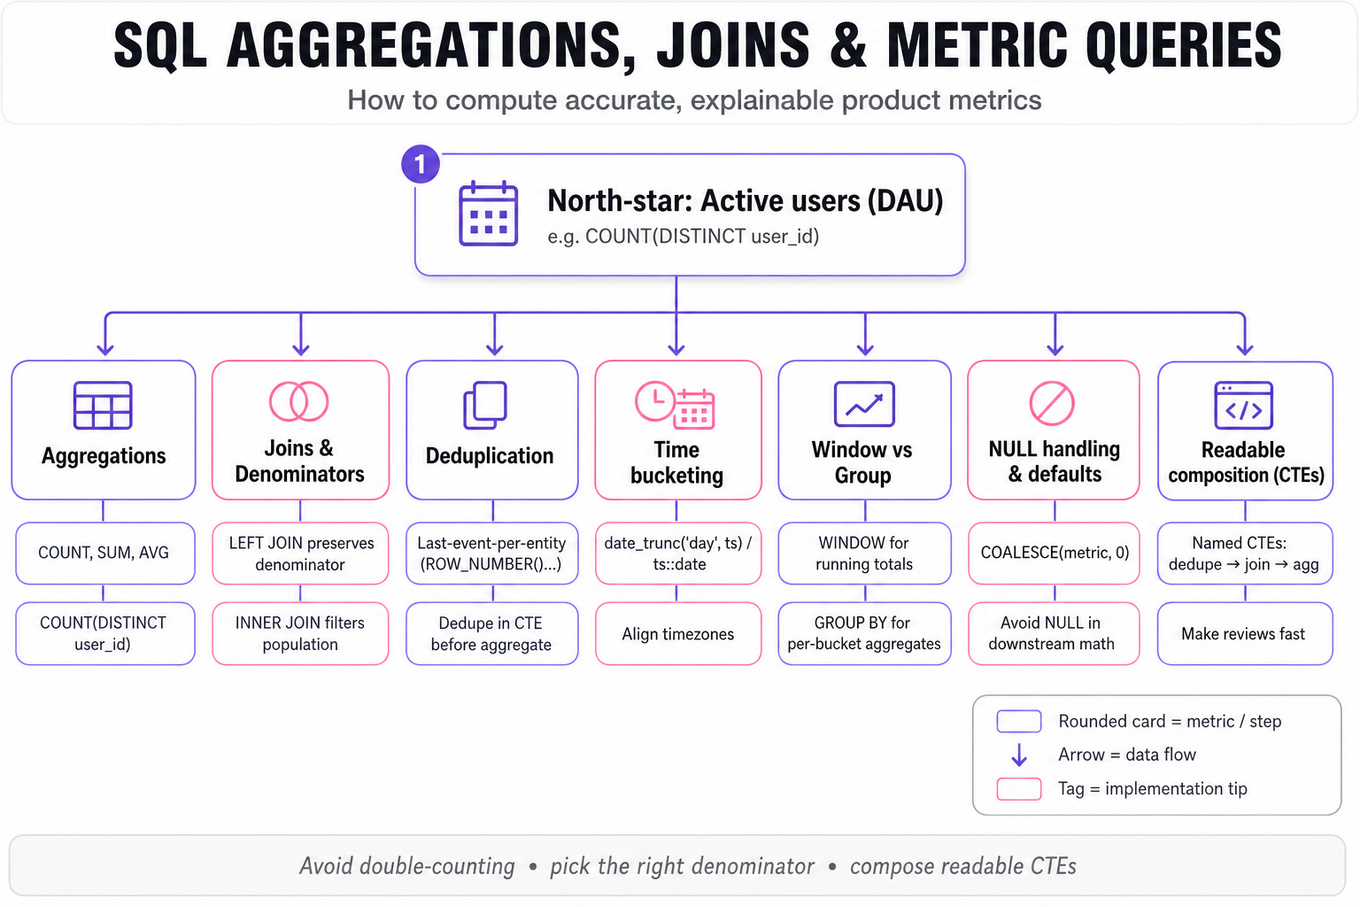
Candidates must show they can write clear, correct SQL to compute product metrics: aggregations, joins, deduplication, and time-bucketing. Interviewers probe whether you can avoid double-counting, pick the right denominators, and express metric logic so analysts and dashboards agree. For a Product Manager, the focus is accuracy and explainability of metrics, not database internals.
Patterns & templates
-
Last-event-per-entity — use
ROW_NUMBER() OVER (PARTITION BY user ORDER BY ts DESC)to pick a single row; break ties with a stable key likeid. -
Dedup + aggregate — dedupe in a CTE:
WITH dedup AS (...) SELECT user_id, COUNT(*) FROM dedup GROUP BY user_id. -
Distinct counts — use
COUNT(DISTINCT user_id)for unique users; for large cardinalities consider approximate alternatives outside SQL. -
Join types —
LEFT JOINpreserves base population (denominator);INNER JOINfilters to matching rows (use deliberately). -
Time bucketing — create windows with
date_trunc('day', ts)orts::date; align event and user tables to same timezone. -
Window vs group — use window functions (
SUM(...) OVER (PARTITION BY ...)) for running totals,GROUP BYfor per-bucket aggregates. -
NULL handling & defaults — use
COALESCE(metric, 0)to avoid NULLs breaking math in downstream code or dashboards. -
Readable composition — split logic into named CTEs for dedupe, filter, join, and final aggregation to make reviews fast.
Common pitfalls
Pitfall: Joining event table to user table with
INNER JOINunexpectedly drops users with no events, shrinking your denominator and inflating rates.
Pitfall: Not deduplicating events before
SUM/COUNTleads to double-counting when multiple event rows map to one user action.
Pitfall: Mixing timezones or using
tsvsdate_truncinconsistently causes off-by-one-day bugs in retention/DAUmetrics.
Practice these
The practice cards below cover the canonical variants — solve all of them and time yourself.
Practice questions
Focus area — Meta analysis rounds often test retention and cohort thinking; this directly supports your SQL and analysis expectations.
What's being tested
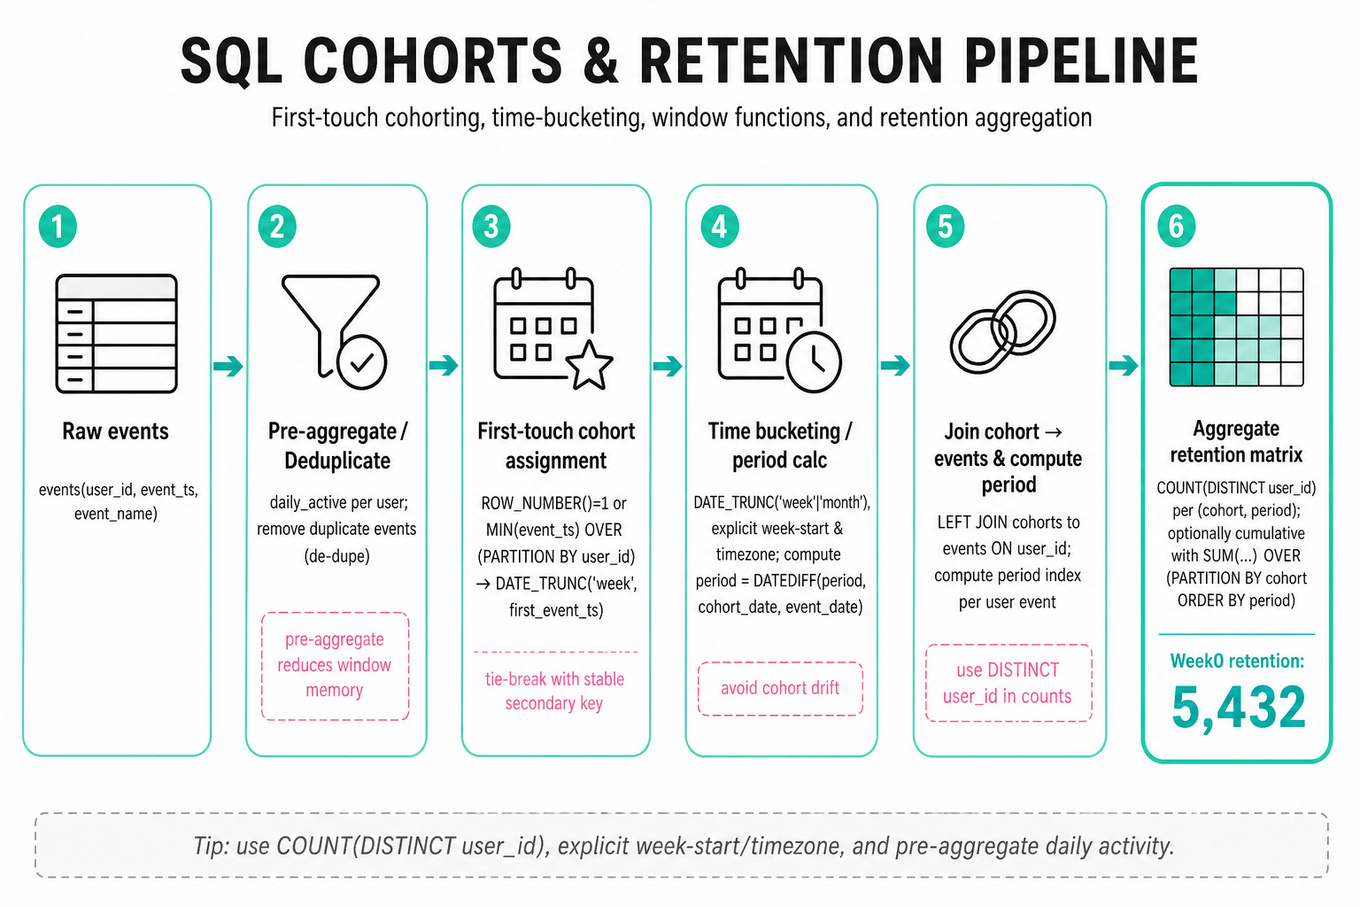
Two skills: the ability to translate product questions into cohort-based SQL analyses and to implement them using window functions and date-bucketing so you can produce accurate cohort and retention metrics. Interviewers probe whether you know the canonical SQL idioms (first-touch cohorting, deduping, time-delta joins) and can avoid common analytic mistakes that mislead product decisions.
Patterns & templates
-
ROW_NUMBER():ROW_NUMBER() OVER (PARTITION BY user_id ORDER BY event_ts)to pick each user's first or last event; ties broken by stable secondary key. -
First-touch cohort: use
MIN(event_ts) OVER (PARTITION BY user_id)orROW_NUMBER=1thenDATE_TRUNC('week', first_event_ts)to assign cohorts. -
Retention matrix: left-join cohort users to subsequent events on
user_idand computeDATEDIFF/date_diffinto discrete periods, thenCOUNT(DISTINCT user_id)per (cohort, period). -
LAG()/LEAD(): detect returns or churn by comparing consecutive events per user;LAG(event_date) OVER (PARTITION BY user_id ORDER BY event_date). -
Cumulative vs periodic: use
SUM(active_flag) OVER (PARTITION BY cohort ORDER BY period ROWS BETWEEN UNBOUNDED PRECEDING AND CURRENT ROW)for cumulative retention. -
Time bucketing: prefer
DATE_TRUNC('day'|'week'|'month', ts)and be explicit about week-start and timezone to avoid cohort drift. -
Performance: pre-aggregate events to daily active per user before heavy window ops;
O(events)scanning but window ops can add memory pressure.
Common pitfalls
Pitfall: Counting
COUNT(*)instead ofCOUNT(DISTINCT user_id)inflates retention by double-counting multiple events per user.
Pitfall: Assigning cohorts by last event or arbitrary event instead of first-touch misattributes acquisition and retention.
Pitfall: Ignoring timezone / week-start differences yields cohort leakage across boundaries and inconsistent trends.
Practice these
The practice cards below cover the canonical variants — solve all of them and time yourself.
Practice questions
SQL Experiment Analysis And Data Quality
Focus areaFocus area — Your A/B testing concepts are mostly shaky/new, and SQL may be used to validate experiment exposure and outcome tables.
What's being tested
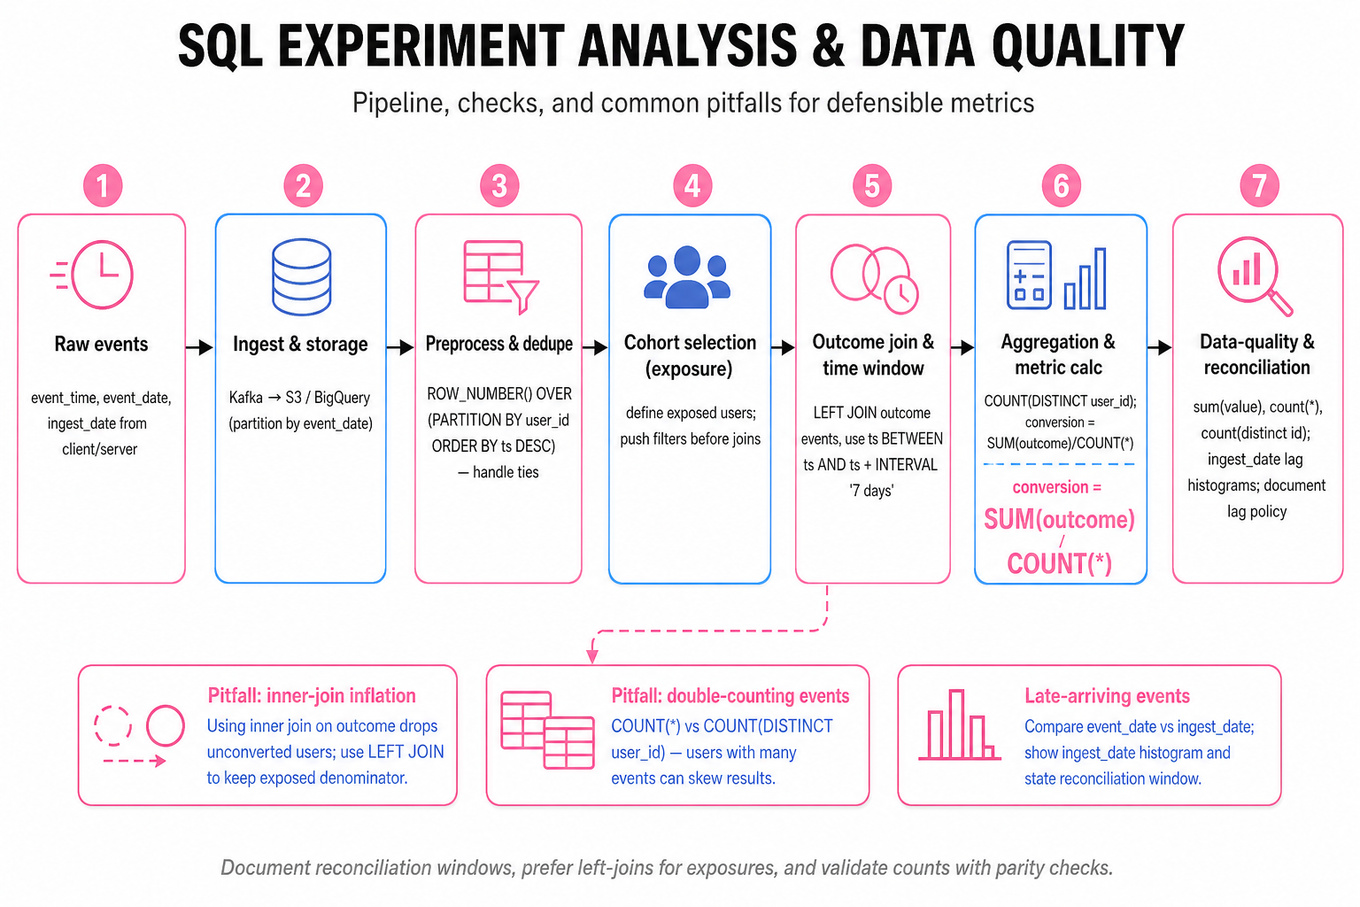
These problems test practical experiment analysis skills in SQL: writing reliable aggregation queries, validating metric definitions, and spotting data quality issues (duplicates, late events, joins that drop users). Interviewers probe whether you can produce defensible, auditable metrics quickly and reason about edge cases a PM must catch.
Patterns & templates
-
Last-event-per-user:
ROW_NUMBER() OVER (PARTITION BY user_id ORDER BY ts DESC)to dedupe and pick canonical row; handle ties explicitly. -
Unique user counts:
COUNT(DISTINCT user_id)for reach; beware cardinality limits inBigQuery/Redshift. -
Exposure → outcome joins: left-join exposure cohort to outcome events, then aggregate conversion rate with
SUM(outcome = TRUE)::FLOAT / COUNT(*). -
Time-window cohorts: window by
DATE_TRUNC('day', ts)or sliding windows withBETWEEN ts AND ts + INTERVAL '7 days'. -
Metric sanity checks: compute
sum(value),count(*),count(distinct id)and compare across data sources for parity. -
Handling late-arriving events: add
event_datevsingest_datefilters and document lag policy; compareingest_datehistograms. -
NULLs and defaults: use
COALESCE(...)for nullable dimensions; explicitly reportNULLas a bucket.
Tip: Push filters before joins and use
PARTITION BY/CLUSTER BYinBigQuery/Postgresfor large tables.
Common pitfalls
Pitfall: Reporting a conversion rate by joining only successful events (inner join) inflates the denominator—use left join to keep exposed users.
Pitfall: Using
COUNT(*)instead ofCOUNT(DISTINCT user_id)when users generate multiple events double-counts impact.
Pitfall: Ignoring late-arriving events and not stating the reconciliation window causes surprising metric shifts after launch.
Practice these
The practice cards below cover the canonical variants — solve all of them and time yourself.
Practice questions
Product Debugging And Funnel Analysis
Focus areaFocus area — Your analysis round likely tests funnel diagnosis, and onboarding, activation, aha moments, and retention loops are shaky/new.
What's being tested
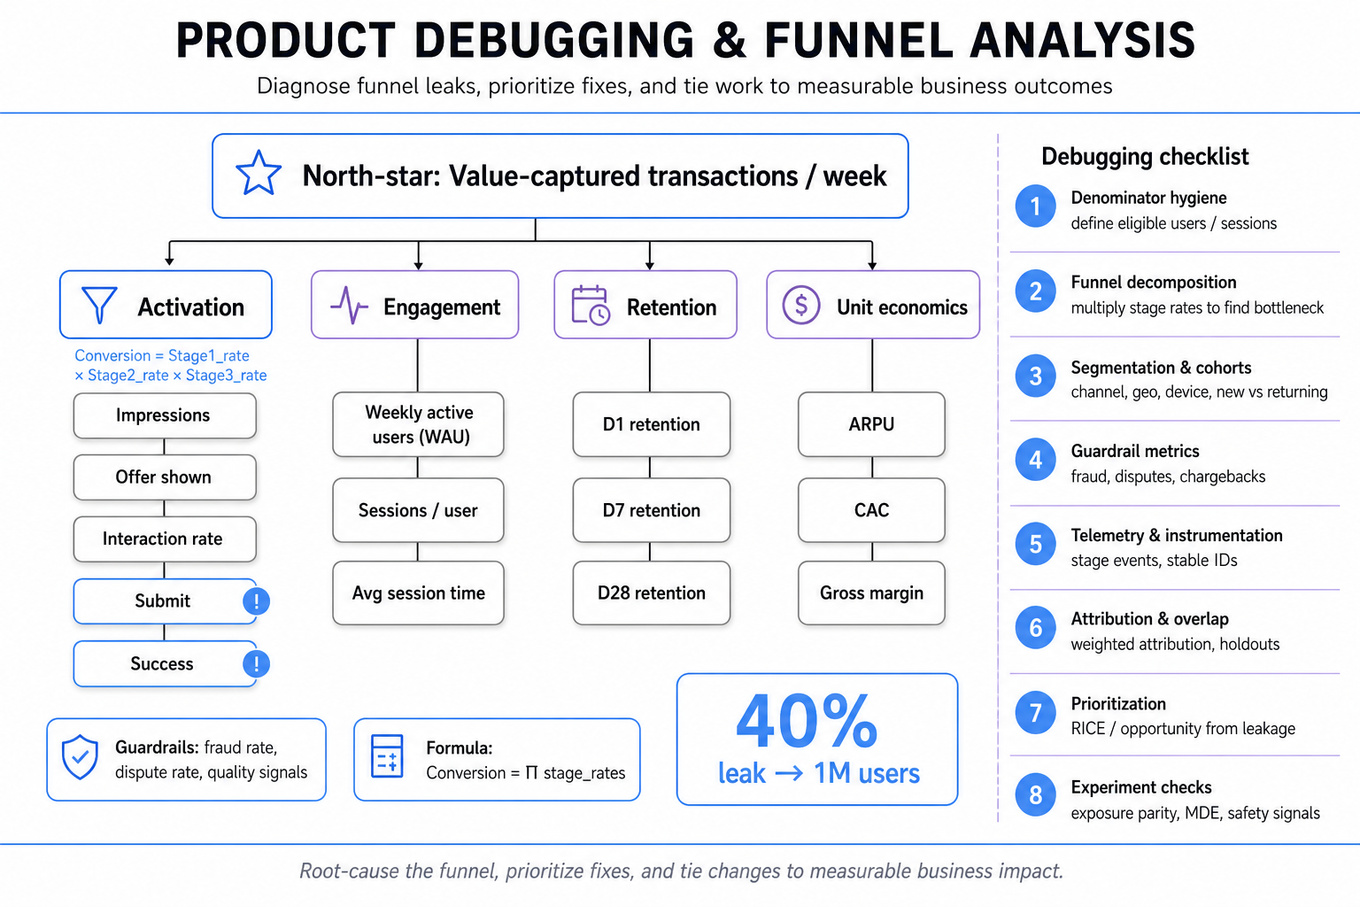
Interviewers probe your ability to diagnose product health using metric decomposition, prioritize fixes, and recommend measurable product changes that move business outcomes. They want to see structured root-cause thinking across user-facing funnels, sensible guardrails for risk (fraud/disputes/quality), and a clear communication plan tying analysis to prioritized product work. At Meta scale, the emphasis is on actionable insights that a Product Manager can own without getting lost in engineering or statistical minutiae.
Core knowledge
-
North-star framing: pick one metric that captures long-term value (e.g., value-captured transactions/week for payments). Support with a metric tree linking activation, engagement, retention, and unit economics down to KPIs.
-
Funnel decomposition: express overall conversion as a product of stage rates, e.g. Conversion = Stage1_rate × Stage2_rate × ...; decompose by segment to locate bottlenecks.
-
Denominator hygiene: always define the denominator (active users, eligible sessions, impressions). Mistakes here cause misleading rate changes; compare like-for-like cohorts or normalized time windows.
-
Segmentation & cohort analysis: slice by acquisition channel, geography, device, new vs returning, and cohort by user-signup week to separate product regressions from population shifts.
-
Guardrail metrics: track fraud rate, dispute rate, chargeback rate, and quality signals alongside growth metrics; ensure optimizations don’t worsen them.
-
Telemetry & instrumentation: instrument stage-level events (offer shown, interaction, submit, success, error code) with stable IDs; ensure sampling and late-arriving events are understood when interpreting drops.
-
Attribution & weighting: when multiple experiments or launches overlap, use weighted attribution and holdout cohorts; avoid naive "before/after" claims when other campaigns changed.
-
Prioritization frameworks: use RICE (Reach, Impact, Confidence, Effort) or opportunity scoring from funnel leakage (e.g., fix a 40% leak affecting 1M users > optimize a 1% metric).
-
Experiment sanity checks: verify experiment exposure parity, sample size / MDE reasoning, and monitor leading indicators (activation) and safety guardrails, stopping early only for safety signals.
-
Customer-centric root cause: convert metric drop into user stories (e.g., payment decline → unclear error messaging, unsupported card type, fraud decline). Recommend experiments that change user experience, not just backend tuning.
-
Unit economics & retention linkage: for payments, model per-user lifetime value: LTV ≈ ARPU × average lifetime; consider how transaction value and frequency both affect LTV.
-
Quick math for impact: use back-of-envelope: ; this helps prioritize fixes with clear ROI.
Worked example — "Define Meta Pay Success"
Start by clarifying scope and constraints: which products (wallet, in-app payments), time horizon, target geos, and whether regulatory/fraud constraints limit optimization. Frame the answer around three pillars: (1) North-star definition (value-captured transactions/week or active payers), (2) funnel KPIs (activation: payment method added, first transaction; retention: repeat transactions/time window; safety: dispute/fraud rates), and (3) prioritization and tradeoffs (user-experience vs risk controls). Show a metric tree that links Active Payers = Eligible Users × Activation_rate × Retention_rate; pick concrete thresholds (e.g., disputes <0.5% guardrail). A key tradeoff to flag: reducing friction (simpler flow) increases conversion but may increase fraud; propose staged rollout with risk-scored cohorts and stricter monitoring. Close by saying, "If I had more time, I'd run a two-arm pilot for bill-splitting vs donations in targeted markets, build a sample-size calc for the pilot (MDE 5% on conversion), and instrument post-launch cohort retention."
A second angle — "Product Metrics & Debugging Scenarios"
This prompt often focuses on incident triage and telemetry rather than product definition. Apply the same funnel decomposition but prioritize fast diagnostics: confirm whether the drop is global or segment-specific, check recent deploys/cross-product experiments, and inspect error-code distributions and p95 latency for related services. Here, privacy (e.g., data sampling or iOS/ATT changes) may explain apparent drops — translate technical signals into product impact (e.g., reduced event coverage biases conversion down). The different constraint is tempo: in an incident you prioritize rapid hypotheses (instrumentation, UI regression, backend errors) and short corrective experiments (rollback, feature-flag toggles) over longer strategic changes.
Common pitfalls
Pitfall: Mixing denominators — saying "conversion down 20%" without confirming whether the eligible pool changed (e.g., new eligibility rule) will lead to wrong remediation and misplaced engineering effort.
Pitfall: Blaming infrastructure too fast — defaulting to "it's the backend" without segmenting by error codes or user journeys misses UX-caused drops (confusing copy, button placement, or session timeouts).
Pitfall: Over-optimizing a vanity metric — optimizing
MAUgrowth without tracking value-captured or unit economics can drive low-quality users who increase costs (higher disputes/fraud), so always pair growth with guardrails.
Connections
Interviewers may pivot to experiment design (sample size, MDE, A/A tests), growth loops (how payment flows feed product virality), or risk/financial controls (fraud detection tradeoffs). Be ready to translate metric decisions into experiments or cross-functional work with risk, engineering, and analytics.
Further reading
-
Lean Analytics — practical frameworks for metric trees and choosing a north-star.
-
AARRR Pirate Metrics (Dave McClure) — concise breakdown of acquisition→activation→retention framing.
Practice questions
Prioritization And Tradeoff Frameworks
Focus areaFocus area — Prioritization and roadmapping were selected, while RICE, WSJF, OKR alignment, roadmap types, and dependency sequencing are new.
What's being tested
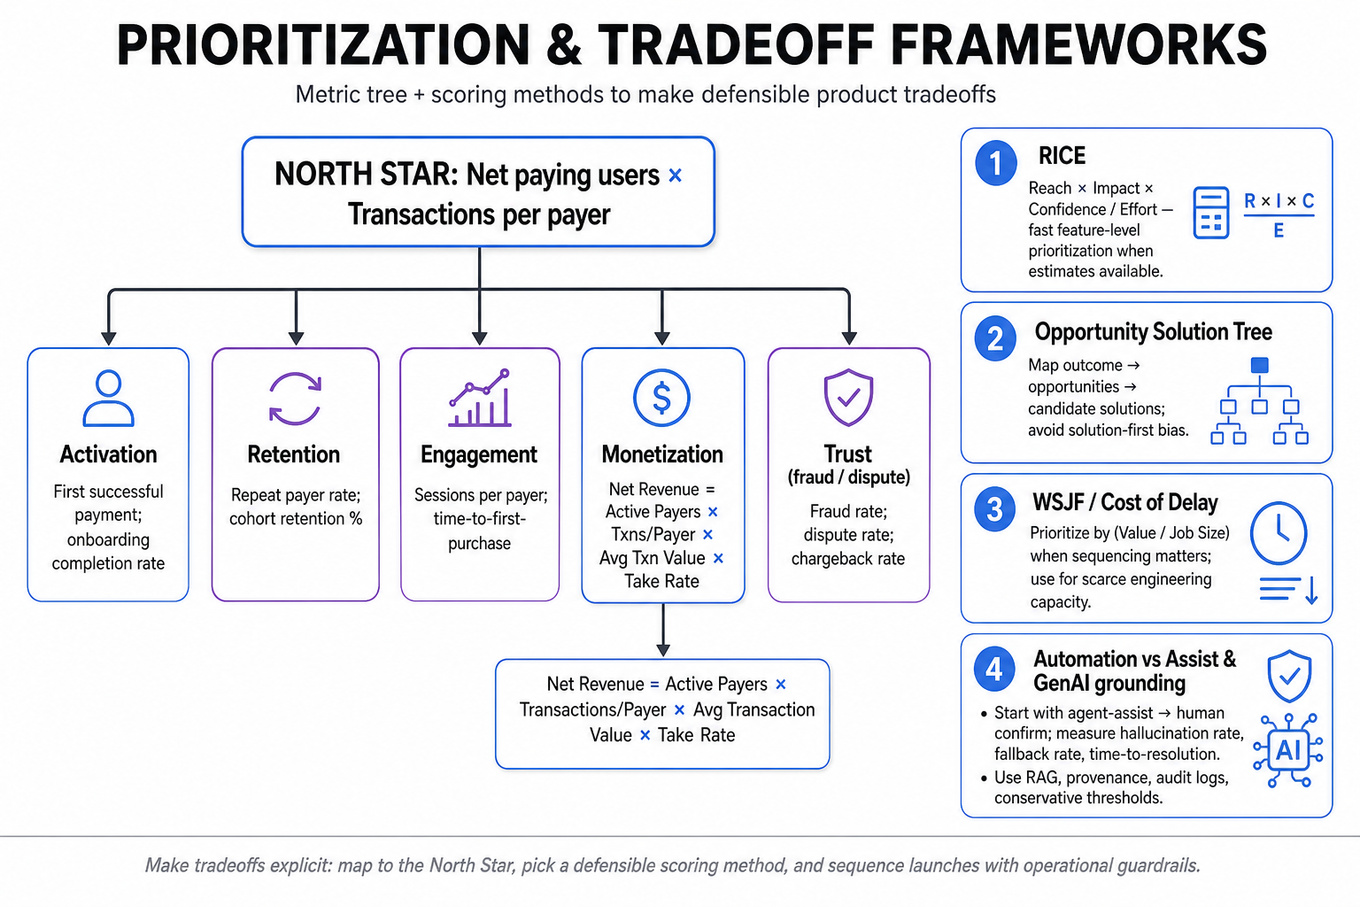
Interviewers are probing your ability to make high-quality, defensible product tradeoffs under uncertainty: prioritize features, define success metrics, sequence launches, and mitigate operational/ethical risks. They want a PM who can translate user/merchant pain into a metric tree, pick a prioritization method (with clear assumptions), and communicate tradeoffs to engineering, design, and legal partners. Expect questions to evaluate stakeholder framing, launch sequencing, and how you reason about automation vs. human-in-the-loop risk.
Core knowledge
-
North Star— a single user-centric metric that captures long-term value (e.g., net paying users × transactions per payer); everything else maps to it via a metric tree. -
Metric tree — decompose
North Starinto Activation, Retention, Engagement, Monetization, and Trust (fraud/dispute). Use formulas like:
Net Revenue = Active Payers × Transactions/Payer × Avg Transaction Value × Take Rate. -
RICEscoring —RICE= Reach × Impact × Confidence / Effort; useful for feature-level prioritization when inputs can be estimated quickly and compared across many ideas. -
Opportunity Solution Tree — map desired outcomes to opportunities and candidate solutions; use to avoid solution-first decisions and keep focus on user problems.
-
Cost of Delay / WSJF — prioritize by (Value / Job Size) when delivery sequencing matters; apply for scarce engineering capacity or cross-team dependencies.
-
Automation vs Assist tradeoff — automation improves efficiency but raises hallucination, privacy, and legal risks; start with agent assist (suggest, human confirms), then partial automation with strong fallback and audit logs.
-
GenAI grounding — use retrieval-augmented generation (RAG), source provenance, and conservatism thresholds; measure hallucination rate, fallback rate, and time-to-resolution.
-
Payments-specific levers — activation (first successful payment), fraud rate, dispute rate, merchant onboarding friction, unit economics (take rate − cost per transaction), and regulatory constraints (KYC/AML).
-
Launch sequencing — MVP → closed beta (power users/merchants) → ramp via cohorts; validate with qualitative feedback and short A/B tests focused on critical funnel steps.
-
Operational metrics to include — error rates, latency percentiles (
p50,p95), support volume per transaction, fraud false positive / negative rates; these affect retention and unit economics. -
Experiment guardrails — define primary metric, guardrail metrics (fraud, disputes, customer satisfaction), and minimum detectable effect planning; be explicit about sample size and run duration assumptions.
-
Stakeholder map — list Product, Eng, Design, Legal/Compliance, Ops, Sales/Partnerships, and Customer Support; involve early for payments and GenAI safety decisions.
Worked example — "Apply GenAI to Business Messaging"
First 30s: clarify the primary customer (retail merchants, customer-support agents, end customers), success horizon (90-day efficiency vs. 1-year revenue), and data access (past transcripts, product catalog, order status). Structure your answer around three pillars: Use-case prioritization, safety & grounding, and rollout + metrics. Prioritize by ROI: low-risk high-repeat tasks (reply drafts, templated responses, order-tracking queries) before high-risk tasks (refund approvals). For safety, require RAG with provenance, conservative confidence thresholds, and human review for actions affecting money or personal data. Launch plan: 1) suggestion-only in closed beta; 2) allow adoption metrics + UI tweaks; 3) semi-automated flows for selected intents; 4) full automation after sustained low-hallucination rates. Flag explicit tradeoff: enabling full automation speeds resolution but amplifies legal and reputational risk if hallucination or incorrect order-updates occur. Close by stating next steps: instrument metrics, design quick rollback, and run targeted A/B tests on automation levels.
A second angle — "Define Meta Pay Success"
Different constraints: payments need clear unit economics, anti-fraud, and compliance. Frame success through a North Star (e.g., Net Payment Revenue or Active Payers) and build a metric tree to surface upstream problems: acquisition → activation → repeat transactions → ARPU. Use prioritization frameworks (RICE for feature ideas, WSJF for platform work) but weight fraud and compliance heavily as guardrail metrics. For a flat adoption despite lower transaction costs, investigate funnel metrics (conversion from install → link payment method → first successful transaction), friction points (KYC, UI), and external factors (merchant acceptance, promo exhaustion). Consider partnership levers (Stripe, Plaid) vs. building in-house, and explicitly model merchant economics (take rate vs. subsidy) before scaling.
Common pitfalls
Pitfall: Optimizing a local metric that breaks the north star.
Focusing on increasing transactions by lowering verification creates fraud and chargebacks; always show how proposed metrics map to the North Star and guardrail metrics.
Pitfall: Not naming assumptions.
Interviewers reject vague prioritization. State assumptions for Reach, Impact, Confidence, and Effort numerically when using RICE or WSJF, and explain sensitivity if those change.
Pitfall: Skipping operational costs and regulatory work.
Treat fraud detection, dispute flows, compliance, and support load as first-order costs—omitting them makes launch plans unrealistic.
Connections
Interviewers may pivot to experimentation design (A/B testing setup, MDE, blocking effects), growth loops (virality/merchant network effects), or platform/partnership strategy (integrations, SDKs). Be prepared to discuss product economics and legal/regulatory tradeoffs for payments and GenAI.
Further reading
-
Teresa Torres, "Opportunity Solution Tree" — practical method to stay outcome-focused.
-
Marty Cagan, Inspired — prioritization and product discovery rituals for PMs.
Practice questions
Focus area — Two-sided marketplaces and pricing were selected, with liquidity, network effects, take-rate, matching, and multi-homing rated shaky/new.
What's being tested
Interviewers are probing a candidate’s ability to design and prioritize payments and marketplace features that move measurable user and business outcomes. Expect to demonstrate product framing (user jobs, success metrics, funnels), tradeoff-driven prioritization between features (e.g., social bill-splitting vs donations), and diagnosis of metric stagnation with concrete remediation. Meta cares because payments are both a utility and a lever for engagement, trust, and monetization on two-sided platforms.
Core knowledge
-
North-star metric: pick one shared outcome (e.g.,
Active PayersorNet Revenue) that directly ties to long-term platform health; express how secondary metrics roll up into it via a metric tree. -
Metric tree: root = north-star; common nodes: activation (
first payment within 7 days), retention (repeat payer rate at 30/90 days), conversion (view→checkout→paid), take-rate (fees /GMV), fraud/dispute rate; ensure every experiment maps to a node. -
Unit economics: formulae: LTV = ARPU × retention lifespan; CAC payback = CAC / (monthly contribution margin). Use take-rate and per-transaction costs to compute per-transaction margin: margin = take-rate × price − variable cost − fraud/dispute cost.
-
Liquidity fundamentals: supply density and demand density by geography/time; match probability ~ f(supply, demand, match quality). Early-stage target: ensure median match time < X minutes for core use case.
-
MVP scoping for marketplaces: prioritize the minimal lifecycle: discover → match → transact → review. For dog-walking, exclude nonessential features (e.g., dynamic pricing) from MVP; include core trust (profiles, ratings), payments, and simple matching.
-
Payments UX patterns: friction points—card entry, verification, payment failure recovery, refunds; use saved-credentials and one-tap pay to increase conversion; balancing security vs convenience (e.g., step-up auth).
-
Fraud & disputes as product metrics: track fraud rate and dispute rate separately; model dollar exposure = dispute rate × average transaction value × days-to-resolution; reduction here is as valuable as revenue growth.
-
Pricing & product tradeoffs: adding features (e.g., bill-splitting) can grow transaction frequency but lower average transaction size; donations may increase revenue per transaction but change activation dynamics and user intent.
-
Experimentation lenses: measure intent-to-treat (user exposure) and treatment-on-treated effects, guardrail metrics (e.g., complaints, NPS, chargebacks), and segment results by geography, device, and first-time vs repeat users.
-
Prioritization frameworks: use RICE (Reach, Impact, Confidence, Effort) or value vs risk matrices; quantify impact in expected delta to north-star and consider cost-of-delay for payments infrastructure changes.
-
Growth-debug checklist: when adoption stalls despite lower transaction cost, sequentially check: awareness/activation, trust/credibility, UX friction, supply-side constraints, cohort cannibalization, and measurement bugs (events, deduping).
Worked example — Define Meta Pay Success
First 30s: ask clarifying questions—target geos, primary user personas (peer-to-peer vs merchant), timeline, and any regulatory constraints. Frame answer around three pillars: adoption funnel (awareness → activation → conversion), monetization & unit economics (take-rate, per-transaction margin, CAC payback), and risk & trust (fraud, disputes, compliance). Propose a metric tree with a single north-star like Active Payers and supporting metrics: Conversion Rate, Repeat Payer Rate, Average Transaction Value, Take-rate, Fraud Rate, Dispute Cost. For the bill-splitting vs donations decision, evaluate expected reach (how many users will use it), behavior change (frequency, AOV), and technical/ops cost; pick the feature with higher expected delta to north-star per engineering day (RICE). Flag a tradeoff: donations can boost ARPU but complicate flows and regulatory receipt/tax handling. Close by proposing an experiment framework (A/B with guardrails) and saying: "if I had more time, I'd run cohort-level LTV simulations and a small-market pilot to validate supply-side impact."
A second angle — Dog-Walking Marketplace & Architecture
The dog-walking case reframes the same product mechanics under physical service constraints: safety and real-time constraints dominate product decisions. Matching must account for proximity, availability windows, and trust signals (background checks, certifications). Payments require support for immediate authorization, cancellations, tipping, and dispute resolution with deposit/hold semantics—this affects activation and unit economics because hold durations tie up funds. Here, prioritize supply density in target neighborhoods and quick-first-match to prove reliability. The diagnostic lens is the same—map issues to the metric tree (activation, match rate, repeat booking rate, take-rate, dispute rate)—but you’ll weight trust and safety metrics more heavily and add operational guardrails (coverage targets, walker acceptance rate) as product KPIs.
Common pitfalls
Pitfall: Choosing revenue as the north-star without tying it to user value — it leads to short-term fee increases that harm retention. Always justify revenue goals by the user job they enable.
Pitfall: Solving payments purely as a backend problem — neglecting the activation funnel (card capture, 3DS friction) and customer support flows produces poor conversion even with low fees.
Pitfall: Ignoring dispute economics — a tempting answer is "lower transaction cost buys growth"; but if dispute resolution time or fraud exposure increases, effective margin and trust fall. Quantify dispute-dollar exposure, not just counts.
Connections
These questions commonly pivot to experimentation design (power, guardrails), pricing strategy (dynamic pricing, promotion elasticity), or deeper trust & safety operations (background checks, incident triage). Be ready to move from product metrics to legal/compliance constraints or to design specific experiments and interpret cohort-level A/B results.
Further reading
-
Platform Revolution — foundational framing for two-sided marketplaces and network effects.
-
Stripe Payments UX Guide — practical patterns for reducing friction and handling disputes (product-level takeaways).
Practice questions
Focus area — System design was selected and core architecture concepts like SLOs, sharding, caching, async events, and throttling are new.
What's being tested
Interviewers are probing your ability to design product-aligned technical architecture: you must balance user journeys, business metrics, trust & safety, and operational constraints without spec’ing low-level engineering. They want to see structured tradeoffs, clear MVP scoping, measurable success criteria, and an ability to partner with engineering while staying in the PM lane. At Meta scale, the focus is on latency-sensitive UX, marketplace liquidity, regulatory/payments constraints, and observability that tie to product KPIs.
Core knowledge
-
User journeys: Map distinct actors (e.g., owner, walker, admin) with primary flows (search, match, book, walk, pay, support) and failure paths; each flow defines critical metrics and SLOs.
-
MVP scope: Prioritize core value (first successful match → completed walk → payment) over bells (ratings, insurance, advanced routing); use RICE to timebox features and reduce time-to-valuable-metric.
-
Matching strategies: Greedy proximity (nearest-first) is fast and simple; batched auctions allow better utility/price discovery but increase latency. Trade latency vs match quality explicitly.
-
Marketplace liquidity metrics: Monitor
DAU/MAUsupply ratio, fill rate (requests matched / requests placed), time-to-match median/p90, and supply-side churn; use cohort LTV and activation funnels for supply incentives. -
Unit economics: Track LTV, CAC, Take Rate, Contribution Margin per trip, and breakeven trip count:
-
Trust & safety: Combine identity verification, background checks, reviews, and incident reporting. Design friction: optional in initial markets, mandatory as scale/risks grow. Capture signal sources for policy decisions.
-
Payments & refunds: Understand authorization vs capture, delayed payouts, dispute flow, and compliance (
PCI-DSS). Product decisions include escrow vs instant payout and refund windows, which affect user trust and cash flow. -
Real-time tracking & privacy:
GPStracking enables ETA and safety; design opt-in, minimal sampling, end-to-end encryption, and retention policies to balance UX with privacy and battery cost. -
Observability & experiments: Instrument every funnel step; run powered A/B tests with pre-registered primary metric (e.g., completed walks per week). Use sample-size/power calculations and staged rollout to reduce blast radius.
-
Scalability tradeoffs (product lens): Decide when to move from single-region pilot to multi-region: prioritize localization, payments/regulatory compliance, and minimum viable liquidity in each region.
-
Fraud & misuse patterns: Track anomalous booking patterns, payment disputes, and synthetic accounts; design rate limits, verification escalation, and product-level flags before calling engineering mitigation.
-
SLOs & reliability targets: Set product-facing SLOs like time-to-match
p90, booking success rate, and payment success rate; tie operational alerts to user-impacting KPIs rather than raw infra metrics.
Worked example — "Dog-Walking Marketplace & Architecture"
First 30 seconds: clarify actors (owners, walkers, admins), geography (city pilot or nationwide), walk types (on-demand vs scheduled), and regulatory/payment constraints. Ask whether safety features (background checks, insurance) are required for launch. Organize the answer into pillars: (1) core user journeys and MVP features that deliver the first completed paid walk, (2) matching and supply strategy to ensure high fill rates, (3) trust & safety plus payments and dispute flow, and (4) metrics, experiments, and scaling plan. Call out a concrete tradeoff: choose between immediate greedy matching (low latency, simpler UX, easier to reach critical mass) and batched matching (higher quality and pricing control but higher latency and engineering cost); justify greedy matching for early markets to maximize completed-walk conversion. Close by describing short-term experiments (sign-up incentives, referral CAC tests, pricing A/B tests), and say "if I had more time" you'd prototype monetization tiers, formalize SLOs for matching latency, and run supply-side growth experiments to validate unit economics.
A second angle — "Hyperlink Request Flow at Facebook"
The same PM skills apply but focus shifts to latency, security, and observability. Clarify the product tradeoffs: user-perceived page load vs safety scanning for malicious links. Pillars become (1) user impact and latency budget (target p99 acceptable extra ms), (2) caching vs freshness for safe-link decisions, (3) privacy and auth boundaries when contacting third-party URLs, and (4) incident response/metrics to detect false positives. A PM must define acceptable failure modes (e.g., conservative blocking vs warning banner) and prioritize instrumentation to correlate link-scan decisions with downstream engagement and support costs.
Common pitfalls
Pitfall: optimizing a short-term metric (e.g., number of bookings) without tracking downstream retention or LTV.
Focusing only on bookings can encourage low-quality matches and supply burnout. Always tie growth metrics to retention and unit economics, and run experiments that measure both activation and long-term retention.
Pitfall: over-promising real-time features (instant matching, live tracking) without defining acceptable SLOs.
Engineers will implement; you must own product-level SLAs. Define the UX fallback (e.g., "searching…" + ETA) and reveal staged rollouts to manage expectations.
Pitfall: diving into low-level implementation (sharding, exact DB choice) rather than product tradeoffs.
Interviewers want prioritized requirements, risk mitigation, and measurable success criteria. Specify when you’d involve engineers for implementation options and what product outcomes each choice enables.
Connections
Interviewers may pivot to experimentation & metric design, trust & safety policy, or payments & compliance — be prepared to discuss sample-size/power, escalation policies, and payout/refund workflows. You may also need to align with SRE/ops on SLO definitions and monitoring.
Further reading
-
Lean Analytics — practical frameworks for picking metrics and running experiments in marketplaces.
-
Platform Revolution — foundational patterns for multi-sided marketplaces and network effects.
Practice questions
Trust, Safety, Privacy, And Guardrails
Focus areaFocus area — Meta product cases require privacy and safety guardrails, and your guardrail, Goodhart, and privacy-monetization concepts are weak.
What's being tested
You will be evaluated on making product decisions that balance user value with safety, privacy, and legal risk — especially when introducing automation (e.g., Generative AI) into user-facing flows, or designing trust mechanisms in marketplaces and payments. Interviewers probe your ability to frame tradeoffs, choose measurable guardrails, sequence a safe launch, and communicate escalation/ownership — the practical PM skills Meta expects for responsible product rollout.
Core knowledge
-
Threat model: enumerate actors, assets, and attack vectors (malicious users, accidental leaks, model hallucination, fraudsters). Prioritize by likelihood × impact and surface top 3 risks for the release decision.
-
Metric tree / north-star: map safety objectives into measurable KPIs (e.g.,
DAU→ engagement; safety: escalation rate, false positive rate, user-reported harm rate). Track both user-experience and guardrail metrics. -
Precision / recall tradeoff: precision = , recall = . For safety-critical rules, prefer higher recall (catch more harm) with controlled precision via manual review or throttling.
-
Error rate definitions: false positive rate ; dispute rate . Define denominators clearly to avoid misinterpretation in cross-functional debates.
-
Human-in-the-loop: specify escalation thresholds (confidence score cutoffs, value-at-risk) and SLOs for response time (e.g.,
p95/p99human review latency) — essential for automation-to-human handoff. -
Privacy principles: data minimization, purpose limitation, retention windows, and consent flows; prefer aggregated or pseudonymized signals for ML training when possible.
-
GenAI grounding: use retrieval-augmented generation (RAG) + citation and provenance UI; quantify hallucination risk and design fallback behavior (do-not-respond, ask to confirm, human escalate).
-
Experimentation under risk: run narrow
A/B testslices (percentage and user segment), use sequential testing or alpha spending to limit exposure, and include guardrail metrics in test stopping rules. -
Automation risk modes: automation complacency (users over-trust bot), mode collapse (repeated incorrect automation), and adversarial probing (malicious inputs).
-
Marketplace trust signals: verification badges, reputation algorithms, deposit/escrow designs, real-time location sharing opt-ins, and dispute flows; quantify their cost vs. liquidity impact.
-
Payments & fraud: model economic incentives (chargebacks, dispute incubation), track unit economics (net take rate after fraud), and set thresholds where human review outweighs friction cost.
-
Launch sequencing: prototype → private beta (internal+power users) → regional rollouts → global; include rollback criteria (guardrail breaches), and post-launch monitoring windows.
Tip: define explicit stop criteria before experiments: e.g., "stop if escalation rate > X% or user-reported harm increases by Y% with p<0.05".
Worked example — Apply GenAI to Business Messaging
First 30s framing questions: Which merchant segments (e.g., retail vs. e-commerce) and message types (order updates, customer support, upsell) do we target? What private data does the model access and what are consent/retention constraints? Assumptions: start with English-speaking mid-market merchants; use RAG from catalog + FAQ; keep humans in-loop for high-risk intents.
Organize your answer into three pillars: (1) Use-case prioritization — pick high-frequency, low-risk intents (order status, returns) for initial automation; (2) Safety & grounding — require citations from internal product catalog, show provenance in UI, suppress confident-but-ungrounded outputs; (3) Launch & metrics — staged rollouts with metrics: automation accuracy (TP/FP), user satisfaction (CSAT), escalation rate, and business conversion uplift.
Flag one explicit tradeoff: granting the model access to merchant customer data improves personalization but raises privacy and contractual risk; prefer short retention, on-device tokenization, or consent ephemeral keys. Close with next steps: if more time, detail human-review workforce sizing, compliance checklist per-region, and an experiment matrix for automation thresholds.
A second angle — Dog-Walking Marketplace & Architecture
The same trust-safety concepts shift to physical-safety and real-time constraints: prioritize identity verification, real-time GPS sharing opt-in, and emergency escalation flows. Clarifying questions change: what liability insurance and background-check requirements exist by jurisdiction? Pillars: user verification & reputation, contract and payment holdbacks (escrow) to reduce fraud, and safety monitoring (anomalous route detection). Tradeoffs here include friction vs. liquidity — requiring background checks reduces supply but raises trust; consider soft-verification first and require hard verification for high-value or repeat bookings.
Common pitfalls
Pitfall: conflating engagement and safety.
Many PMs treat higher engagement as uniformly good and neglect correlated harm increases; always present paired metrics (engagement + safety) and require guardrail thresholds for promotion decisions.
Pitfall: over-automating without escalation plans.
Promising broad automation (e.g., "the bot will handle refunds") without explicit human fallback or SLA leads to operational failures and user frustration; specify who owns edge cases and how they are routed and measured.
Pitfall: vague metric definitions.
Saying "reduce fraud" is weak — interviewers expect clear numerators/denominators, baseline values, and what success looks like (e.g., reduce disputed_txns rate from 1.2% to <0.8% within 3 months) so define them upfront.
Connections
Interviewers may pivot to experimentation design (how to test guardrails), ML governance (model card, bias audits), or legal/compliance (GDPR, payments regulations). Be prepared to hand off technical constraints to engineering while owning the product requirements, metrics, and launch decisions.
Further reading
-
NIST AI Risk Management Framework — practical taxonomy for AI risk assessments and mitigation strategies.
-
Google AI Principles — concise articulation of product-level safety and responsible-use tradeoffs.
Practice questions
Focus area — Roadmapping was selected, and dependency mapping plus release sequencing are new, making launch execution worth focused review.
What's being tested
Interviewers are evaluating your ability to take a product from scope to reliable launch while balancing trade-offs across time, quality, and stakeholder expectations. They want evidence you can define measurable success, map and influence stakeholders, decompose risks into mitigations, and operate a staged rollout with clear guardrails. Meta cares because launching at scale requires PMs who coordinate cross-functional teams, make defensible tradeoffs, and deliver measurable outcomes under ambiguity.
Core knowledge
-
Stakeholder mapping: list roles (engineering, design, legal, privacy, ops, sales, support) and their primary concerns; capture RACI (Responsible, Accountable, Consulted, Informed) for key deliverables in
ConfluenceorGoogle Docs. -
Product requirements vs. scope: distinguish core user value (must-have) from non-essential polish; use a short spec with user flows, acceptance criteria, and open assumptions to avoid scope creep.
-
Prioritization frameworks: apply RICE (Reach, Impact, Confidence, Effort) or ICE to compare features; quantify assumptions and surface sensitivity to the interviewer.
-
Success metrics & guardrails: pick one primary success metric (e.g., activation rate = activations / signups) plus 2–3 guardrail metrics (engagement drop, error rate, support tickets) and define numerical targets/thresholds before launch.
-
Instrumentation plan: specify events, attributes, and ownership for analytics in
Amplitude/Mixpanel/BigQuery; ensure schemas include experiment IDs, cohort tags, and error tags for fast diagnosis. -
Launch strategy patterns: prefer staged rollout (canary → 1% → 10% → 100%) with a kill switch and rollback plan; articulate timeboxed hold points and escalation path.
-
Risk register & mitigations: enumerate top risks (privacy, performance, adoption, partner delays) and assign mitigations, owners, contingency budget, and trigger conditions for each.
-
Cross-functional alignment rituals: weekly steering, daily standups during crunch, and a pre-launch readiness checklist (legal sign-off, data pipeline smoke tests, support playbook).
-
Decision criteria & tradeoffs: be explicit: e.g., accept a 2-week delay to improve data fidelity if guardrail metrics would otherwise be blind; quantify tradeoffs in expected impact or risk reduction.
-
Rollout telemetry & playbook: define real-time dashboards, alert thresholds (e.g., 2x baseline error rate), runbooks for on-call, and
Slackescalation channels plus post-mortem cadences. -
Post-launch learning loop: define the analysis window (e.g., 2 weeks for engagement signals, 90 days for retention), ownership of lessons learned, and how learnings feed the roadmap.
-
Communication plan: craft internal launch memo, user-facing release notes, training for support, and executive one-pager with topline metrics and known limitations.
Worked example — Program Execution Deep Dive
Frame the first 30 seconds by clarifying scope: who’s the target user, what problem are we solving, and what timeline is non-negotiable. Ask about hard constraints (privacy, legal, regulatory) and the single metric leadership cares about. Organize your answer around three pillars: (1) scope & prioritization (define MVP versus stretch), (2) stakeholder alignment & dependency management (RACI, weekly steering), (3) launch plan & risk controls (instrumentation, staged rollout, kill switch, success/rollback criteria). Call out a concrete tradeoff: shipping a simplified MVP in 8 weeks vs delaying 4 weeks to include partner integration — choose based on quantified impact and confidence. Close by naming next deliverables: a one-page launch readiness checklist, the expected dashboard, and a retrospective plan; add, “if I had more time I’d run a small pilot with high-touch users to validate assumptions and improve signal before wider rollout.”
A second angle — Hiking App: Design, Metrics, and Go-to-Market
Apply the same execution pattern but surface different constraints: offline maps create device and storage tradeoffs; safety features imply higher legal/QA scrutiny; and partnerships (trail data, park authorities) add external dependency risk. Prioritize instrumentation for safety-critical metrics (SOS triggers, location accuracy) and choose guardrails that can’t be ignored (false-positive SOS rate threshold). For go-to-market, map channels (outdoor communities, retail partnerships) and early-adopter incentives. Emphasize staged rollout by geography to validate offline behavior and environmental edge cases before national release.
Common pitfalls
Pitfall: Measuring the wrong metric.
Focusing on a vanity metric (e.g., total installs) without a clear primary success metric (activation or task completion) gives false confidence. Always tie metrics to the user outcome you intend to change.
Pitfall: Invisible instrumentation.
Shipping without end-to-end telemetry or experiment IDs prevents root-cause analysis; the tempting shortcut of “we’ll add analytics later” kills post-launch learning.
Pitfall: Stakeholder misalignment on exit criteria.
Assuming stakeholders share the same definition of “launch-ready” leads to late vetoes; surface and document acceptance criteria, and get signatures on the readiness checklist early.
Connections
This topic commonly pivots to experimentation & metrics (designing A/B test success criteria), product strategy (roadmap sequencing and platform plays), and growth/program management (scaling launches across regions or ecosystems).
Further reading
-
Inspired — Marty Cagan — pragmatic approaches to product discovery and building what users love.
-
Measure What Matters — John Doerr — concise framing of OKR discipline and aligning outcomes across teams.
Focus area — This adds Meta-specific product judgment around ranking, engagement, integrity, creators, friends, ads, and social graph tradeoffs.
What's being tested
Interviewers are probing your ability to define product objectives, prioritize tradeoffs, and reason about metrics when the social graph (friend/follow signals) competes with algorithmic personalization in feed ranking. Meta cares because these tradeoffs drive user satisfaction, retention, and the platform’s long-term health; the interviewer wants to see metric-driven prioritization, clear constraints, stakeholder alignment, and risk awareness from a Product Manager.
Core knowledge
-
Objective function tradeoff — explicitly state the primary metric (e.g., maximize
DAUvs maximize long-term7-day retentionormeaningful social interactions); different objectives change acceptable short-term engagement losses. -
Blended ranking formula — common approach is a weighted sum: where S = social-score (friend/interaction weight), P = personalization score; choosing
w_svsw_pis a product decision, not an ML one. -
Key product metrics — short-term:
CTR, impressions-per-session, time-spent; long-term:retention,friend-connection rate,MSI(meaningful social interactions). Track negative signals (hides, blocks, reports) as quality controls. -
User segmentation — segment by graph density (sparse vs dense), lifecycle (new vs power users), geography; social-heavy signals work better in dense-graph / social-first cohorts, personalization better for sparse-graph or content-first cohorts.
-
Cold-start & content supply — new users or new creators benefit from social-boosting (follows/friend invites) to surface content; personalization needs historical signals and can under-serve cold-start cohorts.
-
Diversity & filter bubbles — increasing
w_stends to surface more friends’ content but can reduce topical diversity and amplify echo chambers; measure topical entropy and cross-cutting exposure as guardrails. -
Temporal effects & freshness — social signals are often time-sensitive (a friend’s life event); balance freshness with relevance decay (apply time-decay or recency multiplier) rather than static boosts.
-
Experiment design — run stratified A/B tests with cohort holdouts, power calculations, and guardrail metrics (safety, misinformation). Use longish experiments for retention signals (2–6 weeks) and early-signal proxies for quicker decisions.
-
Business constraints — consider monetization tradeoffs: increasing social visibility may lower click-through on ads per-impression but increase session frequency; surface-level engagement can cannibalize ad inventory if not modeled.
-
Rollout strategy — staged rollouts: internal dogfooding → regional cohorts → percent-based ramp with monitoring on core and guardrail metrics plus rollback triggers.
-
Operational & user-experience constraints — latency targets matter: slower ranking can harm
time-to-first-feed; product choices should include acceptable latency ceilings and graceful fallbacks (e.g., cached social posts). -
Tip: lock in 2–3 primary metrics (one North Star + one short-term + one guardrail) before debating algorithmic weights; use those to guide experiments and stakeholder tradeoffs.
Worked example — "Design feed ranking tradeoffs between social-graph signals and personalization"
First 30 seconds: clarify the objective (maximize short-term engagement vs long-term retention vs social connectivity?), user scope (new users vs existing), and constraints (latency, moderation risk). Skeleton of an answer: 1) Define success metrics and guardrails; 2) Propose a blending strategy (e.g., conditional weighting by cohort); 3) Describe experiment & rollout; 4) List failure modes and mitigation. Explicit tradeoff to flag: increasing social weighting may boost immediate CTR for dense-graph users but reduce topical diversity and long-term retention for content-seeking users. Measurement plan: run stratified A/B where w_s is varied per segment and measure 7-day retention, MSI, and negative feedback; include follow-on qualitative research (surveys). Close with next steps: if more time, I’d prototype several banded weightings, simulate expected exposure changes, and plan a 4–6 week ramp with pre-registered success criteria and rollback thresholds.
A second angle — "How to prioritize fairness/diversity when social graph creates echo chambers"
Same core concept but different constraint: objective shifts toward platform health (diversity, cross-group exposure) rather than maximized engagement. You’d still define a blended score, but add explicit diversity penalty or constraint (e.g., enforce minimum topical entropy per-session). Measurement changes: track cross-group interaction metrics, sentiment, and misinformation incidents. Product levers include injecting curated non-social content, applying topical diversification layers, or adjusting weights only for cohorts prone to polarization. The experiment would be longer and include social externality measurements; stakeholder alignment must involve Trust & Safety and Comms teams early.
Common pitfalls
Pitfall: Optimizing only for immediate engagement metrics (e.g.,
CTR) without tracking long-term retention leads to decisions that maximize short-term clicks but degrade lifetime value.
Pitfall: Presenting a single quantitative result without segment-level analysis — a global uplift can hide severe regressions for important cohorts (new users, non-English locales).
Pitfall: Ignoring negative externalities like misinformation or polarization; the tempting answer "boost all friend content" fails to address safety and long-term brand trust.
Connections
These decisions often lead to adjacent conversations about experiment design & metricization (statistical power, holdouts), Trust & Safety (moderation and misinformation mitigation), and ad-monetization tradeoffs (how feed changes affect ad performance). Be prepared to pivot into any of these with aligned metrics and stakeholder plans.
Further reading
- [The Filter Bubble — Eli Pariser] — concise treatment of personalization’s societal effects and why diversity guardrails matter.
Practice questions