4.1 Challenge: Funnel Drop-Off Analysis
Find the core decision, design, or behavior signal.
Turn the lesson into a concise response blueprint.
Name the trap you would avoid in a real interview.
Use these checkpoints as your reading path before diving into the full lesson.
- 1Why this matters in interviews
- 2The brief and the tables
- 3The join is where most submissions lose...
- 4The fan-out you will not notice
- 5The invariant nobody checks until it bites
Five tiny tables land in your inbox, one per page of a booking flow, each holding nothing but a visitor id. The prompt is one sentence: find where people leak out and tell the product team what to fix first. The decision this lesson trains is not how to compute a conversion rate, which takes four lines. It is how to pick, out of four leaky steps and two devices and five channels, the one number that belongs at the top of the recommendation slide, and how to defend it when the interviewer pushes.
Why this matters in interviews
Funnel questions are the most common growth take-home there is, and they are graded almost entirely on judgment rather than technique. Every candidate can produce a table of four step rates. The separation happens in three places.
The first is the join. The tables arrive one per step, and the naive merge quietly changes your row count. Candidates who do not notice report rates on an inflated denominator and never find out.
The second is the split. Everybody splits by device because the prompt says to. Very few then ask whether the device gap is a property of the device or of who arrives on each device. That question separates people who have shipped analysis from people who have read about it.
The third is the ranking. The largest percentage drop and the largest absolute loss are usually different steps, and the largest absolute loss and the most tractable fix are usually different again. Ranking by percentage drop sends four engineers at the step that was always going to be lossy.
Interview tip: When you present a funnel, lead with the step you want fixed and the bookings it is worth per month, not with the four-row rate table. The table is evidence, not the finding.
The brief and the tables
Wanderline is a travel booking site. A visitor lands on the home page, runs a destination search, opens a property detail page, reaches the checkout form where card and traveler details go, and, if everything holds, hits a confirmation screen. Every visitor in the export is on their first ever session, so there is no repeat-visit behavior to model and no cross-session attribution to argue about.
The head of product asks two things: show her the full picture of the flow on desktop and on mobile, then tell her what to put in front of engineering next sprint.
Six files arrive. One describes the visitor, five describe who touched each page.
| File | Grain | Columns |
|---|---|---|
visitors | one row per visitor | visitor_id, device, channel, market, visit_date |
home_tbl | one row per home-page view | visitor_id, page |
search_tbl | one row per search-results view | visitor_id, page |
property_tbl | one row per property-page view | visitor_id, page |
checkout_tbl | one row per checkout view | visitor_id, page |
confirm_tbl | one row per confirmation view | visitor_id, page |
The page column in the step tables is a constant. It carries no information and exists because someone dumped the table without dropping it. Say that once and move on.
The export covers 120,000 first-time visitors between 2026-01-01 and 2026-04-30 and is a one-in-twenty-five sample of Wanderline first-visit traffic. Every count below is a sample count; I multiply by 25 once, at the end, when the finding turns into money.
This block builds the six tables deterministically, including the two defects that a real export would contain.
import numpy as np
import pandas as pd

SEED = 20260419
rng = np.random.default_rng(SEED)
N = 120_000
CH = ["organic", "paid_search", "meta_search", "direct", "email"]
LIFT = dict(zip(CH, [1.00, 0.95, 0.72, 1.25, 1.30]))

device = rng.choice(["desktop", "mobile"], N, p=[.58, .42])
mob = device == "mobile"
channel = np.where(mob, rng.choice(CH, N, p=[.27, .27, .30, .11, .05]),
                        rng.choice(CH, N, p=[.32, .24, .12, .21, .11]))
market = rng.choice(["US", "UK", "DE", "BR", "JP"], N, p=[.38, .19, .16, .15, .12])
day = rng.integers(0, 120, N)
lift = pd.Series(channel).map(LIFT).to_numpy()

s1 = rng.random(N) < np.where(mob, .58, .61)
s2 = s1 & (rng.random(N) < np.where(mob, .55, .47))
s3 = s2 & (rng.random(N) < np.clip(np.where(mob, .17, .21) * lift, 0, 1))
s4 = s3 & (rng.random(N) < np.clip(np.where(mob & (day >= 73), .24,
                                   np.where(mob, .38, .55)) * lift, 0, 1))
skip = s3 & (channel == "email") & (rng.random(N) < .18)
s2 = s2 & ~skip

vid = 100000 + rng.permutation(900000)[:N]
visitors = pd.DataFrame({"visitor_id": vid, "device": device, "channel": channel,
                         "market": market,
                         "visit_date": pd.Timestamp("2026-01-01") + pd.to_timedelta(day, "D")})
step = lambda m, nm: pd.DataFrame({"visitor_id": vid[m], "page": nm})
home_tbl = step(np.ones(N, bool), "home")
search_tbl = step(s1, "search_results")
property_tbl = step(s2, "property_page")
checkout_tbl = step(s3, "checkout")
confirm_tbl = step(s4, "confirmation")
dup = search_tbl.sample(frac=.015, random_state=7)
search_tbl = pd.concat([search_tbl, dup], ignore_index=True)
The join is where most submissions lose their first points
The fan-out you will not notice
The obvious move is a chain of left merges from the visitor table outward. Try it on one step and count rows.
naive = visitors.merge(search_tbl, on="visitor_id", how="left")
print(len(visitors), len(naive), naive["visitor_id"].nunique())
120000 121077 120000You started with 120,000 visitors and finished with 121,077 rows against the same 120,000 keys. The search logger retried on a class of slow responses and wrote 1,077 duplicate rows. Chain four more merges on top and the duplication compounds. Nothing throws. Your denominators are wrong by a fraction that grows with every join, and that fraction is not random: it is concentrated in whatever conditions caused the retry.
Stop treating this as a merge problem. You need no column from the step tables, only one bit per visitor per step: were they in this table at all. Ask for membership, not for a join.
STEPS = [("home", home_tbl), ("search", search_tbl), ("property", property_tbl),
         ("checkout", checkout_tbl), ("booked", confirm_tbl)]

funnel = visitors.copy()
for name, tbl in STEPS:
    keys = pd.Index(tbl["visitor_id"].unique())
    funnel[name] = funnel["visitor_id"].isin(keys).astype("int8")

ORDER = ["home", "search", "property", "checkout", "booked"]
print(len(funnel), funnel[ORDER].sum().to_dict())
120000 {'home': 120000, 'search': 71818, 'property': 36046, 'checkout': 6987, 'booked': 3406}Row count preserved, one row per visitor, five indicator columns. You can now group this by anything without thinking about it again.
Interview tip: Say out loud "I only need presence, so I will use set membership rather than a join, which makes duplicate log rows harmless." That one sentence is worth more than a correct answer you arrived at silently.
The invariant nobody checks until it bites
A funnel bakes in an ordering assumption: you cannot be at step k without having been at step k minus one. That assumption is why step rates mean anything. Test it.
for a, b in zip(ORDER, ORDER[1:]):
    bad = int((funnel[b] > funnel[a]).sum())
    print(f"{a} -> {b}: {bad} visitors reached the later step without the earlier one")
home -> search: 0 visitors reached the later step without the earlier one
search -> property: 0 visitors reached the later step without the earlier one
property -> checkout: 158 visitors reached the later step without the earlier one
checkout -> booked: 0 visitors reached the later step without the earlier oneThere it is. 158 visitors appear in the checkout table with no property-page view: 0.13 percent of the file, 2.3 percent of everyone who reached checkout, and the most interesting cell in the export.
Three explanations, in the order you should test them: a site-wide logging gap would scatter across channels and devices, a duplicate-id collision would produce impossible step pairs rather than one consistent pair, and a channel-scoped cause, an undocumented path or a tag failing on one email template, would concentrate. Concentration tells you the family, not the member. See where they come from, then hold them against their channel.
bypass = funnel[(funnel["checkout"] == 1) & (funnel["property"] == 0)]
print(bypass["channel"].value_counts().to_dict())
print("bypass:", round(bypass["booked"].mean(), 4),
      "| everyone else at checkout:",
      round(funnel.loc[(funnel.checkout == 1) & (funnel.property == 1), "booked"].mean(), 4))

e = funnel[(funnel["channel"] == "email") & (funnel["checkout"] == 1)]
print("inside email, bypass:", round(e.loc[e.property == 0, "booked"].mean(), 4),
      "| email non-bypass:", round(e.loc[e.property == 1, "booked"].mean(), 4),
      "| every other channel at checkout:",
      round(funnel.loc[(funnel.checkout == 1) & (funnel.channel != "email"), "booked"].mean(), 4))
{'email': 158}
bypass: 0.6266 | everyone else at checkout: 0.4843
inside email, bypass: 0.6266 | email non-bypass: 0.6667 | every other channel at checkout: 0.466Every one arrived from email, which does real work: a site-wide tag failure would scatter across all five channels, so the cause is email-scoped. Now read the second line: the first is bait. The bypass group does book 62.7 percent against 48.4 for everyone else at checkout, but everyone else is a channel mix whose four channels all book below email, which converts 65.9 percent at checkout either way. Against its own channel, 62.7 versus 66.7 on 158 and 621 visitors is a z of 0.93. The fourteen-point spread is channel, not path.
What survives is thinner and truer: the path exists, it is email-only, and nothing identifies the cause. The step tables carry a visitor id and a constant page name with no timestamp, so you cannot say whether checkout came before or after the search-results view all 158 also have, and that view is no clue: every checkout visitor logs one. Three candidates stay live: a link jumping the property template, a property tag failing on email-referred sessions, and an instant-book control on the search results. Name the column that settles it, a timestamp or a landing-page field. Resist the story that writes itself about a high-intent visitor dropped onto the checkout form: the brief said every visitor is on a first ever session, which rules out anything resuming an earlier one.
Do not delete those rows and do not force them into the property step to make the invariant hold. Report the path, note that it is small and that its apparent conversion edge is entirely channel mix, and then be careful about one specific denominator.
Interview tip: An invariant violation is a finding, not an error. Interviewers plant these. Deleting the rows to make the numbers tidy is the single fastest way to fail a funnel take-home.
The same join in SQL
If the interviewer wants the query rather than the notebook, conditional aggregation over a union beats five outer joins and is duplicate-safe by construction.
WITH touch AS (
    SELECT visitor_id, 'search'   AS step FROM search_tbl
    UNION ALL SELECT visitor_id, 'property'  FROM property_tbl
    UNION ALL SELECT visitor_id, 'checkout'  FROM checkout_tbl
    UNION ALL SELECT visitor_id, 'booked'    FROM confirm_tbl
),
flags AS (
    SELECT visitor_id,
           MAX(CASE WHEN step = 'search'   THEN 1 ELSE 0 END) AS search,
           MAX(CASE WHEN step = 'property' THEN 1 ELSE 0 END) AS property,
           MAX(CASE WHEN step = 'checkout' THEN 1 ELSE 0 END) AS checkout,
           MAX(CASE WHEN step = 'booked'   THEN 1 ELSE 0 END) AS booked
    FROM touch GROUP BY visitor_id
)
SELECT v.device,
       COUNT(*)                                   AS visitors,
       AVG(COALESCE(f.search, 0)::numeric)        AS reached_search,
       AVG(COALESCE(f.property, 0)::numeric)      AS reached_property,
       AVG(COALESCE(f.checkout, 0)::numeric)      AS reached_checkout,
       AVG(COALESCE(f.booked, 0)::numeric)        AS booked
FROM visitors v
LEFT JOIN flags f USING (visitor_id)
GROUP BY v.device;
The MAX(CASE ...) collapses duplicates for free, which is exactly the property the pandas merge lacked.
Two conversion rates, and interviewers can hear which one you mean
There are two rates in every funnel and they answer different questions.
Step conversion is the share of people who reached step k and went on to step k plus one. It is the operational number: it tells engineering how leaky one screen is, and unlike cumulative conversion it does not compound every leak above it. What it cannot do is strip out who reaches the step. The channel table below puts property-to-checkout between 0.1321 and 0.2373, so a site fed more aggregator traffic posts a worse step rate on identical screens. Run the mix check before comparing two step rates.
Cumulative conversion is the share of all entrants who reached step k. It is the business number: it multiplies down the chain, so it gives you the size of the pool at every stage.
Compute both, and be exact about the denominator on the step with the invariant violation.
def step_rates(g):
    out = {}
    for a, b in zip(ORDER, ORDER[1:]):
        entered = g[a].sum()
        advanced = g.loc[g[a] == 1, b].sum()
        out[f"{a} to {b}"] = advanced / entered
    out["overall"] = g["booked"].sum() / g["home"].sum()
    out["visitors"] = len(g)
    return pd.Series(out)

print(step_rates(funnel).round(4).to_dict())
{'home to search': 0.5985, 'search to property': 0.5019,
'property to checkout': 0.1895, 'checkout to booked': 0.4875,
'overall': 0.0284, 'visitors': 120000.0}Note the third number. Written the lazy way, as funnel["checkout"].sum() / funnel["property"].sum(), it comes out 0.1938. Restricted to visitors who actually saw a property page, it is 0.1895. The 158 bypass visitors sit in the lazy numerator and not in its denominator. The gap is 0.4 percentage points, which is also 2.3 percent of that step's rate, on the step you are about to name as the biggest problem on the site. Get it right.
Here is the whole flow both ways.
| Step | Entered | Advanced | Step conversion | Cumulative from home |
|---|---|---|---|---|
| Home | 120,000 | 71,818 | 0.5985 | 1.0000 |
| Search results | 71,818 | 36,046 | 0.5019 | 0.5985 |
| Property page | 36,046 | 6,829 | 0.1895 | 0.3004 |
| Checkout | 6,987 | 3,406 | 0.4875 | 0.0582 |
| Confirmation | 3,406 | 0.0284 |
An overall first-visit booking rate of 2.84 percent is healthy for travel, where a first session is usually research. Do not open with hand-wringing about how low it looks. Open with the shape: the flow loses 40 percent at the first hop, half the rest at the second, then falls off a cliff on the property page, where four in five people interested enough to open a specific listing never reach the form.
Splitting by device: where the two flows diverge
Run the same function per device. This is where the answer lives.
by_device = funnel.groupby("device")[ORDER].apply(step_rates)
print(by_device.round(4).to_string())
home to search search to property property to checkout checkout to booked overall visitors
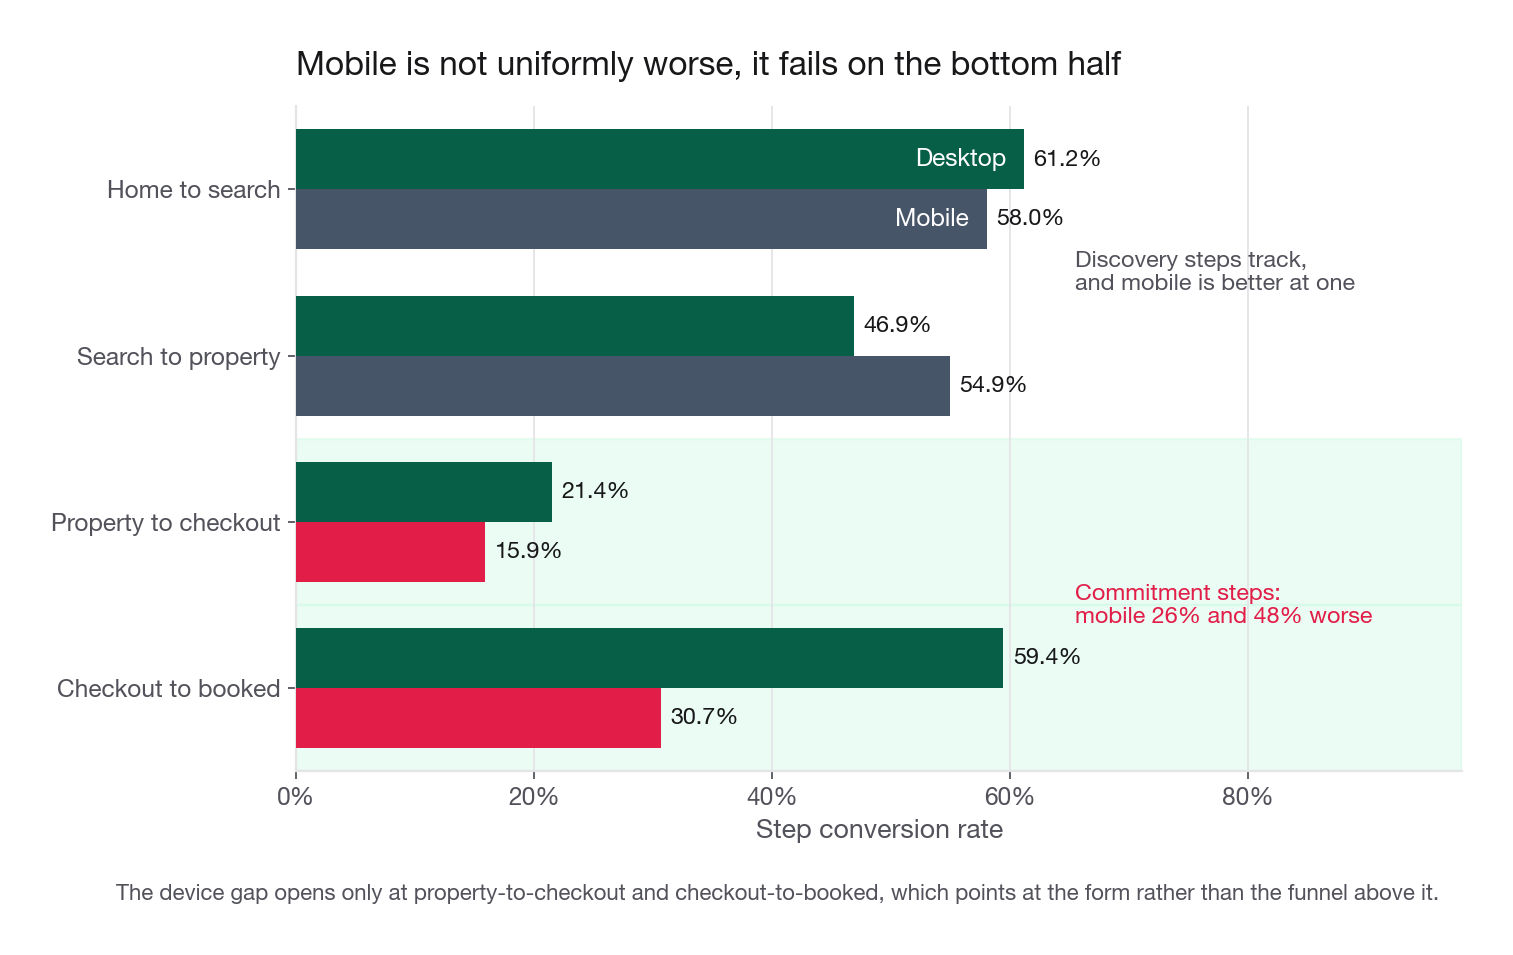
desktop 0.6117 0.4691 0.2145 0.5944 0.0376 69388.0
mobile 0.5803 0.5494 0.1586 0.3068 0.0157 50612.0Desktop books 3.76 percent of first-time visitors, mobile 1.57 percent. Desktop is 2.4 times better overall on 37 percent more traffic. The interesting reading is not the ratio, it is the shape.
| Step | Desktop | Mobile | Mobile relative to desktop |
|---|---|---|---|
| Home to search | 0.6117 | 0.5803 | 0.95 |
| Search to property | 0.4691 | 0.5494 | 1.17 |
| Property to checkout | 0.2145 | 0.1586 | 0.74 |
| Checkout to booked | 0.5944 | 0.3068 | 0.52 |
| Overall | 0.0376 | 0.0157 | 0.42 |
Mobile is not uniformly worse. It is slightly worse at getting people to search, meaningfully better at getting searchers into a listing, and much worse at both commitment steps. Mobile visitors browse more and buy less, and the deficit sits entirely in the bottom half of the flow.
That shape is a hypothesis generator. Browsing well and committing badly is the signature of a device where the discovery surface works and the form surface does not: too many fields, a card entry that fights the keyboard, a passenger-details step that loses state on rotation, a payment sheet that fails silently on some handsets. It is not the signature of "mobile users are less serious", which is the sentence a weak submission writes here.
A weak answer: mobile converts far worse, so we should invest in mobile. A stronger answer: mobile is 17 percent better at pushing searchers into listings and 48 percent worse at converting a started checkout, so the problem is the form rather than the funnel above it, and the first thing I want to know is whether that bottom-half gap belongs to the device or to who arrives on it.
Interview tip: Never describe a device gap with one number. Describe its shape across steps, then name the mechanism the shape implies. Shape plus mechanism is the whole answer.
Is the device gap real, or is it a mix effect?
Devices do not receive the same traffic. If mobile skews toward a channel that converts badly everywhere, part of the device gap is a channel gap wearing a device costume. Check that before you recommend anything: the fix for a real device gap is engineering, the fix for a mix effect is marketing, and those are different budgets.
Start with composition.
mix = pd.crosstab(funnel["device"], funnel["channel"], normalize="index")
rate = funnel.groupby("channel")["booked"].mean()
print(mix.round(4).to_string())
print(rate.round(4).to_dict())
channel direct email meta_search organic paid_search
device
desktop 0.2093 0.1102 0.1205 0.3195 0.2405
mobile 0.1109 0.0508 0.3020 0.2678 0.2684
{'direct': 0.0438, 'email': 0.0502, 'meta_search': 0.0107,
'organic': 0.0288, 'paid_search': 0.0241}There is the confound in two lines. meta_search, the price comparison aggregators, is 30.2 percent of mobile traffic against 12.1 percent of desktop, and books at 1.07 percent against 2.88 percent for organic. The two highest-intent channels, direct and email, are 31.9 percent of desktop and 16.2 percent of mobile. Mobile is holding a much worse hand.
| Channel | Share of desktop | Share of mobile | Booking rate | Property to checkout | Checkout to booked |
|---|---|---|---|---|---|
| direct | 0.2093 | 0.1109 | 0.0438 | 0.2373 | 0.6211 |
| 0.1102 | 0.0508 | 0.0502 | 0.2209 | 0.6585 | |
| organic | 0.3195 | 0.2678 | 0.0288 | 0.1958 | 0.4851 |
| paid_search | 0.2405 | 0.2684 | 0.0241 | 0.1864 | 0.4268 |
| meta_search | 0.1205 | 0.3020 | 0.0107 | 0.1321 | 0.2638 |
Email is the only row where the two ways of writing a step rate disagree, and the 158 bypass visitors are why. 621 of email's 2,811 property viewers reached checkout, so the conditional rate is 0.2209, while checkout.sum() / property.sum() gives 779 over 2,811, or 0.2771, because the bypass visitors sit in that numerator and not its denominator. Same trap as 0.1938 against 0.1895, except here it flips an ordering: at 0.2771 email leads direct's 0.2373, conditioned properly it trails.
Direct standardization, which is the whole technique
The question is: what would each device book on the same channel mix? Take the pooled channel shares as the common weighting, apply them to each device's within-channel rates, and compare. That is direct standardization, and it is four lines.
w = funnel["channel"].value_counts(normalize=True)

def standardized(g, num="booked", denom=None):
    r = g.groupby("channel")[num].mean() if denom is None else \
        g[g[denom] == 1].groupby("channel")[num].mean()
    return float((r * w.reindex(r.index)).sum())

obs = funnel.groupby("device")["booked"].mean()
adj = {d: standardized(funnel[funnel.device == d]) for d in ["desktop", "mobile"]}
raw_gap = obs["desktop"] - obs["mobile"]
adj_gap = adj["desktop"] - adj["mobile"]
print(f"observed  desktop {obs['desktop']:.4f}  mobile {obs['mobile']:.4f}  gap {raw_gap:.4f}")
print(f"mix-held  desktop {adj['desktop']:.4f}  mobile {adj['mobile']:.4f}  gap {adj_gap:.4f}")
print(f"share of the gap explained by channel mix: {1 - adj_gap / raw_gap:.1%}")
observed desktop 0.0376 mobile 0.0157 gap 0.0219
mix-held desktop 0.0347 mobile 0.0175 gap 0.0172
share of the gap explained by channel mix: 21.1%So the answer is: partly. About one fifth of the raw device gap is composition and four fifths survives holding channel mix fixed. Mobile really is worse, 21 percent less worse than the raw table claims.
Run the same standardization on the two commitment steps, where the recommendation will live.
| Comparison | Desktop raw | Mobile raw | Desktop mix-held | Mobile mix-held | Mix share of gap |
|---|---|---|---|---|---|
| Overall booking rate | 0.0376 | 0.0157 | 0.0347 | 0.0175 | 21.1% |
| Property to checkout | 0.2145 | 0.1586 | 0.2070 | 0.1648 | 24.5% |
| Checkout to booked | 0.5944 | 0.3068 | 0.5485 | 0.3165 | 19.3% |
Both gaps shrink and neither disappears. Mobile's structural deficit at property-to-checkout is 4.2 points, not 5.6, and at checkout-to-booked is 23.2 points, not 28.8.
Interview tip: After any segment comparison, ask yourself in one sentence "do these two groups receive the same traffic". If the answer is no, standardize before you recommend anything, and say the percentage of the gap that mix explained. The bypass path earlier is this trap in miniature.
The aggregate hid a dated break
Four months collapsed into one average is the last place a real problem hides. Plot the bottom step weekly by device before writing anything down.
funnel["week"] = funnel["visit_date"].dt.to_period("W").dt.start_time
weekly = (funnel[funnel["checkout"] == 1]
          .groupby(["week", "device"])["booked"].mean().unstack().round(3))
print(weekly.to_string())
device desktop mobile
week
2025-12-29 0.551 0.384
2026-01-05 0.649 0.365
2026-01-12 0.661 0.335
2026-01-19 0.593 0.250
2026-01-26 0.625 0.364
2026-02-02 0.582 0.317
2026-02-09 0.560 0.422
2026-02-16 0.544 0.348
2026-02-23 0.550 0.380
2026-03-02 0.583 0.356
2026-03-09 0.610 0.344
2026-03-16 0.605 0.163
2026-03-23 0.624 0.203
2026-03-30 0.554 0.266
2026-04-06 0.558 0.262
2026-04-13 0.599 0.270
2026-04-20 0.612 0.239
2026-04-27 0.662 0.322Print all eighteen weeks, not the tail. The pre-period is the half you are about to claim something about, and a tail is where it hides. Mobile checkout-to-booked sat in the mid-0.30s from late December through 9 March, eleven weeks between 0.250 and 0.422, median 0.356, then fell to 0.163 in the week of 16 March and never returned. Desktop did not move. That is not a UX finding, that is a release.
Do not skip past the 0.250 week of 19 January. On 148 checkouts it sits 2.6 standard errors under the pooled pre rate of 0.3536, a once-in-eleven-weeks excursion, and it lands inside the post-break range of 0.163 to 0.322. Seven straight weeks below the old floor is another object. One low point is noise, a dated shift is a release.
Test it rather than eyeballing it. Split at 15 March and run a two-proportion comparison per device.
import math
funnel["era"] = np.where(funnel["visit_date"] >= pd.Timestamp("2026-03-15"), "post", "pre")

def two_prop(dev):
    d = funnel[(funnel["device"] == dev) & (funnel["checkout"] == 1)]
    a, b = d[d.era == "pre"], d[d.era == "post"]
    p1, n1 = a["booked"].mean(), len(a)
    p2, n2 = b["booked"].mean(), len(b)
    se = math.sqrt(p1 * (1 - p1) / n1 + p2 * (1 - p2) / n2)
    return p1, n1, p2, n2, p1 - p2, se, (p1 - p2) / se

for dev in ["mobile", "desktop"]:
    p1, n1, p2, n2, d, se, z = two_prop(dev)
    print(f"{dev:8s} pre {p1:.4f} (n={n1})  post {p2:.4f} (n={n2})  "
          f"drop {d:+.4f}  se {se:.4f}  z {z:+.2f}")
mobile pre 0.3536 (n=1527) post 0.2400 (n=1071) drop +0.1137 se 0.0179 z +6.35
desktop pre 0.5926 (n=2612) post 0.5971 (n=1777) drop -0.0044 se 0.0151 z -0.29Mobile fell 11.4 points, z of 6.35, 95 percent interval 7.9 to 14.9 points. Desktop moved 0.4 points the other way with a z of minus 0.29, which is nothing. The difference in differences is 11.8 points, mobile-only, sharply dated.
That is a much stronger causal claim than anything else in this analysis, and it comes almost for free. Desktop is doing the work of a control group: whatever seasonal or demand-side shift happened in mid-March hit both devices, and only mobile's payment step moved. What is left is a mobile-web release, a payment provider change scoped to the mobile SDK, or a third-party script failing on mobile browsers.
Interview tip: Whenever you find a segment-specific step change, immediately check the other segments over the same window. A parallel non-move in a comparable segment turns a correlation into something you can put a date and an owner on.
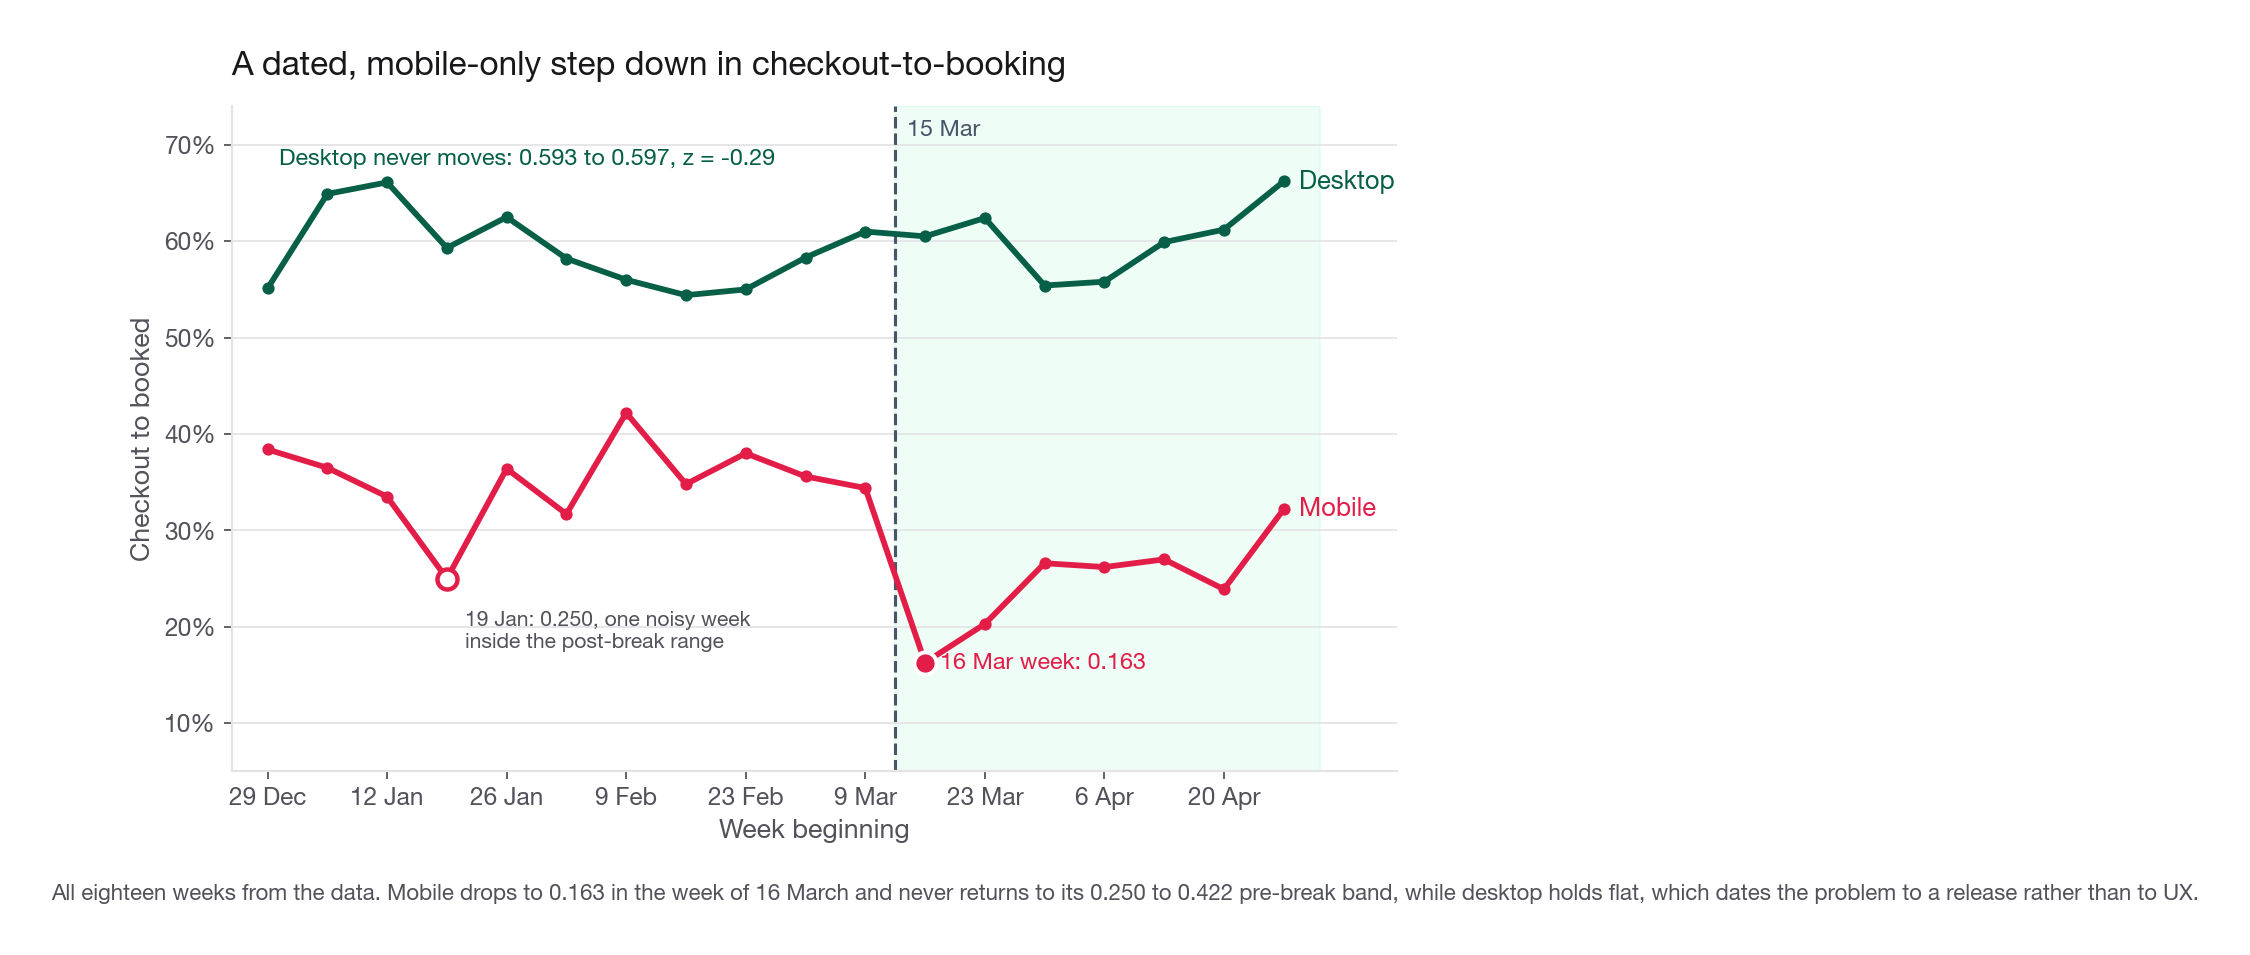
Be honest about the limit. Eighteen weekly points with a break in the twelfth is a small pre-post design, the partial recovery to 0.24 in April hints at a mitigation you have no record of, and this data cannot separate a code release from an infrastructure change. Ask for the release log covering 12 to 16 March and move on. Naming the artifact that would settle it beats another chart.
Sizing: turning percentage points into bookings
Rank steps by percentage drop and you attack property-to-checkout, where 81 percent leave. Rank by absolute users lost and you get a different order. Rank by bookings at risk, weighting each lost visitor by how likely they were to convert had they advanced, and you get the order that matters.
rows = []
for a, b in zip(ORDER, ORDER[1:]):
    entered = int(funnel[a].sum())
    advanced = int(funnel.loc[funnel[a] == 1, b].sum())
    lost = entered - advanced
    p_book_next = funnel.loc[funnel[b] == 1, "booked"].mean()
    rows.append([f"{a} to {b}", entered, advanced, round(advanced / entered, 4),
                 lost, round(p_book_next, 4), round(lost * p_book_next)])

loss = pd.DataFrame(rows, columns=["step", "entered", "advanced", "rate",
                                   "lost", "p_book_next", "bookings_at_risk"])
print(loss.to_string(index=False))
step entered advanced rate lost p_book_next bookings_at_risk
home to search 120000 71818 0.5985 48182 0.0474 2285
search to property 71818 36046 0.5019 35772 0.0917 3282
property to checkout 36046 6829 0.1895 29217 0.4875 14243
checkout to booked 6987 3406 0.4875 3581 1.0000 3581Home-to-search loses the most human beings, 48,182, and is worth the least: each was worth 0.047 bookings, so the step holds 2,285 bookings of theoretical upside. Property-to-checkout loses fewer people, 29,217, but each was one step from a 48.8 percent booking rate, so it holds 14,243 bookings at risk, four times any other step and four times the file's entire first-visit booking count of 3,406.
That is the answer to "where is the largest loss of bookings", and it is not close.
Interview tip: Bookings at risk equals visitors lost times the booking rate of the people who did advance. Write that formula on the whiteboard before you compute anything. It is the sentence that makes a funnel ranking defensible.
From "at risk" to "recoverable"
Bookings at risk is a ceiling, not a forecast. Nobody converts 100 percent of a step. You need a benchmark for what the step could plausibly reach, and the two credible ones here are the other device and the step's own past.
Benchmark one, the step's own past. Mobile checkout-to-booked ran at 0.3536 before 15 March and 0.2400 after. Restoring a dated regression is a bug fix, not a redesign.
NET_PER_BOOKING = 46.0     # average trip value times take rate, in dollars
SAMPLE_FACTOR = 25         # the export is a 1-in-25 sample of first-visit traffic

mo = funnel[funnel["device"] == "mobile"]
post = mo[mo["era"] == "post"]
pre_rate = mo.loc[(mo.era == "pre") & (mo.checkout == 1), "booked"].mean()
n_post_chk = int(post["checkout"].sum())
recovered = n_post_chk * pre_rate - int(post["booked"].sum())
per_month = recovered / 47 * 30 * SAMPLE_FACTOR
print(f"mobile checkouts since 15 Mar: {n_post_chk}, booked {int(post['booked'].sum())}")
print(f"bookings lost in that 47-day window (sample): {recovered:.0f}")
print(f"at full traffic: {per_month:,.0f} bookings/month, "
      f"{per_month * NET_PER_BOOKING:,.0f} net revenue/month")
mobile checkouts since 15 Mar: 1071, booked 257
bookings lost in that 47-day window (sample): 122
at full traffic: 1,943 bookings/month, 89,364 net revenue/monthBaseline is 3,406 bookings in 120 sample days, 21,288 per month at full first-visit traffic, about 979,000 per month in net revenue from first sessions. Numerator and denominator share the file's universe, so the regression costs 9.1 percent of first-visit net revenue every month it is unfixed. That is your headline, and say "first-visit" out loud: the export has no returning sessions, so the loss is larger.
Benchmark two, the other device. Mobile's mix-held property-to-checkout rate is 0.1648 against desktop's 0.2070. Applying that 4.2 point gap to 16,136 mobile property views gives 681 extra checkouts and, at mobile's pre-regression booking rate, 241 extra bookings in the sample window: about 1,500 bookings and 69,000 monthly at full traffic.
Do not present that as a forecast. Full device parity has never happened anywhere. Present it as a ceiling with an explicit capture assumption: at one third of the gap, a normal outcome for a checkout-entry redesign, it is roughly 500 bookings and 23,000 per month. Say the one third is your assumption rather than pretending it fell out of the data.
| Opportunity | Evidence | Monthly bookings | Monthly net revenue | Confidence | Effort |
|---|---|---|---|---|---|
| Fix the mobile payment regression | Dated 11.4 point drop, z of 6.35, desktop flat as control | 1,950 | 89,000 | High | Low, it is a rollback or a patch |
| Close one third of the mobile property-to-checkout gap | 4.2 point mix-held gap against desktop, stable all four months | 500 | 23,000 | Medium | High, design and build |
| Re-weight meta_search spend | 1.07 percent booking rate, 30 percent of mobile traffic | Not computable | Not computable | Medium | Owned by marketing, not product |
| Investigate the email-only checkout path | 158 reach checkout with no property view, at their channel's rate, not above it | Not computable | Not computable | Low, tiny sample, no lift over channel | Low |
The ranking writes itself once the table exists, and it is not the ranking the step-rate table alone would have produced. The largest structural loss is property-to-checkout. The most urgent action is the mobile payment fix: four times the value at a fraction of the effort on far better evidence, and every week it stays open costs about 20,000 in net revenue.
On meta_search: the file has no spend column, so cost per booking is not computable and any recommendation to cut or scale that channel is unsupported. A 1.07 percent booking rate is no reason to cut a channel that may cost a tenth of paid search per visitor. Refusing a question you cannot answer, while naming exactly what would let you answer it, reads as senior. Guessing reads as junior.
What the write-up actually looks like
The analysis above is maybe six hours. The write-up is forty minutes and it is worth more of the grade. Four short paragraphs, in this order, and no more than one page before the appendix.
The finding. Mobile checkout-to-booking fell from 35 to 24 percent in the week of 16 March and has not recovered, while desktop was unchanged. That is costing about 1,950 first-visit bookings and 89,000 in first-visit net revenue per month, 9 percent of that base, and a floor: the same payment path serves returning sessions this export lacks. Ask engineering for anything shipped to mobile web or the mobile payment path between 12 and 16 March.
The structural problem. Separately from the regression, property-to-checkout is where the site loses the most value: 29,217 visitors leave that step, each one step from a 49 percent booking rate. Mobile is 4.2 points worse than desktop there after holding channel mix fixed. That is a design project, not a bug fix, and closing a third of the gap is worth about 500 bookings a month.
What the numbers do not say. One fifth of the raw device gap is channel mix, so do not read the 2.4 times ratio as a mobile product deficit. Channel profitability is not computable without spend. The email-only bypass path books at 63 percent, but that is its channel's rate and not a lift, since email at checkout books 66 percent either way, so it is a documentation finding, not an opportunity. Every dollar figure above is first-visit only, so the losses are floors.
What you would do next. Pull the mid-March release log, instrument field-level drop-off inside the checkout form so the next version of this analysis has a within-form funnel, and get the spend table so the channel question becomes answerable.
Then the appendix: the data-quality log with the 1,077 duplicate search rows and the 158 bypass visitors, the code, and the tables. Nobody reads it unless they doubt you, which is exactly why it has to be there.
Interview tip: Put the dollar number in the first sentence of the write-up. A reviewer skimming twenty submissions decides in fifteen seconds whether yours is worth reading closely, and a sized finding is the only thing that survives that skim.
Common traps
Chaining left merges across the step tables. Duplicate log rows inflate the row count silently and corrupt every denominator downstream. Fix: build boolean membership columns with isin on the unique keys, then assert the row count is unchanged.
Skipping the monotonicity check. The 158 checkout visitors with no property view are the most interesting rows in the file, and a candidate who never tests the invariant never sees them. Fix: loop over adjacent step pairs and count violations before computing a single rate.
Deleting the rows that violate the invariant. It makes the table tidy and throws away the finding. Fix: keep them, characterize them, and adjust only the specific denominator they affect.
Dividing sums instead of conditioning. checkout.sum() / property.sum() gives 0.1938 where the correct conditional rate is 0.1895, because the bypass visitors sit in the numerator without being in the denominator. Fix: always write g.loc[g[a] == 1, b].mean().
Reporting a segment gap without checking composition. The raw 2.4 times device ratio overstates the device effect by 21 percent, and a recommendation built on it sends engineers at a problem that is partly marketing's. Fix: standardize on the obvious confounder and report the share of the gap it explains.
Ranking steps by absolute users lost. Home-to-search loses 48,182 visitors and holds 2,285 bookings of upside. Property-to-checkout loses 29,217 and holds 14,243. Here percentage drop agrees with bookings at risk everywhere, so headcount is the ranking to flag. Fix: rank by lost visitors times the downstream booking rate, never by headcount alone.
Presenting bookings at risk as achievable. 14,243 bookings is four times the site's entire booking count and no team will ever capture it. Fix: anchor to a benchmark, either the step's own past level or a comparison segment, and state the capture fraction as your assumption.
Averaging over a break. Mobile checkout-to-booked reads 0.3068 for the period, a number that describes no week that actually happened, and calling the drop a UX problem costs you the cheapest recommendation in the file. Fix: plot the bottom step weekly by segment, and whenever a rate steps rather than drifts, look for a date and check whether a comparable segment moved with it.
Recommending a channel cut without cost data. A 1.07 percent booking rate says nothing about profitability if that channel is cheap. Fix: state that cost per booking is uncomputable, name the spend column you need, and leave the decision open.
Writing a recommendation with no number attached. "Improve the mobile checkout experience" is not a recommendation, it is a mood. Fix: every recommendation gets a bookings-per-month estimate, a confidence word, and an effort word, in a table, with the finding stated before the methodology rather than after it.
Quick self-check
Answer these out loud, in full sentences, without scrolling back up.
You merge five step tables onto a 120,000-row visitor table and end with 121,077 rows against 120,000 unique keys. Name the cause, the construction that makes it impossible, and which denominators were wrong and in which direction.
158 visitors appear at checkout with no property-page view, all from one channel, booking at 62.7 percent against 48.4 percent for everyone else. Name what that contrast fails to control for and the within-channel number that replaces it, give the three explanations you would test and say which your columns cannot separate, and name the funnel number that has to change.
Mobile is 17 percent better than desktop at search-to-property and 48 percent worse at checkout-to-booked. Say what that shape implies about the mechanism, and the wrong conclusion a one-number comparison produces.
Direct standardization moves the device gap from 2.19 points to 1.72 points. Explain what that calculation did, what the 21 percent means, and what you would recommend differently had it come back at 90 percent.
Home-to-search loses 48,182 visitors and property-to-checkout loses 29,217. Show the arithmetic that makes the second one the priority, and name the assumption inside it doing the most work.
Mobile checkout-to-booked drops 11.4 points on 15 March with a z of 6.35 while desktop moves minus 0.4 points. Say why the desktop number is the important half of that sentence, and name one alternative the data cannot rule out.