7.1 Event-Level SQL: Deltas, Sessions, and Segments
Find the core decision, design, or behavior signal.
Turn the lesson into a concise response blueprint.
Name the trap you would avoid in a real interview.
Use these checkpoints as your reading path before diving into the full lesson.
- 1Why this matters in interviews
- 2The event log you are handed
- 3Pattern 1: the gap between consecutive...
- 4The problem as stated
- 5The two decisions to state before typing
Almost every SQL screen in a product data science loop is one of four shapes wearing a costume. You get an event log, one row per thing a user did, and you are asked to measure the space between rows, to keep only the newest few rows per user, to glue rows into visits, or to compare who shows up in one log against who shows up in another. This lesson gives you those four patterns as finished queries you can write from muscle memory, plus the follow-up question that arrives thirty seconds after your query runs and the reason each one is asked.
Why this matters in interviews
The SQL round is not testing whether you know that LAG exists. It is testing whether you can turn a vague product sentence into a row-level definition without being told the edge cases, and whether you notice when your own query answers a slightly different question than the one asked.
Here is what a weak forty-five minutes sounds like. The candidate hears "time between the last two visits", writes a self-join on the events table, spends eight minutes debugging why it returns four million rows, and never mentions what happens to a user with a single event. Correct-ish query, no judgment shown.
Here is the stronger version. "I need the gap between the final event and the one before it, per user. That is LAG over a partition by user ordered by timestamp, plus a descending row number so I can keep only the last row. Users with one event will produce NULL, and I will keep them as NULL rather than dropping them, because the count of one-event users is itself a number the PM wants. Timestamp ties are possible in a click log, so I will add the event id as a tie-break to make the result deterministic." That is the same query with four decisions narrated. The interviewer scores the narration.
Three prompts collapse into this one lesson:
How long between a user's last two actions?
Show me the last three pages each user saw before they left.
What share of users are on the app, the web, or both?
And one that almost nobody is asked directly but that every one of the above secretly depends on: what counts as a visit?
Interview tip: Before writing any window function, say the partition and the order out loud. "Partition by user, order by timestamp ascending." Nine out of ten bugs in this round are a wrong partition or a missing tie-break, and saying it first catches both.
The event log you are handed
The running example is Kestrel, a fictional recipe app with a grocery cart attached. It has roughly 6,000 weekly active accounts and logs one row per screen view. Everything in this lesson runs against a single table.
| Column | Type | What it holds |
|---|---|---|
event_id | bigint | Monotonic write-order key, unique across the whole log |
user_id | int | The signed-in account that generated the view |
page | text | One of home, search, recipe, cart, checkout, account |
platform | text | web or app, from the client that emitted the event |
event_ts | bigint | Unix epoch seconds, UTC |
Two derived tables show up in the last pattern, web_events and app_events, which are just the two platform slices stored separately. That split is artificial in a well-run warehouse and completely normal in a real one, because the mobile client and the website were usually instrumented by different teams in different years.
This block builds the whole thing deterministically. It needs only pandas and numpy, and every number quoted later in the lesson comes out of it.
import numpy as np
import pandas as pd

SEED = 20260807
rng = np.random.default_rng(SEED)
N_USERS = 6000
EPOCH = 1767225600                      # 2026-01-01T00:00:00Z, in seconds

n_sess = rng.poisson(1.9, N_USERS) + 1                       # visits per user
sess_user = np.repeat(np.arange(1, N_USERS + 1), n_sess)
sess_start = EPOCH + rng.integers(0, 27 * 86400, sess_user.size)

n_ev = rng.poisson(2.6, sess_user.size) + 1                  # views per visit
ev_user = np.repeat(sess_user, n_ev)
head = np.cumsum(n_ev) - n_ev                                # first row of each visit
within = np.arange(ev_user.size) - np.repeat(head, n_ev)
gap = np.where(within > 0, rng.gamma(2.0, 55.0, ev_user.size), 0.0)
cum = np.cumsum(gap)
offset = cum - np.repeat(cum[head] - gap[head], n_ev)        # seconds into the visit

web_taste = rng.beta(1.4, 1.6, N_USERS)                      # per-user web propensity
pages = np.array(["home", "search", "recipe", "cart", "checkout", "account"])

events = pd.DataFrame({
    "user_id": ev_user,
    "event_ts": (np.repeat(sess_start, n_ev) + offset).astype(np.int64),
    "page": rng.choice(pages, ev_user.size, p=[.24, .27, .28, .11, .05, .05]),
    "platform": np.where(rng.random(ev_user.size) < web_taste[ev_user - 1], "web", "app"),
}).sort_values(["user_id", "event_ts"], kind="stable").reset_index(drop=True)
events.insert(0, "event_id", np.arange(1, len(events) + 1))

web_events = events.loc[events.platform == "web", ["event_id", "user_id", "page", "event_ts"]]
app_events = events.loc[events.platform == "app", ["event_id", "user_id", "page", "event_ts"]]
That gives 62,168 rows across 6,000 accounts and 28 calendar days, 29,404 of them from web and 32,764 from the app. Sixty accounts have exactly one event. Hold onto that number, it decides the shape of the first answer.
event_id  user_id    event_ts    page platform
       1        1  1767515808  recipe      app
       2        1  1768085588    cart      app
       3        1  1768085679    cart      app
       4        2  1767228707  search      web
       5        2  1767228762    home      web
Notice what the generator does and does not encode. Visits are real, with a burst of views a couple of minutes apart, then a long silence. The platform on each row is drawn independently from a per-user taste parameter, so an account's platform mix carries no information about how engaged it is. That second fact becomes the punchline of the fourth pattern.
If you want to run the SQL below locally, load these frames into DuckDB or SQLite and query them by name. Every query in this lesson was executed that way before it was written down.
Pattern 1: the gap between consecutive events
The problem as stated
"For each account, how many seconds passed between their last screen view and the one before it? If an account has only ever done one thing, that is fine, decide what to return and defend it."
The two decisions to state before typing
First, what a user with one event returns. You can drop them or return NULL. Return NULL and keep the row. Dropping them silently changes your denominator, and if 60 of 6,000 accounts vanish from the answer, the recipient of your query will compute a rate against 6,000 anyway and be quietly wrong. Keeping the NULL forces the conversation.
Second, ties. Two rows can share a timestamp if the client batches events or if the log is second-resolution, which this one is. Without a tie-break, "the last event" is whichever row the engine happened to emit last, and that can change between runs. Add event_id as a secondary sort key and the result is reproducible.
The query
WITH ordered AS (
  SELECT
    user_id,
    event_ts,
    LAG(event_ts) OVER (PARTITION BY user_id
                        ORDER BY event_ts, event_id) AS prev_ts,
    ROW_NUMBER() OVER (PARTITION BY user_id
                       ORDER BY event_ts DESC, event_id DESC) AS rn_desc
  FROM events
)
SELECT user_id,
       event_ts AS last_event_ts,
       event_ts - prev_ts AS seconds_since_previous
FROM ordered
WHERE rn_desc = 1
ORDER BY user_id;
Two window functions, one pass, then a filter. The filter has to live outside because a window function cannot appear in a WHERE clause of the same SELECT. Window functions are evaluated after WHERE and before ORDER BY, so the engine has no value to test yet. That is not a quirk to memorize, it is the reason the CTE exists, and saying so is worth a point.
Also note the two windows use opposite sort directions on purpose. The LAG walks forward in time so that prev_ts means the event before this one. The row number walks backward so that rank 1 is the newest. Getting these to agree is where candidates lose ten minutes.
The output
| user_id | last_event_ts | seconds_since_previous |
|---|---|---|
| 1 | 1768085679 | 91 |
| 2 | 1768878220 | 68 |
| 3 | 1768867898 | 98 |
| 4 | 1769158786 | 124 |
| 5 | 1769002226 | 125 |
| 7 | 1768517953 | 136567 |
Six thousand rows, 5,940 with a value and 60 NULL, exactly the single-event accounts.
A second version worth knowing
If the interviewer says "no LAG, do it another way", pivot on the row number instead:
WITH ranked AS (
  SELECT user_id, event_ts,
         ROW_NUMBER() OVER (PARTITION BY user_id
                            ORDER BY event_ts DESC, event_id DESC) AS rn
  FROM events
)
SELECT user_id,
       MAX(CASE WHEN rn = 1 THEN event_ts END)
     - MAX(CASE WHEN rn = 2 THEN event_ts END) AS seconds_since_previous
FROM ranked
WHERE rn <= 2
GROUP BY user_id;
This returns identical values. It also handles the one-event case for free, because MAX(CASE WHEN rn = 2 ...) over an empty set is NULL and NULL subtraction propagates. Aggregating a conditional is the general trick for "give me the value from a specific ranked row", and you will use it again in the second pattern.
The follow-up you will actually get
"Fine. What is the average gap?"
Run it and you get 37,617 seconds, about ten and a half hours. The median is 97 seconds. Report the mean and you have told your PM that people take half a day between clicks.
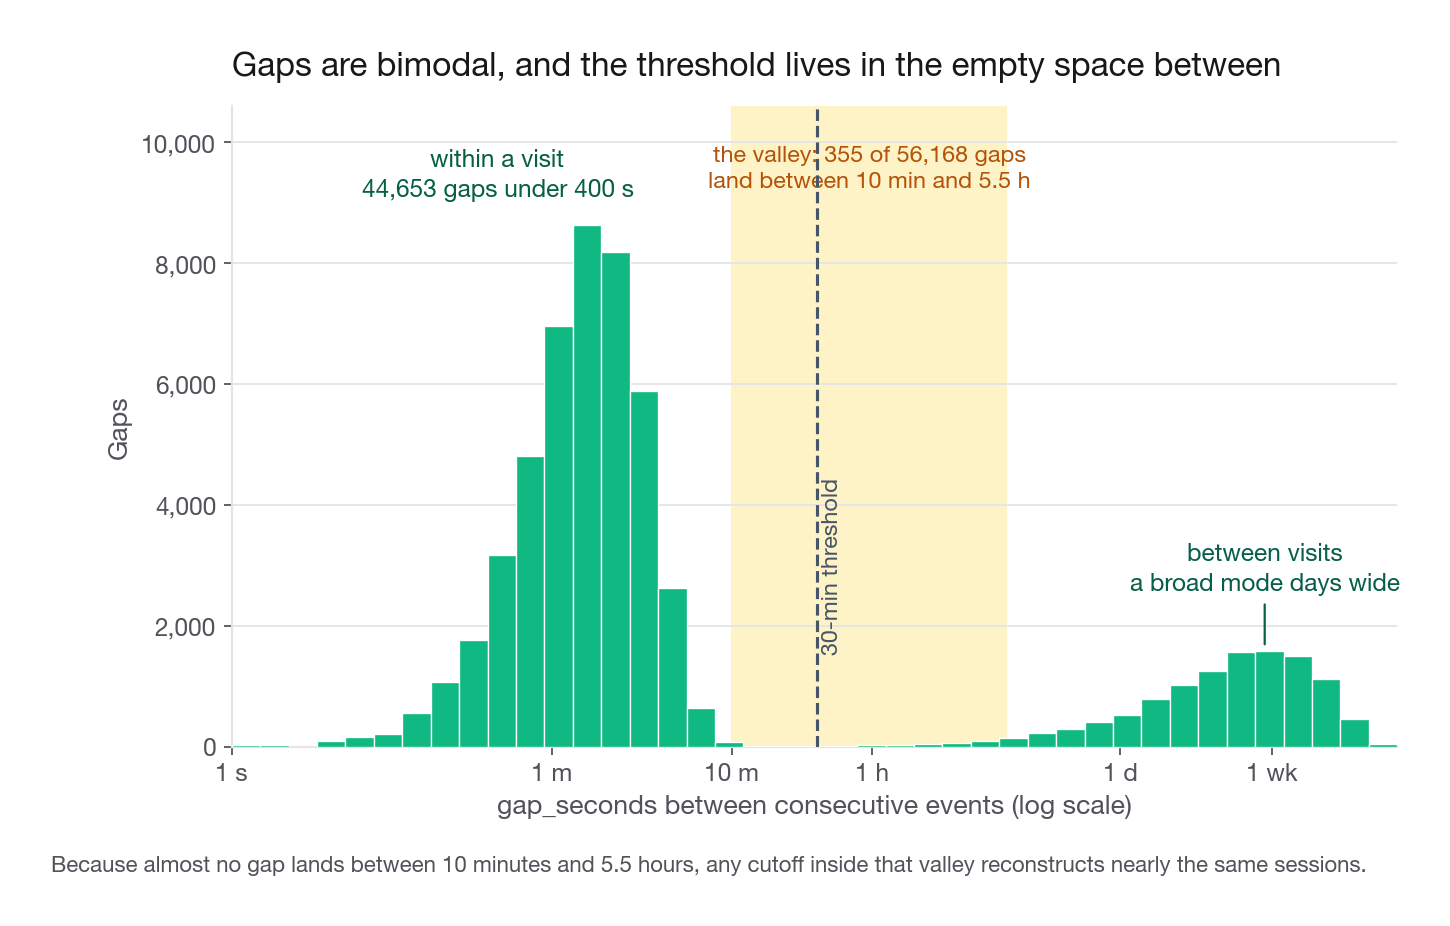
The mean is not wrong, it is answering a different question. Only 6.3 percent of those 5,940 gaps exceed thirty minutes, but those 376 rows drag the average up by a factor of 345 relative to the 109-second mean of everything under thirty minutes. What those 376 rows encode is not slow clicking, it is a user closing the app and coming back tomorrow. User 7 in the table above sits at 136,567 seconds, which is a day and a half.
The right answer has three parts: quote the median, say that the distribution is a mixture of within-visit gaps and between-visit gaps, and offer to separate them. The separation is the third pattern.
Interview tip: Any time you compute a duration from an event log, state the mean and the median together. If they differ by more than about 3x you are averaging across a boundary you have not modeled yet, and naming that boundary is the answer they want.
Pattern 2: the last N events per user
The problem as stated
"Show me the last three pages each account visited, newest first, with the platform they were on."
This is the top-N-per-group problem, and it is the single most reused window pattern in product analytics. Last three pages before churn, last five searches before a purchase, the three most recent support tickets per account. Same query, different nouns.
The query
WITH ranked AS (
  SELECT user_id, event_ts, page, platform,
         ROW_NUMBER() OVER (PARTITION BY user_id
                            ORDER BY event_ts DESC, event_id DESC) AS recency_rank
  FROM events
)
SELECT user_id, recency_rank, page, platform, event_ts
FROM ranked
WHERE recency_rank <= 3
ORDER BY user_id, recency_rank;| user_id | recency_rank | page | platform | event_ts |
|---|---|---|---|---|
| 1 | 1 | cart | app | 1768085679 |
| 1 | 2 | cart | app | 1768085588 |
| 1 | 3 | recipe | app | 1767515808 |
| 2 | 1 | cart | web | 1768878220 |
| 2 | 2 | search | app | 1768878152 |
| 2 | 3 | cart | app | 1768878035 |
Why ROW_NUMBER and not something else
This is where interviewers probe. There are three ranking functions and they behave differently on ties, which matters because your filter is <= 3.
| Function | On a tie | Rows kept by a <= 3 filter | Right for top-N per group? |
|---|---|---|---|
ROW_NUMBER() | Assigns distinct 1, 2, 3 arbitrarily | Exactly 3, always | Yes, when you need a fixed count |
RANK() | Repeats the rank, then skips | Could be 2, could be 40 | Only when ties must all survive |
DENSE_RANK() | Repeats the rank, no skip | Could be far more than 3 | Only when you want the top 3 distinct values |
For "give me three rows per user", ROW_NUMBER is the only one that guarantees three. But arbitrary tie-breaking is arbitrary, which is why the event_id in the ORDER BY matters, and it is why the same query run twice on the same data gives the same answer. The broader ranking toolkit, including bucketing users into quantiles, is the next lesson's material.
The other reason to reach for ROW_NUMBER over a correlated subquery or a lateral join is cost. One sort per partition, one pass. A self-join that counts how many later events exist per row is quadratic inside each user, and on a log with a whale who generated 40,000 events it will not finish.
The count that surprises people
Six thousand users times three rows should be 18,000. The query returns 17,698. The 302-row shortfall is the 242 accounts that never accumulated three events, which contribute one or two rows each.
That gap is a gift. It means "how many accounts have fewer than three events" is answerable from the same CTE, and volunteering it makes you look like someone who has shipped a dashboard rather than someone who has passed a quiz.
The pivot variant
When the consumer wants one row per user, usually because it is feeding a model or a spreadsheet, collapse the ranks into columns with the same conditional-aggregate trick from Pattern 1:
WITH ranked AS (
  SELECT user_id, page,
         ROW_NUMBER() OVER (PARTITION BY user_id
                            ORDER BY event_ts DESC, event_id DESC) AS recency_rank
  FROM events
)
SELECT user_id,
       MAX(CASE WHEN recency_rank = 1 THEN page END) AS last_page,
       MAX(CASE WHEN recency_rank = 2 THEN page END) AS page_before,
       MAX(CASE WHEN recency_rank = 3 THEN page END) AS page_before_that
FROM ranked
WHERE recency_rank <= 3
GROUP BY user_id;| user_id | last_page | page_before | page_before_that |
|---|---|---|---|
| 1 | cart | cart | recipe |
| 2 | cart | search | cart |
| 3 | recipe | cart | home |
| 4 | recipe | search | search |
| 5 | search | search | recipe |
Accounts with two events get a NULL in the third column instead of disappearing, which is the behavior you want.
If the warehouse is Snowflake, BigQuery, or DuckDB you can drop the CTE entirely and write QUALIFY recency_rank <= 3 on the same select. Mention that you know it exists and that you wrote the portable version deliberately. Volunteering a dialect shortcut and then not using it reads as fluency. Using it without flagging it reads as luck.
Interview tip: When you filter on a window function, say "I need the CTE because window functions are evaluated after WHERE". It takes four seconds and it separates people who understand the execution order from people who copied the pattern.
Pattern 3: turning an event stream into visits
Nobody asks this one as a warm-up. It arrives as "what is our average session length" or "how many sessions per user per week", and the SQL is only half the answer. The other half is that a session is a product definition you have to choose.
The definition comes first
There is no session id in this log, and there is none in most raw logs. A session is manufactured by declaring an inactivity threshold: if two consecutive events from the same account are more than T seconds apart, they belong to different visits. Everything downstream inherits that choice.
Say this out loud before you write anything: "There is no session column, so I will construct one with an inactivity gap. I will use thirty minutes to start, and then show you how sensitive the answer is to that choice." That single sentence is the difference between a candidate who ran a query and one who designed a metric.
The three-step query
The pattern is gap, flag, cumulative sum. It is worth learning as a shape because it solves every "group consecutive rows that belong together" problem, not just sessions.
WITH gapped AS (
  SELECT user_id, event_id, event_ts, page,
         event_ts - LAG(event_ts) OVER (PARTITION BY user_id
                                        ORDER BY event_ts, event_id) AS gap_seconds
  FROM events
),
flagged AS (
  SELECT *,
         CASE WHEN gap_seconds IS NULL OR gap_seconds > 1800
              THEN 1 ELSE 0 END AS starts_session
  FROM gapped
),
keyed AS (
  SELECT *,
         SUM(starts_session) OVER (PARTITION BY user_id
                                   ORDER BY event_ts, event_id
                                   ROWS BETWEEN UNBOUNDED PRECEDING
                                            AND CURRENT ROW) AS session_seq
  FROM flagged
)
SELECT user_id, session_seq, event_ts, page, gap_seconds
FROM keyed
ORDER BY user_id, event_ts;
Step one measures the distance to the previous event. Step two turns that into a boolean: this row opens a new visit if the gap is too big, or if there is no previous event at all, which is what the IS NULL branch handles for each account's very first row. Step three runs a cumulative sum of that boolean, which produces 1 for the first visit, 2 after the first big gap, and so on. Concatenate user_id with session_seq and you have a session key.
Here is account 2, whose ten events land in three visits:
| session_seq | event_ts | page | gap_seconds |
|---|---|---|---|
| 1 | 1767228707 | search | NULL |
| 1 | 1767228762 | home | 55 |
| 2 | 1768849630 | search | 1620868 |
| 2 | 1768849760 | search | 130 |
| 2 | 1768849928 | home | 168 |
| 3 | 1768877998 | search | 28070 |
| 3 | 1768878020 | checkout | 22 |
| 3 | 1768878035 | cart | 15 |
The 1,620,868-second gap is nineteen days. The 28,070-second gap is under eight hours, still comfortably a new visit.
The frame clause and what it actually buys you
ROWS BETWEEN UNBOUNDED PRECEDING AND CURRENT ROW looks like ceremony you can skip. The usual justification for keeping it is wrong, though, so learn the right one, because the wrong one is the kind of thing a strong SQL interviewer will correct you on. If you omit the frame, the SQL standard default for an ordered window is RANGE BETWEEN UNBOUNDED PRECEDING AND CURRENT ROW, and RANGE groups peers: every row that ties on the full ORDER BY gets the whole peer group's total instead of its own running total.
For this particular query that turns out to be harmless, and it is worth knowing why rather than guessing. Two reasons stack. First, event_ts, event_id is a total order, so no two rows are ever peers and RANGE degenerates into ROWS. Second, even if you drop the tie-break and order by event_ts alone, a tied row's LAG is its tied neighbour, so its gap is 0, so it can never carry starts_session = 1, and the peer-group total equals the running total anyway. I ran all six combinations of frame and sort order across Kestrel's 62,168 rows, including its 6 tied-timestamp pairs, and every one produced byte-identical session numbers.
Where RANGE genuinely bites is a running sum of a value rather than of a start flag. Take four orders at timestamps 1, 2, 2 and 3 for 10, 20, 30 and 40. Under ROWS the running total reads 10, 30, 60, 100. Under the default RANGE it reads 10, 60, 60, 100, because the two orders inside second 2 both report the pair's combined figure rather than their own. Write ROWS anyway. It costs six words, it is the habit you want when the next query is summing revenue, and it puts the frame you meant on the page instead of in your head.
The thing that really can drop two simultaneous events into different visits is not the frame, it is an inconsistent ORDER BY. Order the LAG by event_ts, event_id and the SUM by event_ts, event_id DESC, feed it a tied pair straddling the threshold, and the session numbers come back 1, 2, 1, 2 instead of 1, 2, 2, 2, under ROWS and RANGE alike. Use the identical ordered window in every step of the chain, and say that out loud, because it is the failure a good interviewer is actually waiting for.
Rolling up to session level
SELECT user_id,
       session_seq,
       COUNT(*)                       AS events_in_session,
       MIN(event_ts)                  AS session_start,
       MAX(event_ts) - MIN(event_ts)  AS session_seconds,
       MAX(CASE WHEN page = 'checkout' THEN 1 ELSE 0 END) AS reached_checkout
FROM keyed
GROUP BY user_id, session_seq;
Against Kestrel's log at a thirty-minute threshold that yields 17,229 sessions over 6,000 accounts: 3.61 events per session, 288 seconds of median-ish duration, 7.4 percent of sessions consisting of a single event, and 16.6 percent of sessions touching checkout.
Two of those numbers are traps. A single-event session has a duration of exactly zero, because the last-minus-first arithmetic has nothing to subtract. So the average of 288 seconds is deflated by 7.4 percent of rows that are structurally zero rather than genuinely instant. If your product question is "how long do people stay", exclude single-event sessions and say why. If it is "how much do we get out of a visit", keep them, because a bounce is a real outcome.
Choosing the threshold instead of inheriting it
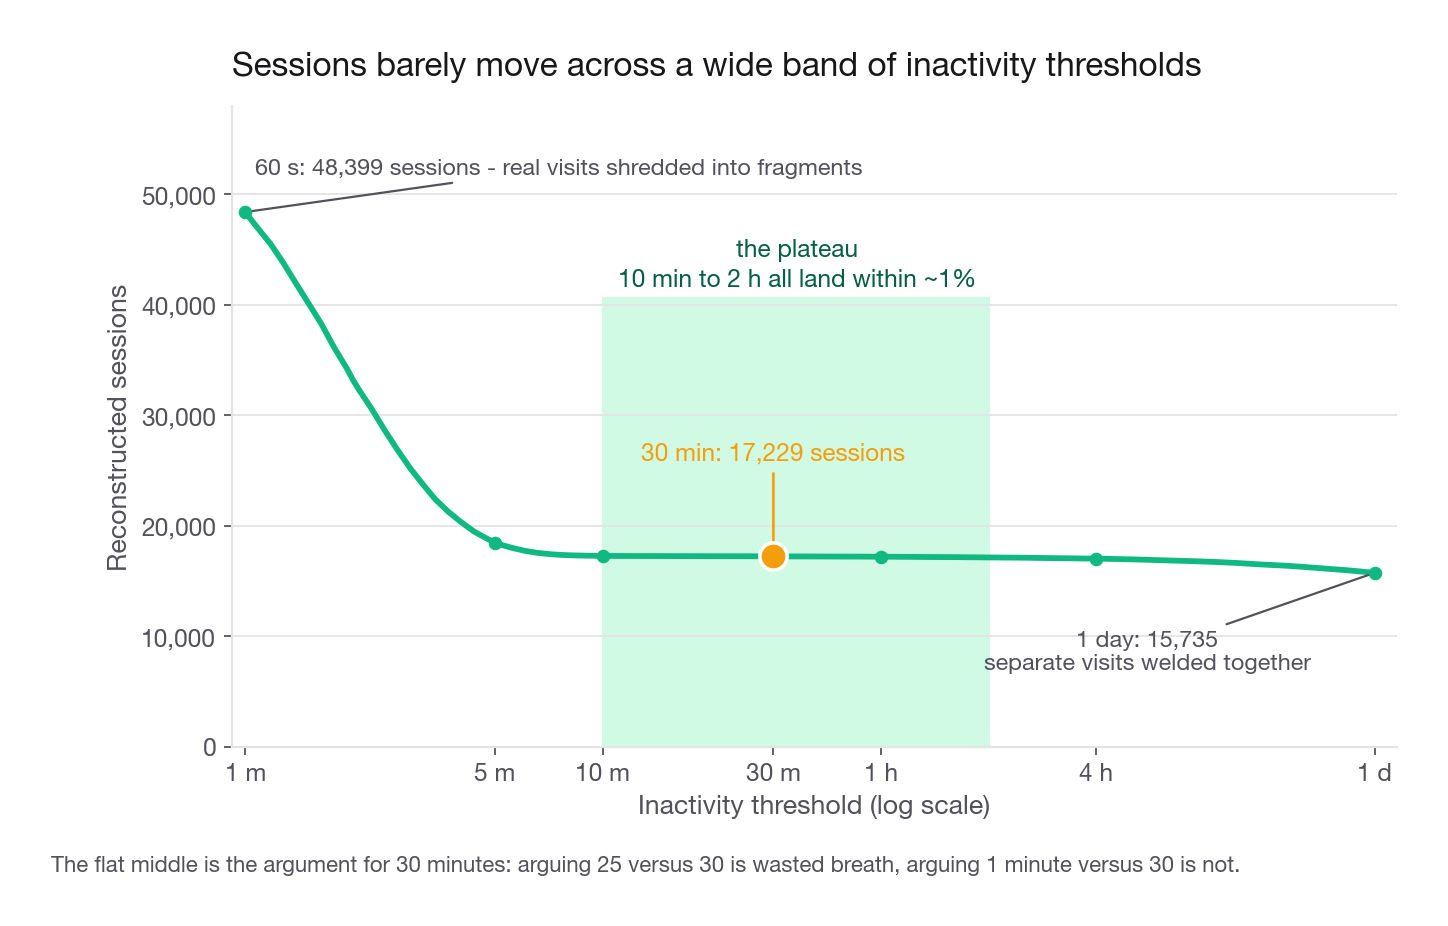
The honest defense of thirty minutes is not that it is the industry convention. It is that the answer barely moves across a wide band, and you can show that in one query.
| Threshold | Sessions | Events per session | Mean duration (s) |
|---|---|---|---|
| 60 s | 48,399 | 1.28 | 10 |
| 120 s | 33,221 | 1.87 | 56 |
| 300 s | 18,468 | 3.37 | 243 |
| 600 s | 17,270 | 3.60 | 285 |
| 1,800 s | 17,229 | 3.61 | 288 |
| 3,600 s | 17,195 | 3.62 | 294 |
| 14,400 s | 17,024 | 3.65 | 383 |
| 86,400 s | 15,735 | 3.95 | 4,445 |
Everything from ten minutes to four hours lands within 1.5 percent of the same session count. Below five minutes the definition shreds real visits into fragments, and at a full day it starts welding separate visits together and inflating duration fifteen-fold. That plateau is the argument. Arguing about twenty-five versus thirty minutes is wasted breath, arguing about one minute versus thirty is not.
There is one more honesty point available here. The generator created 17,270 true visits. Thirty-minute reconstruction recovers 17,229, so it merges 41 of them, because a few randomly placed visits happened to start within half an hour of the previous one ending. Sessionization is lossy by construction, and if you can say that without being asked you have signalled that you understand the difference between a measurement and the thing measured.
Interview tip: If asked for average session length and there is no session column, never answer with a number. Answer with the threshold you chose, one sentence on why, and the sensitivity band. The number itself is the least interesting part of the answer.
Pattern 4: who is on web, app, or both
The problem as stated
"We have a web event table and an app event table. What percentage of accounts appear only in web, only in app, and in both? The three should add to 100."
Why a full outer join
An inner join finds only the overlap. A left join finds web plus the overlap and loses app-only accounts entirely. You need the union of the two key sets with a marker for which side each key came from, and that is exactly what a full outer join produces: matched rows have both keys populated, unmatched rows have a NULL on the side they are missing from.
Deduplicate first. If you join the raw event tables, an account with 12 web views and 9 app views produces 108 rows, and your percentages become percentages of row pairs rather than of accounts.
WITH web_users AS (SELECT DISTINCT user_id FROM web_events),
     app_users AS (SELECT DISTINCT user_id FROM app_events),
     merged AS (
       SELECT w.user_id AS web_id, a.user_id AS app_id
       FROM web_users w
       FULL OUTER JOIN app_users a ON w.user_id = a.user_id
     )
SELECT
  ROUND(100.0 * SUM(CASE WHEN app_id IS NULL THEN 1 ELSE 0 END) / COUNT(*), 1)
    AS pct_web_only,
  ROUND(100.0 * SUM(CASE WHEN web_id IS NULL THEN 1 ELSE 0 END) / COUNT(*), 1)
    AS pct_app_only,
  ROUND(100.0 * SUM(CASE WHEN web_id IS NOT NULL AND app_id IS NOT NULL
                         THEN 1 ELSE 0 END) / COUNT(*), 1) AS pct_both,
  COUNT(*) AS accounts
FROM merged;| pct_web_only | pct_app_only | pct_both | accounts |
|---|---|---|---|
| 6.7 | 9.5 | 83.8 | 6000 |
COUNT(*) over the merged set is the union count, 6,000, because every account touched at least one platform. That is the correct denominator and it is worth naming, since a careless version divides by the web-user count and produces shares above 100 percent.
The integer division landmine
Write the numerator as 100 * instead of 100.0 * and PostgreSQL will do integer division on integer inputs and truncate every share. Here that turns 6.73, 9.46 and 83.8 into 6, 9 and 83, which sum to 98. The requirement said the three should reach 100, and the query silently fails it.
This is the single most common bug in this problem and it does not throw an error. Multiply by 100.0, or cast one operand, or use AVG of the indicator instead of SUM over COUNT. Then check the sum yourself before presenting it.
The version I would actually write
The full outer join is what the question is fishing for, but it extends badly. Add a third platform, say a smart TV client, and you need a three-way full outer join with a COALESCE chain to recover the key. The tag-and-aggregate form scales linearly:
WITH tagged AS (
  SELECT user_id, 1 AS on_web, 0 AS on_app FROM web_events
  UNION ALL
  SELECT user_id, 0, 1 FROM app_events
),
per_user AS (
  SELECT user_id,
         CASE WHEN MAX(on_web) = 1 AND MAX(on_app) = 1 THEN 'both'
              WHEN MAX(on_web) = 1                     THEN 'web_only'
              ELSE                                          'app_only' END AS segment
  FROM tagged
  GROUP BY user_id
)
SELECT segment,
       COUNT(*) AS accounts,
       ROUND(100.0 * COUNT(*) / SUM(COUNT(*)) OVER (), 1) AS pct_of_accounts
FROM per_user
GROUP BY segment
ORDER BY accounts DESC;| segment | accounts | pct_of_accounts |
|---|---|---|
| both | 5028 | 83.8 |
| app_only | 568 | 9.5 |
| web_only | 404 | 6.7 |
Identical answer, one row per segment instead of one row of three columns, and it stays readable at five platforms. The SUM(COUNT(*)) OVER () is an aggregate inside a window, which computes the grand total alongside the group counts without a second scan or a subquery. That construction alone tends to earn a nod.
Sanity-check the arithmetic in your head: 5,028 both-platform accounts plus 404 web-only is 5,432 web users, and 5,028 plus 568 is 5,596 app users. Both match a direct COUNT(DISTINCT user_id) on each source table. Reconciling your segments against their marginals takes ten seconds and catches join mistakes that percentages hide.
The follow-up that decides your score
"Multi-platform accounts average 11.1 events versus 6.5 for single-platform. Should we push web users to install the app?"
The tempting answer is yes. The correct answer is that this comparison cannot support that recommendation, and the reason is mechanical rather than statistical subtlety.
Segment membership is defined by the events themselves. An account lands in "both" only if at least one event fell on each platform, so the probability of being labelled "both" rises with event count no matter what drives that count. In this log, platform is drawn per event from a fixed per-account preference, so the label carries literally zero behavioral information, and the pattern still appears:
| Events in the log | Share labelled "both" |
|---|---|
| 1 | 0.00 |
| 2 | 0.35 |
| 3 | 0.58 |
| 5 | 0.75 |
| 7 | 0.85 |
| 10 | 0.90 |
| 12 | 0.94 |
An account with one event is never multi-platform. An account with a dozen is 94 percent likely to be. The 11.1-versus-6.5 gap is that arithmetic reflected back at you, not an effect of installing an app.
What you propose instead: define the segment on a window that precedes the outcome window. Segment on platform usage in January, measure engagement in February, and if you want to tighten it further, match accounts on their January activity level. Then the label is at least fixed before the thing you are measuring happens. Name what you must not do as well, because it is the most common wrong answer to this prompt: do not control for total event count. Events is the outcome under dispute, so stratifying on it drives the gap to zero by construction. Split Kestrel's accounts into event-count deciles and the 4.63-event gap collapses to 0.14, and inside an exact event count the two groups have identical means by definition. Rerun the same stratification on simulated data where multi-platform use genuinely triples engagement and the unconditional gap is 7.4 while the within-decile gap is still 0.10, so that comparison cannot tell a real effect from a null. And say the honest version out loud: the only clean read is randomizing the install prompt, because self-selection into multi-platform use is exactly the variable you cannot control for.
Interview tip: Whenever a segment is defined by behavior and then compared on more behavior, say "this segment is downstream of the metric" and offer a pre-period definition. It is the fastest way to show causal instincts in a SQL round.
Choosing the pattern under time pressure
The reason to memorize the mapping rather than the queries is that interviewers rename the nouns. "Days between a customer's last two orders" is Pattern 1. "The three most recent support tickets per account" is Pattern 2. "How many separate shopping trips did this user take" is Pattern 3. "Which subscribers are in the trial table, the paid table, or both" is Pattern 4. The SQL does not change.
How to run the forty minutes
Two habits from that list carry most of the weight. Naming the grain stops you from computing per-event answers to per-user questions, which is the most common silent failure. Reconciling against a marginal is the only thing that catches a join fanout before the interviewer does.
Common traps
Putting a window function in WHERE. It does not parse, and candidates then assume the whole approach is wrong. Fix: wrap it in a CTE and filter outside, or use QUALIFY if the dialect has it. Say why, that windows are evaluated after WHERE.
Omitting a tie-break in the ORDER BY. With second-resolution timestamps, "the last event" is nondeterministic and your answer changes between runs. Fix: add a monotonic id as the last sort key in every window and every top-N filter.
Assuming the default window frame is ROWS. Omit it and you get RANGE BETWEEN UNBOUNDED PRECEDING AND CURRENT ROW, which hands every tied row the whole peer group's total. Harmless for a cumulative sum of a 0/1 start flag, wrong for a running total of a value, where two orders in the same second both report the pair's combined revenue. Fix: write ROWS BETWEEN UNBOUNDED PRECEDING AND CURRENT ROW explicitly, every time, and keep the ORDER BY identical across every window in the chain.
Dropping single-event users without saying so. Sixty accounts here, one percent, and every rate computed downstream is then wrong in the third digit. Fix: return NULL and report the count of NULLs as part of the answer.
Reporting a mean duration from a mixed distribution. The 37,617-second average versus the 97-second median is the whole lesson in two numbers. Fix: report both, then split within-visit from between-visit gaps.
Integer division in a percentage. 100 * x / n truncates in PostgreSQL and your three shares sum to 98. Fix: 100.0, or cast, and always check that the parts sum to the whole before you present.
Joining event tables without deduplicating. A full outer join on raw logs multiplies rows per user and the resulting percentages are meaningless. Fix: SELECT DISTINCT user_id in each side first, or aggregate to one row per key.
Treating a session count as ground truth. Thirty minutes is a choice, and at Kestrel it merges 41 real visits out of 17,270. Fix: present the threshold, the sensitivity band, and the direction of the bias.
Comparing behavior across behaviorally defined segments. Multi-platform accounts look more engaged because being multi-platform requires more events. Fix: define the segment on a strictly earlier window, or randomize.
Counting sessions with a self-join instead of a window. It works on 60,000 rows and dies on 60 million. Fix: one ordered window pass, and say the complexity difference out loud if the interviewer asks about scale.
Quick self-check
Answer these out loud, in full sentences, without looking back at the queries.
Write the window clause for "seconds since this user's previous event" and explain, in one sentence each, why the partition, the sort direction, and the tie-break column are all necessary.
A query returning the last three events per user gives 17,698 rows for 6,000 users instead of 18,000. State the cause, and write the query that returns the count of users responsible.
Describe the gap-flag-cumulative-sum pattern in three sentences without writing SQL, then explain why omitting the
ROWSframe happens not to change this particular result, and construct a running-total query where omitting it does.Your average session duration is 288 seconds and 7.4 percent of sessions have exactly one event. Explain how those two facts interact, and give the two different numbers you would report for two different product questions.
Three platform shares come back as 6, 9, and 83. Name the bug, name the database behavior that causes it, and give two ways to fix it.
Someone shows you that accounts using both web and app average 11.1 events against 6.5 for single-platform accounts, and proposes an install campaign. Give the mechanical reason the comparison is uninformative, and the two study designs that would let you answer the question properly.